Algorand: Why THIS signal points to another 10% ALGO drop

ambcryptoPublished on 2026-04-09Last updated on 2026-04-09

Abstract

Algorand (ALGO) has declined by 10% in the past day, with technical analysis suggesting further downside. The price was rejected at the upper Bollinger Band, indicating overvaluation, and is now expected to move toward the middle band, implying a potential additional 10% drop. The strengthening downtrend is supported by a rising Average Directional Index (ADX). Futures market activity reinforces the bearish outlook, with over $6.5 million exiting ALGO perpetual contracts and a sharp drop in the Open Interest Weighted Funding Rate, signaling increased short positioning. However, spot investors are accumulating ALGO, with nearly $496,000 in inflows in the past day and $1.98 million over the week, which may cushion further declines or prompt a reversal if sustained.

Algorand [ALGO] recorded a 10% drop over the past day, at press time, as the market adjusted. This move may mark the start of a broader decline, based on technical patterns observed on the chart.

Other factors, particularly activity in the perpetual futures market, are likely to play a major role in adding pressure and extending the current downside.

Bollinger Bands signal further downside

Bollinger Bands, an indicator used to assess whether an asset is overvalued or undervalued while identifying potential support and resistance levels, suggest that further downside may be imminent.

This outlook follows ALGO’s rejection at the upper band (red), which acted as resistance and signaled an overvaluation zone, pushing price lower. Such rejections typically drive price toward the middle band, or neutral zone, marked in blue, as seen on several occasions in the past.

Source: TradingView

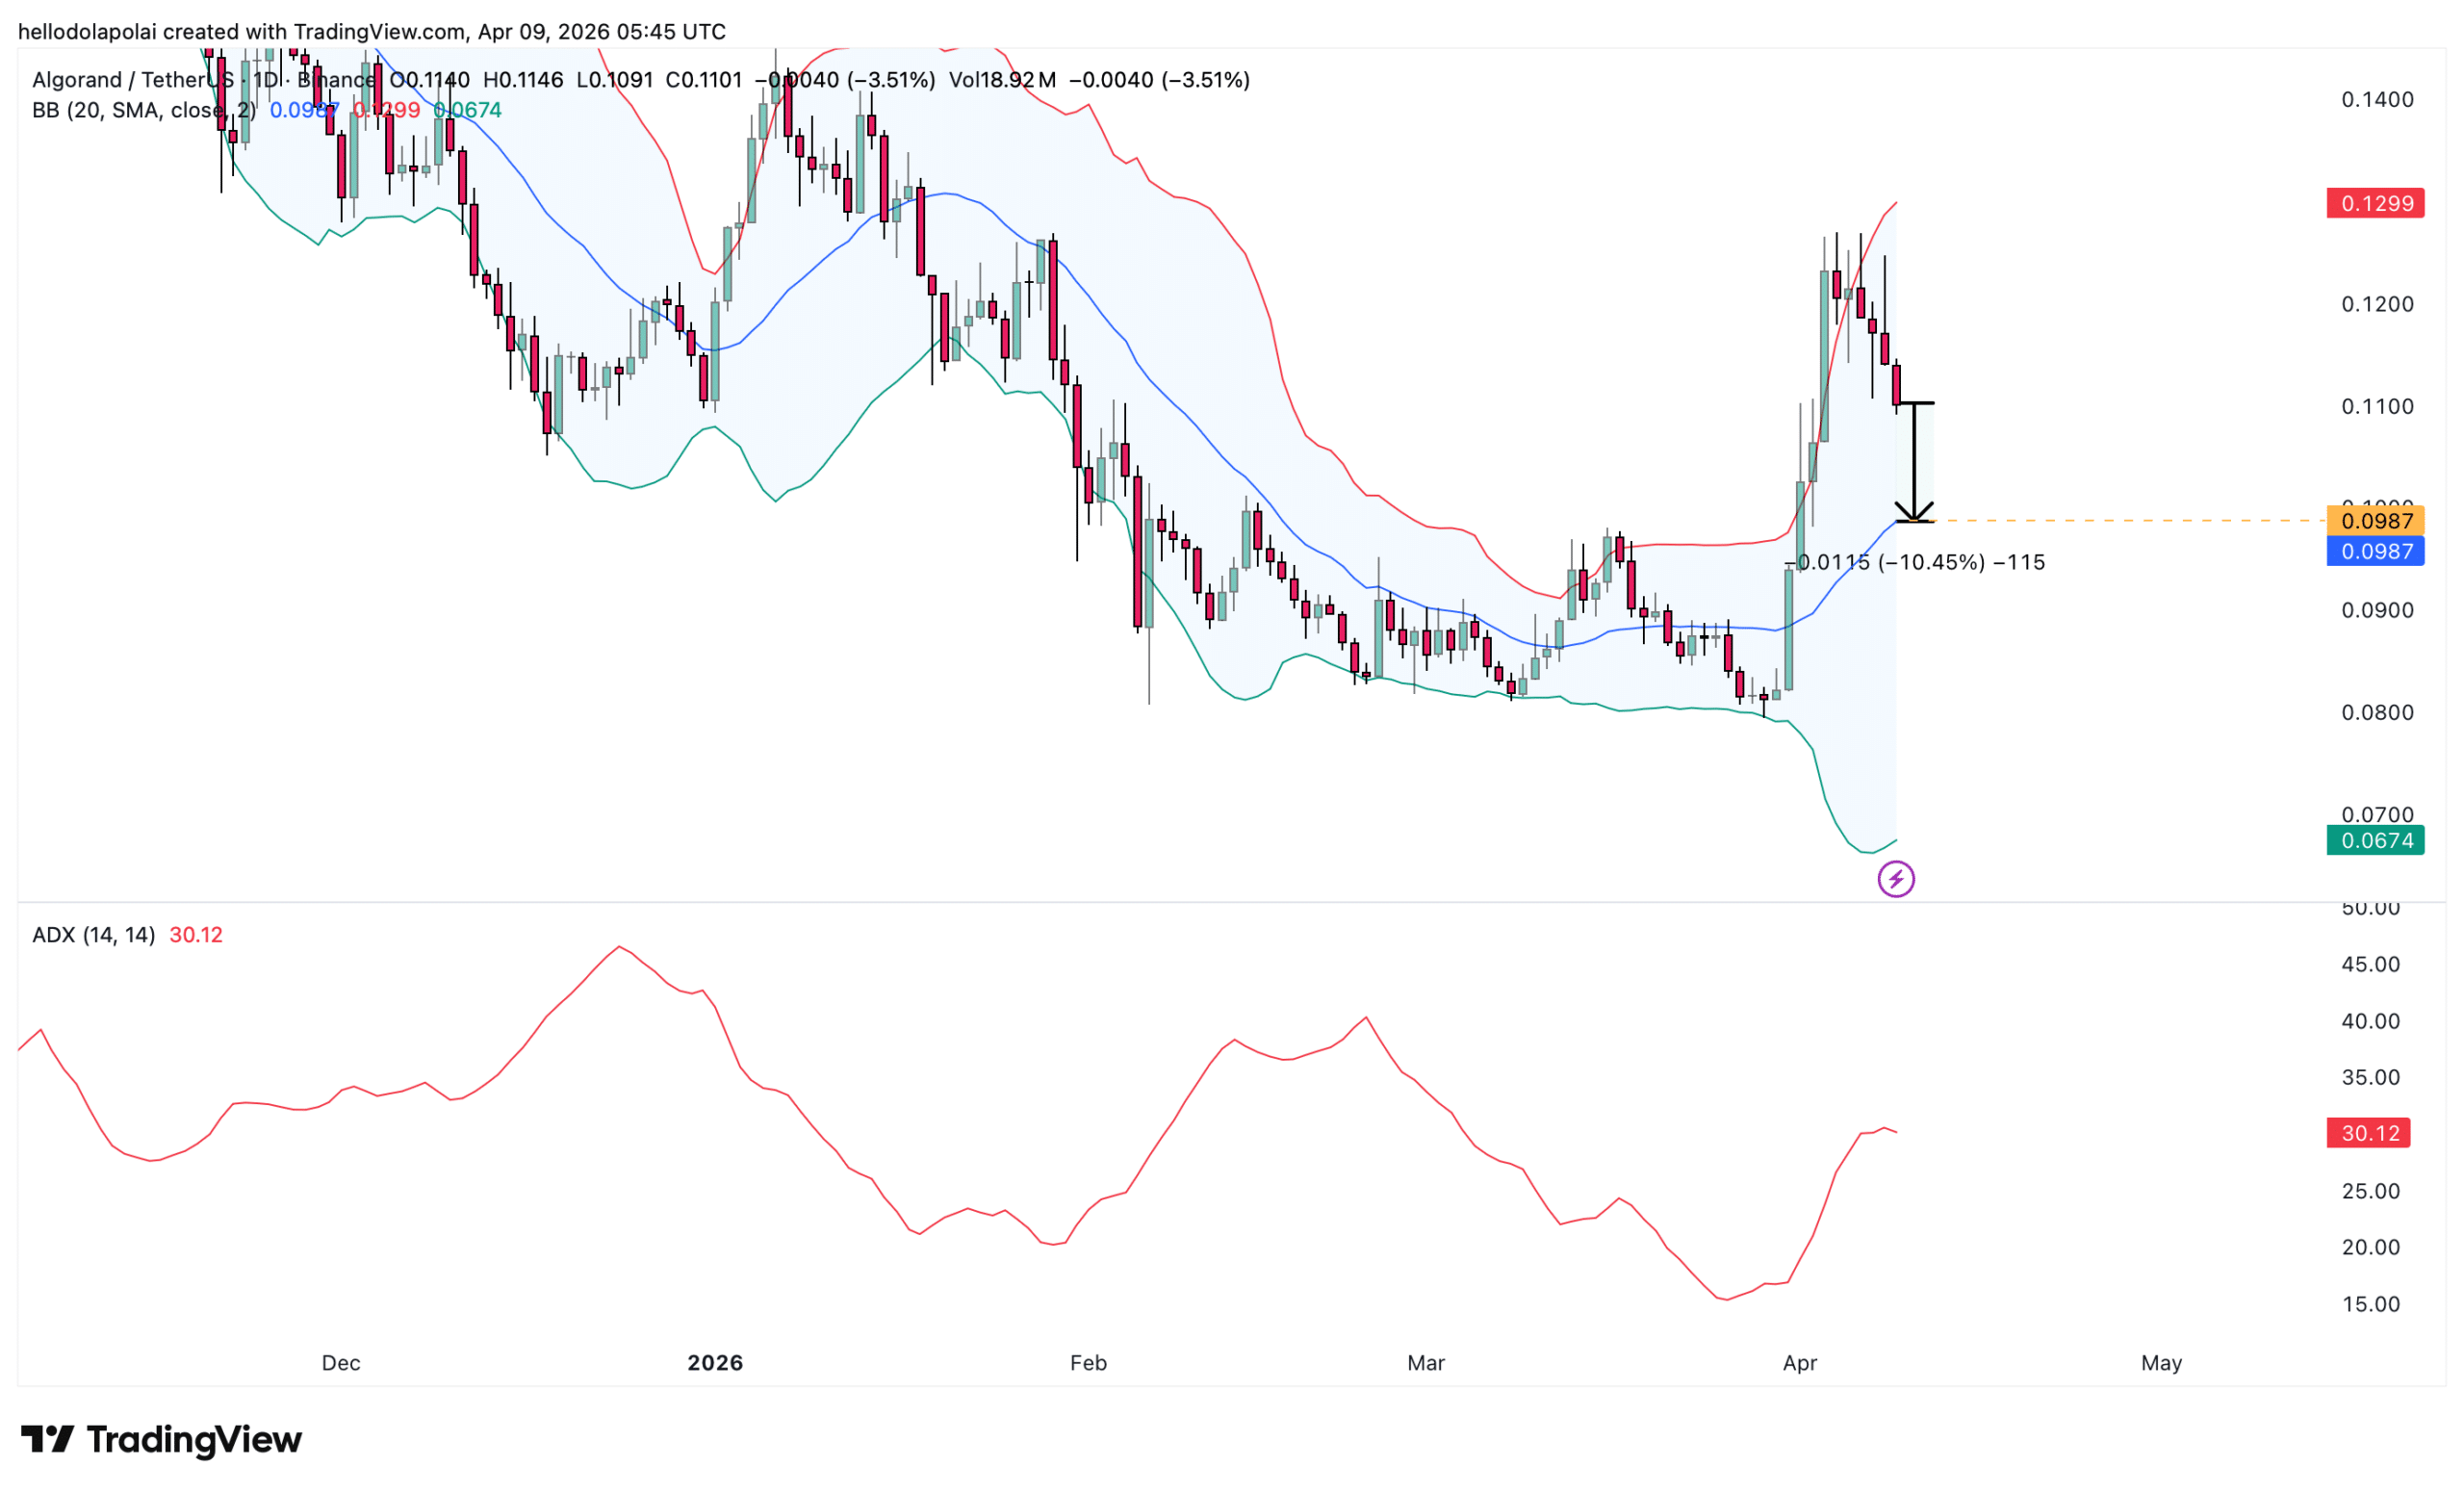
Notably, price has yet to approach this middle region. The gap between the current price of $0.677 and the middle band implies a potential additional decline of roughly 10%. The likelihood of continued downside is further supported by the trend-based indicator, the Average Directional Index (ADX), which is trending upward as price moves lower.

ADX measures trend strength. When it rises while price declines, it indicates that the prevailing downtrend is strengthening and may persist.

Futures market adds pressure

Activity in the Futures market has not supported price stability and instead points to an acceleration of the decline.

Over the past day, the market has seen a significant capital outflow, with more than $6.5 million exiting ALGO’s perpetual contracts as the broader cycle weakens.

Source: CoinGlass

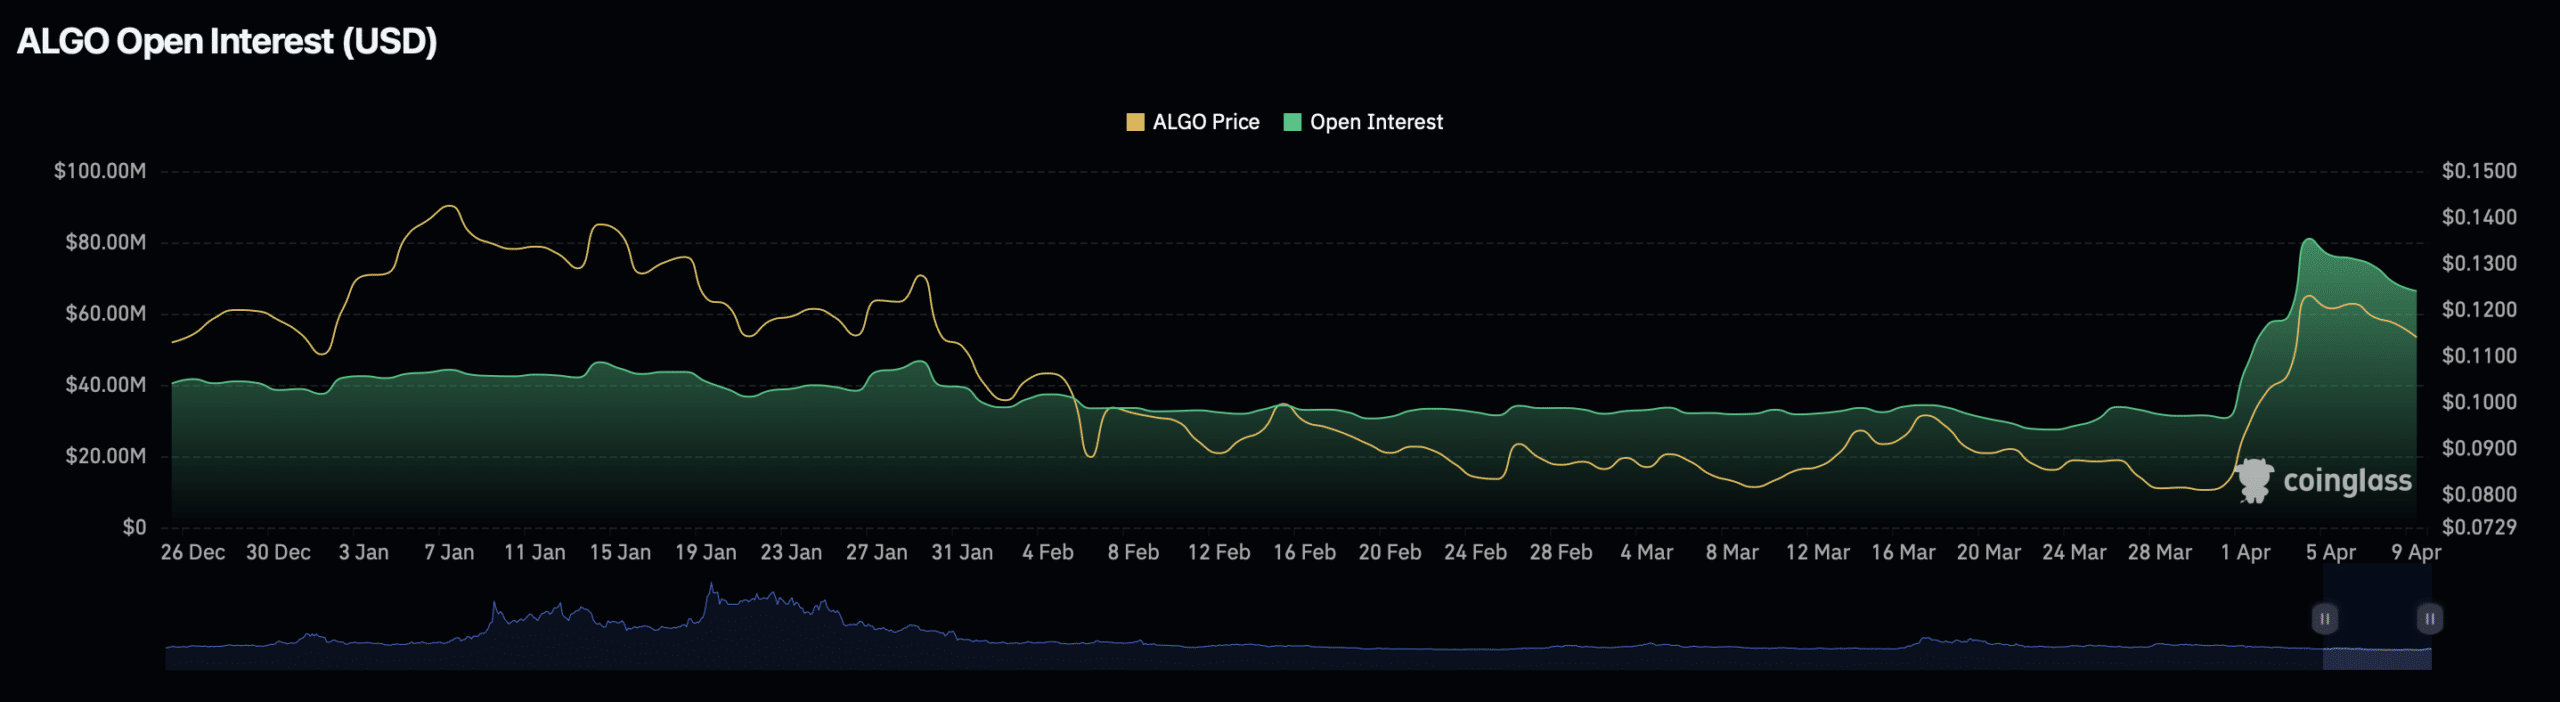
This outflow aligns with a sharp shift in positioning. At press time, the Open Interest Weighted Funding Rate dropped from 0.0073% to 0.0027% over the past 24 hours, reflecting a decline in long positions. This trend suggests a rise in short positions on ALGO, a typical signal when traders anticipate further downside.

For context, between the 7th and 8th of April, ALGO maintained a bullish outlook. However, short sellers have been proven correct, and the price has fallen over the last 24 hours. Spot investors appear to be the key group mitigating further downside, even as short positions continue to build in the derivatives market.

In the past day alone, the spot market recorded nearly $496,000 in inflows into ALGO despite the price decline, signaling accumulation at lower levels. This forms part of a broader trend. Over the past week, spot investors have consistently accumulated ALGO, with total purchases reaching $1.98 million.

Source: CoinGlass

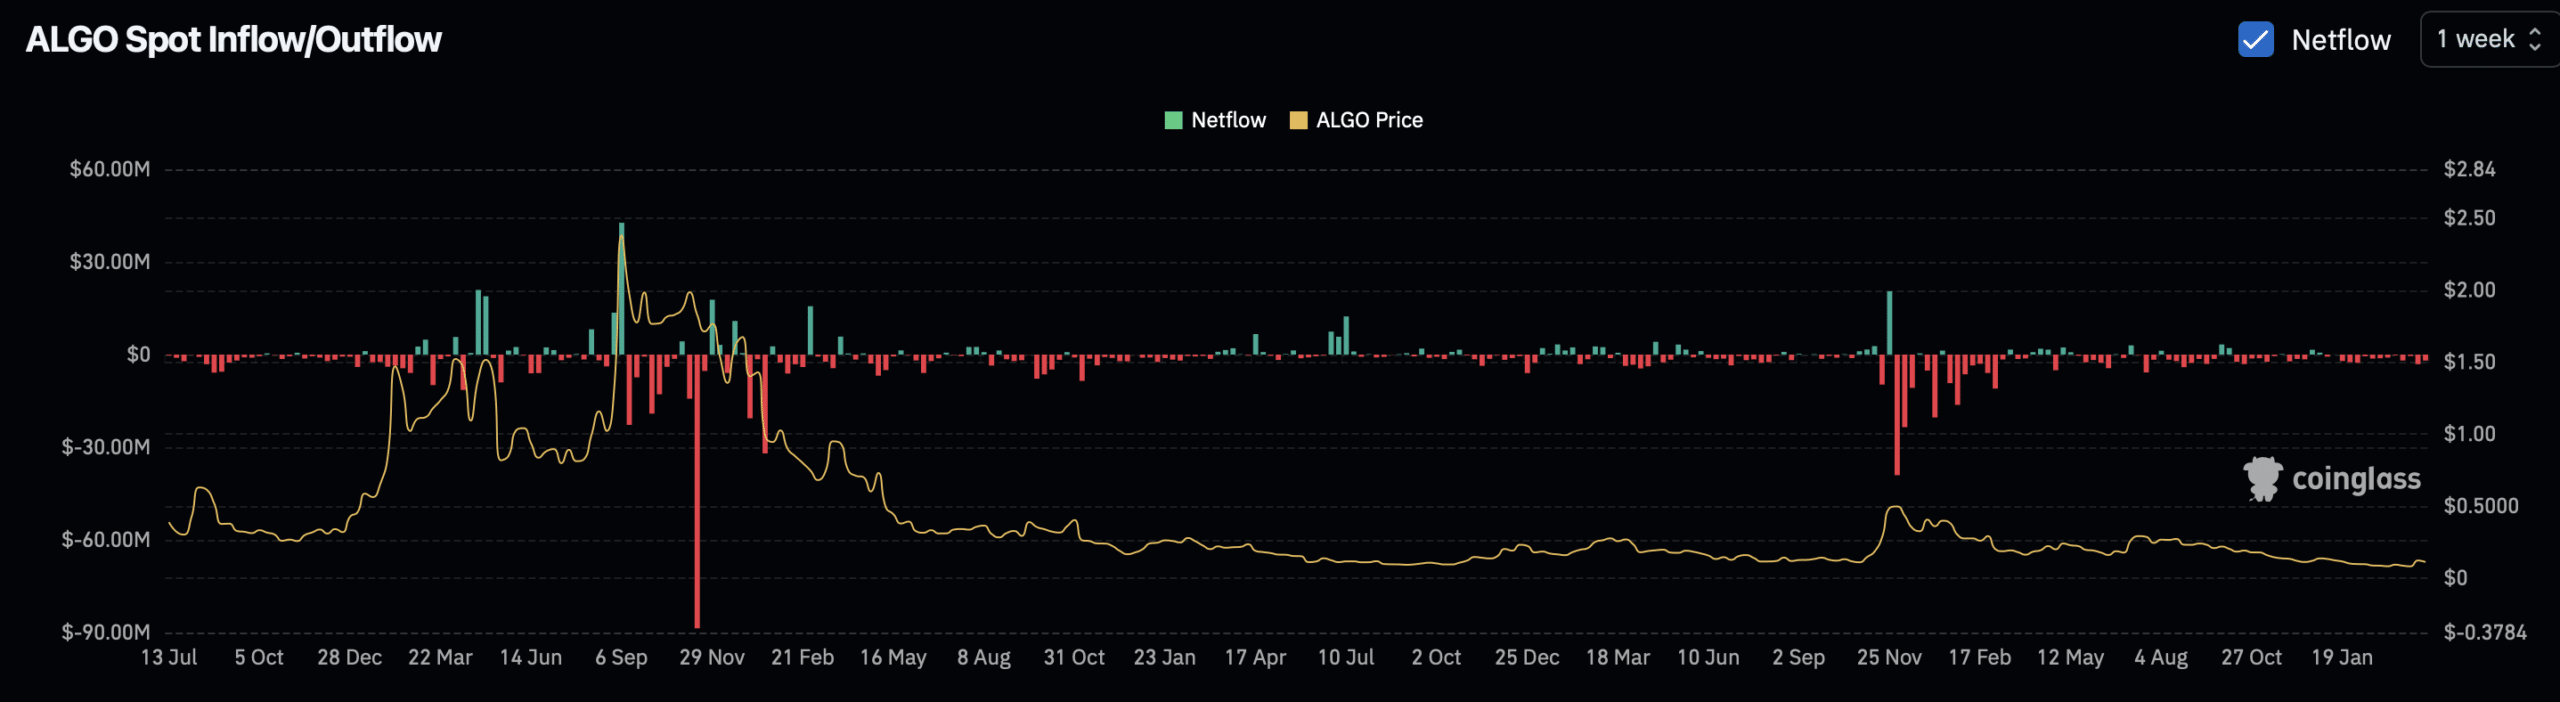
This places the average daily net inflow as of writing, at approximately $396,000.

Sustained accumulation in the spot market could help cushion ALGO’s downside. If buying pressure remains strong, it may limit losses or even trigger a reversal before the projected decline fully plays out.


Final Summary

  • ALGO may witness an additional 10% decline as indicators point to a move toward fair value.
  • Perpetual traders may intensify the ongoing sell-off, while spot investors appear to view the dip as a discount and continue accumulating ALGO.

Related Questions

QWhat technical indicator suggests that Algorand (ALGO) may experience a further 10% decline in price?

AThe Bollinger Bands indicator suggests a further downside. The price was rejected at the upper band, signaling an overvaluation, and the gap between the current price and the middle band implies a potential additional decline of roughly 10%.

QHow did the activity in the perpetual futures market contribute to the downward pressure on ALGO's price?

AActivity in the perpetual futures market added downward pressure with a significant capital outflow of over $6.5 million from ALGO's contracts. The Open Interest Weighted Funding Rate also dropped, reflecting a decline in long positions and a rise in short positions as traders anticipated further downside.

QWhat does a rising Average Directional Index (ADX) indicate when the price is declining?

AA rising Average Directional Index (ADX) while the price is declining indicates that the prevailing downtrend is strengthening and is likely to persist.

QDespite the price decline, what activity did spot investors engage in regarding ALGO?

ADespite the price decline, spot investors were accumulating ALGO. In the past day alone, the spot market recorded nearly $496,000 in inflows, and over the past week, total purchases reached $1.98 million.

QWhat could potentially limit the losses or trigger a reversal in ALGO's price according to the article?

ASustained accumulation and strong buying pressure from spot investors in the market could help cushion ALGO's downside, potentially limiting losses or even triggering a reversal before the full projected decline plays out.

Related Reads

Will the Next Crypto Bull Run Start with On-Chain Trading of SpaceX?

This article presents a scenario-based forecast for the crypto industry from 2026 to 2029, arguing that the next major cycle will be driven not by technological narratives but by legal access to real-world assets. The author predicts that by mid-2026, pre-IPO perpetual contracts for top private companies like SpaceX, OpenAI, and Anthropic on platforms like Hyperliquid will become the primary gateway for accessing quality assets, as most crypto-native tokens fail to capture real value. The much-hyped AI x Crypto intersection largely fails except for prediction markets, which thrive on betting on AI model supremacy. By 2027, public blockchain foundations are forced to choose between catering to retail speculation or building compliant infrastructure for institutions, with many opting for the latter. Growth in stablecoins and tokenized private credit/equity hits a "triple ceiling" due to regulatory and political uncertainty rather than market demand. The pivotal shift is forecast for 2028. A major liquidation event in pre-IPO perpetuals exposes the structural flaw of synthetic markets lacking a real underlying asset anchor. In response, regulatory changes finally allow the public solicitation of private securities resales to verified accredited investors. This creates a legitimate secondary market for real company equity, which then becomes the core asset class of the new bull market, relegating synthetic perps to a niche role. By 2029, the industry becomes "boring" but foundational. Tokens without claims on real cash flows or assets cease trading. Stablecoin growth is steady but politically capped. Crypto infrastructure fades from view as it gets absorbed into traditional finance backends. The article's central thesis is that the key bottleneck for crypto's next phase is legal and regulatory channels for real asset ownership, not technology.

marsbit59m ago

Will the Next Crypto Bull Run Start with On-Chain Trading of SpaceX?

marsbit59m ago

The Value Distribution of Stablecoins

**Summary: The Value Distribution of Stablecoins** The article argues that stablecoins are evolving from mere trading tools into broader channels for dollar access. It divides the stablecoin ecosystem into four layers to analyze how value is distributed: 1. **Issuance Layer:** Mints stablecoins, holds reserve assets, and captures the spread between reserve yield and user costs (e.g., Tether, Circle). This layer currently earns the largest profit margin. 2. **Infrastructure Layer:** Connects stablecoins to the traditional financial system, handling fiat on/off-ramps, banking integration, compliance (KYC/AML), and asset management (e.g., Bridge, BVNK). This is the "unglamorous" but critical work, building the essential bridges between crypto and real-world finance. 3. **Acquiring/Distribution Layer:** Integrates stablecoins into merchant systems, manages payment flows, and provides enterprise financial software (e.g., Stripe, Coinbase). They act as the access point for businesses. 4. **Application Layer:** The end-users and businesses that ultimately use stablecoins for payments, settlements, or as a store of value. They benefit from convenience but have little pricing power. The core thesis is that while the issuance layer currently dominates profits, the often-overlooked **infrastructure layer holds significant long-term potential**. The real challenge and barrier to mass adoption is not the on-chain transfer of stablecoins (which is simple), but the complex "last mile" integration into existing business workflows, banking systems, and regulatory frameworks across different countries. Companies in this layer are currently in a "land grab" phase, investing heavily to build networks, secure bank partnerships, and establish compliance pathways. While their position is currently pressured by the profitable issuers above and distribution platforms below, the article suggests that if stablecoins become a default financial rail for businesses, the infrastructure providers who have done the hard work of integration will ultimately gain strong pricing power and become entrenched, essential players.

marsbit7h ago

The Value Distribution of Stablecoins

marsbit7h ago

The Value Distribution of Stablecoins

The Value Distribution of Stablecoins The article argues that stablecoins are evolving from a mere trading tool into a broad "dollar channel." It analyzes the industry's value chain through four layers: 1. **Issuance Layer (e.g., Tether, Circle):** The top layer that mints stablecoins, holds reserve assets, and captures the thickest interest rate spread. 2. **Infrastructure Layer (e.g., Bridge, BVNK):** Connects stablecoins to the traditional financial system, handling critical but complex "dirty work" like fiat on/off-ramps, banking integration, compliance (KYC/AML), and cross-border settlement. 3. **Acquiring/Distribution Layer (e.g., Stripe, Coinbase):** Embeds stablecoins into merchant systems, manages payment flows, and integrates with enterprise software. 4. **Application Layer:** End-users and businesses that ultimately use stablecoins for payments, settlement, or storing value. The author posits that while the issuance layer currently captures the most profit, the most overlooked and potentially critical layer is infrastructure. The core challenge for stablecoin adoption isn't the on-chain transfer (which is simple), but bridging the gap between blockchain and the real-world financial system. This involves solving practical problems for businesses: fiat conversion, reconciliation, tax handling, and user onboarding. Infrastructure companies are currently in a difficult "land-grab" phase—building networks, securing banking relationships, and achieving compliance country-by-country. They face pressure from both the profitable issuance layer above and distribution platforms below. However, the author suggests this layer is building a crucial moat. Once stablecoins become a default business rail, the infrastructure players who have done the hard work of integration may gain significant, durable value and pricing power.

链捕手7h ago

The Value Distribution of Stablecoins

链捕手7h ago

Trading

Spot
Futures

Hot Articles

How to Buy ALGO

Welcome to HTX.com! We've made purchasing Algorand (ALGO) simple and convenient. Follow our step-by-step guide to embark on your crypto journey.Step 1: Create Your HTX AccountUse your email or phone number to sign up for a free account on HTX. Experience a hassle-free registration journey and unlock all features.Get My AccountStep 2: Go to Buy Crypto and Choose Your Payment MethodCredit/Debit Card: Use your Visa or Mastercard to buy Algorand (ALGO) instantly.Balance: Use funds from your HTX account balance to trade seamlessly.Third Parties: We've added popular payment methods such as Google Pay and Apple Pay to enhance convenience.P2P: Trade directly with other users on HTX.Over-the-Counter (OTC): We offer tailor-made services and competitive exchange rates for traders.Step 3: Store Your Algorand (ALGO)After purchasing your Algorand (ALGO), store it in your HTX account. Alternatively, you can send it elsewhere via blockchain transfer or use it to trade other cryptocurrencies.Step 4: Trade Algorand (ALGO)Easily trade Algorand (ALGO) on HTX's spot market. Simply access your account, select your trading pair, execute your trades, and monitor in real-time. We offer a user-friendly experience for both beginners and seasoned traders.

3.3k Total ViewsPublished 2024.03.29Updated 2026.06.02

How to Buy ALGO

Discussions

Welcome to the HTX Community. Here, you can stay informed about the latest platform developments and gain access to professional market insights. Users' opinions on the price of ALGO (ALGO) are presented below.

活动图片