Aggregate Analysis Beyond Price: Glassnode Global Metrics

insights.glassnodePublished on 2026-06-03Last updated on 2026-06-03

Abstract

Glassnode Global Metrics introduce a suite of aggregated on-chain and market metrics designed to analyze the dynamic crypto market without the distortions caused by asset reclassifications. The framework offers two data types: Raw Aggregates (original units) and scaled, base-100 Indices for continuous trend analysis. The article demonstrates the power of these indices through three examples. First, they reveal a dramatic 2024 small-cap rally invisible in raw data, where "winner" assets leaving the basket bias the raw series. Second, they provide a clearer view of profit-taking sentiment across market-cap cohorts, showing that small-cap holder sentiment is more stable than raw SOPR data suggests. Third, they isolate leverage behavior in derivatives, highlighting the higher volatility of open interest in mid- and small-cap assets during speculative phases. Currently live metrics include Total Market Cap, Median SOPR, Total Open Interest, and others, calculated for All Coins, Large, Mid, and Small Cap baskets with weekly rebalancing. The data is accessible via dedicated API endpoints for both raw and indexed series, bringing the continuity of traditional finance indices to multi-asset crypto analytics.

Aggregate market analysis has become a challenge since the digital asset space has fragmented into thousands of assets, sectors, and rapidly changing market-cap cohorts. As assets appreciate, decline, launch, or disappear, aggregate metric series develop structural discontinuities that make long-term analysis difficult.

Previously, we showcased the power of global views that aggregate metrics across the market using our Multi-Asset Explorer. We have now extended this framework with Glassnode Global Metrics — a suite of formally rebalanced aggregate metrics with continuous index normalization, available via API.

In this article, we introduce the framework, examine several examples across market capitalization, profitability, and derivatives positioning, and show what continuity-adjusted indices reveal relative to raw aggregates.

What are Glassnode Global Metrics?

Global Metrics are aggregated on-chain and market metrics computed across multiple cryptocurrencies, organized into configurable baskets. Baskets can be defined by market capitalization thresholds, top-N rankings (by any metric), or asset tags (sectors, categories). They solve a fundamental challenge in crypto analytics: how to track on-chain and market metrics across a highly dynamic group of assets over time without artificial discontinuities caused by basket composition changes, in contrast to indices that focus on price alone.

We provide two output types for each metric:

  • Raw Aggregates: True values in original units preserving economic meaning (e.g., USD for market cap, counts for active addresses)
  • Indices: Scaling-factor-adjusted, base-normalized time series for trend analysis and cross-basket comparison

What the indices reveal

Market structure: the 2024 small-cap surge

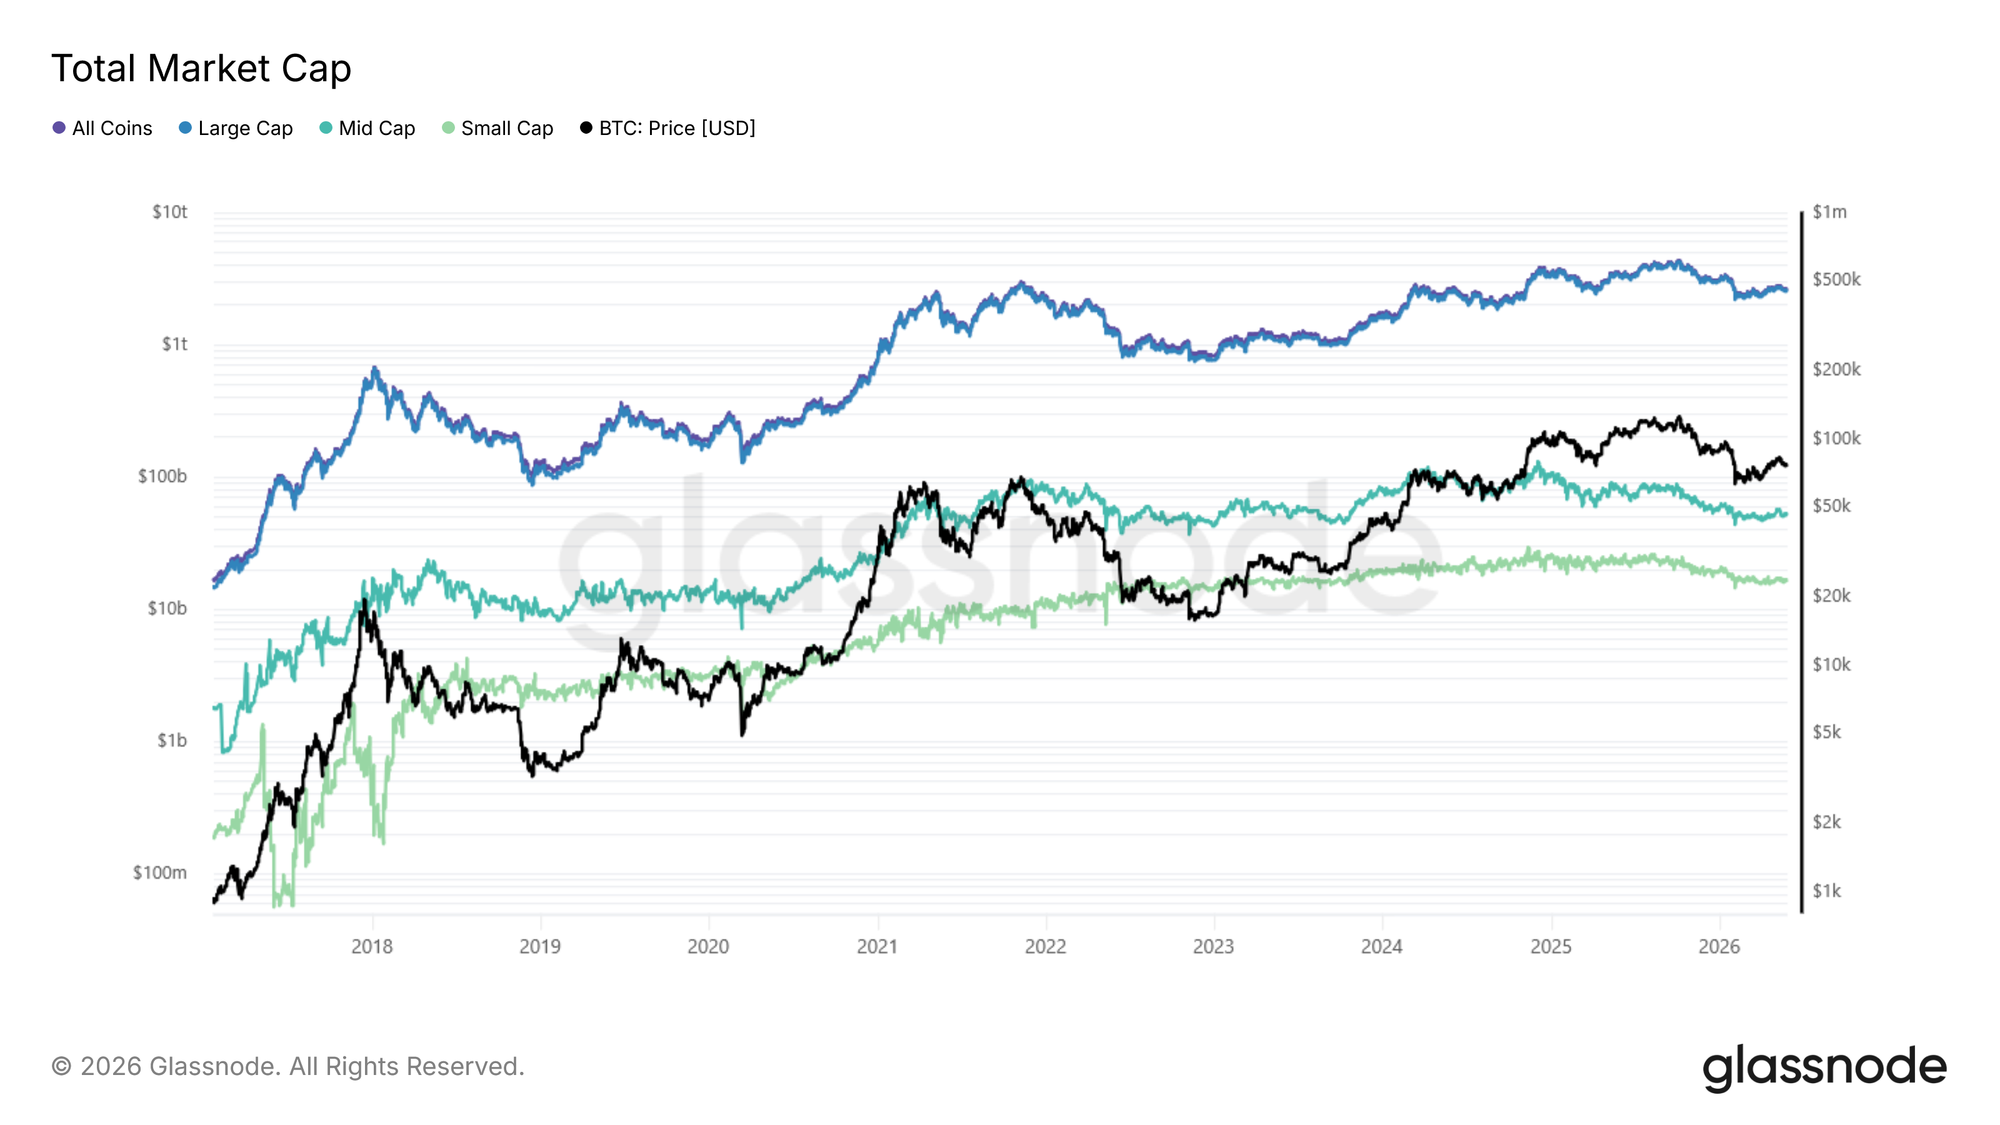
The clearest demonstration of why continuity-adjusted indices matter is the small-cap tier in 2024. The below figure presents Total Market Cap: Raw aggregate (USD, log scale) across all four baskets: All Coins, Large, Mid and Small Cap, with BTC price overlaid.

View Live Metric

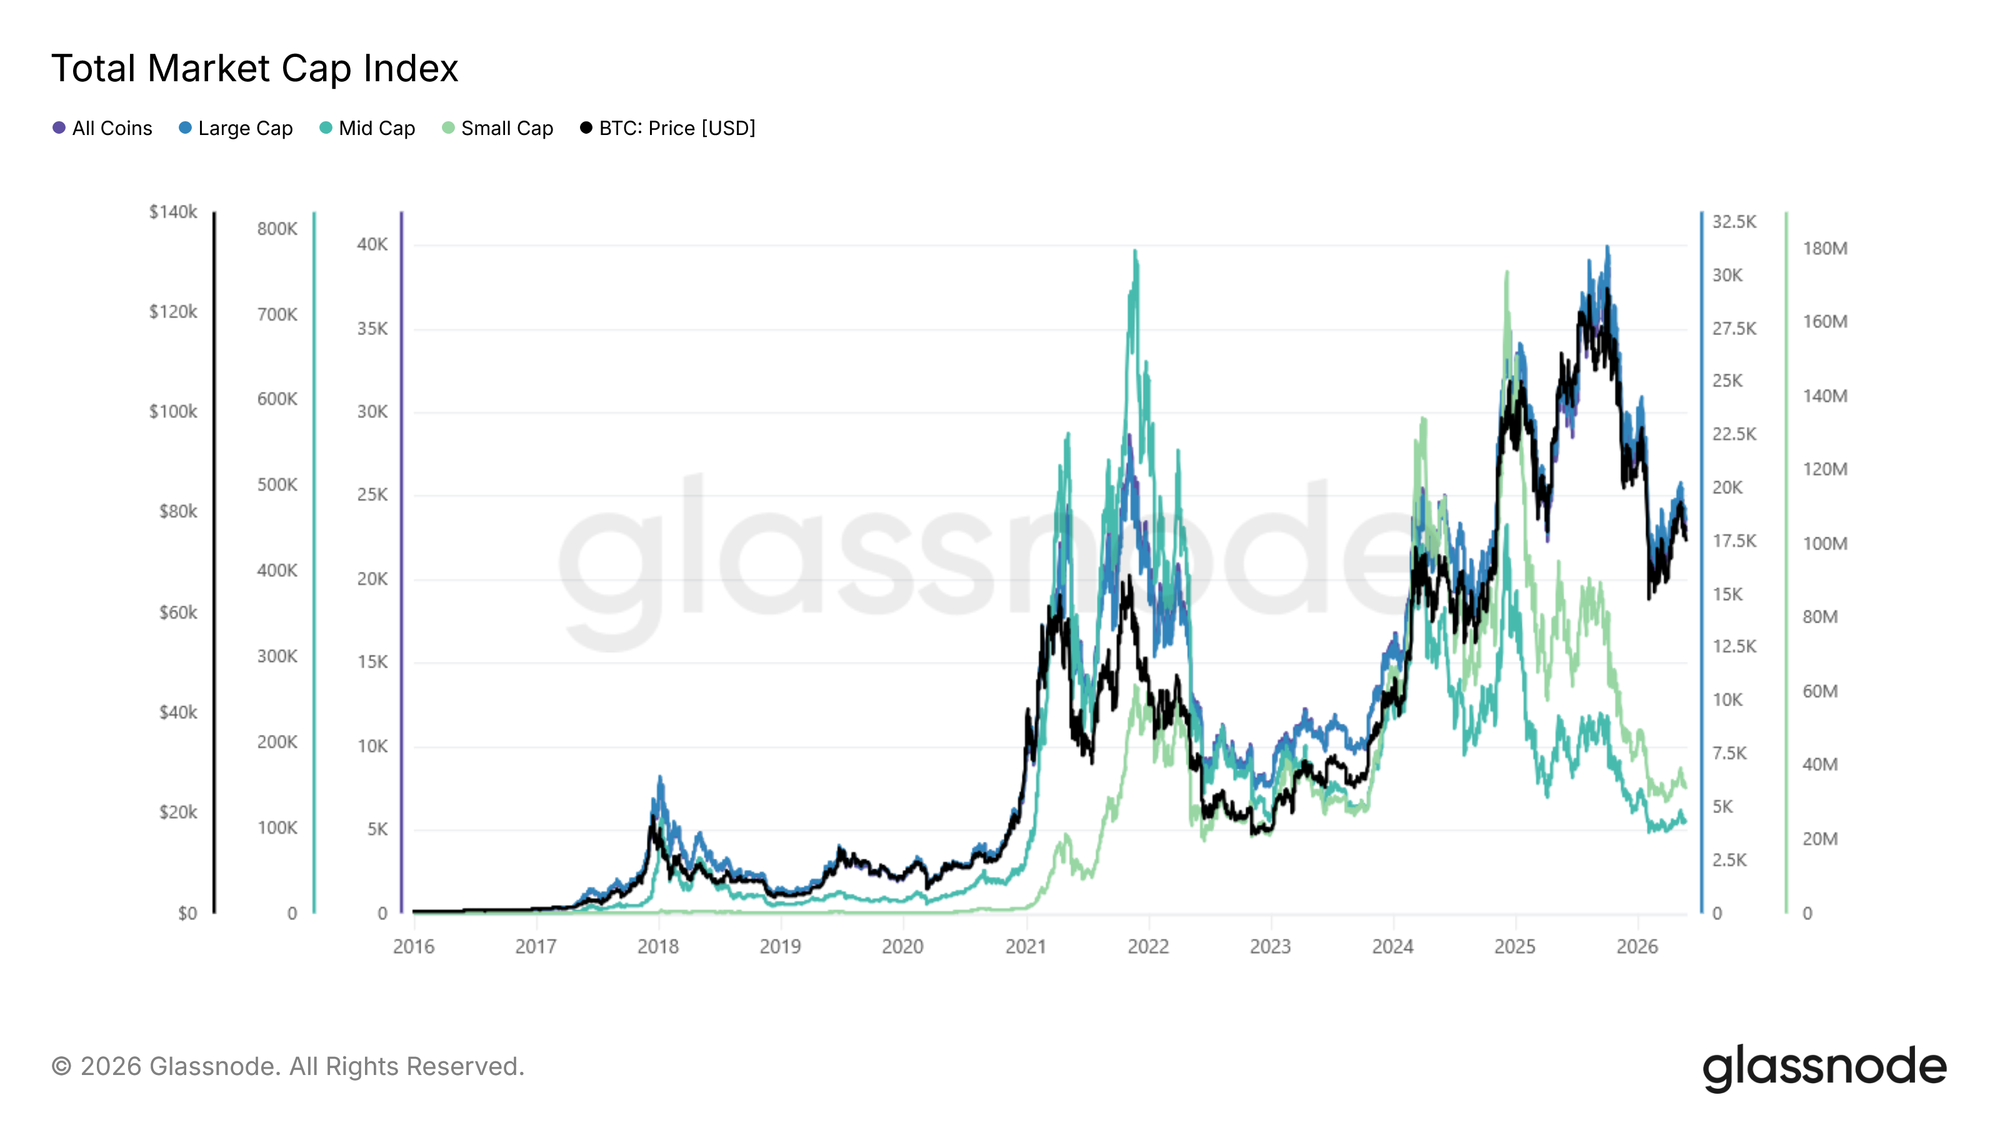
Compare to the Total Market Cap Index: scaled index (base 100) across the same four baskets. Each tier starts at 100, hence the lines are directly comparable as growth multiples.

View Live Metric

The raw small-cap series contains a structural bias: whenever a small-cap asset performs well, it eventually crosses the $100M threshold and leaves the basket, taking its gains with it. In other words, "winners leave". The raw aggregate is, by design, incapable of capturing a small-cap rally.

The index neutralizes this effect. Small-cap shot up dramatically in 2024, a move largely invisible in the raw series, driven by near-instant token creation platforms and the memecoin mania that followed.

The same chart also highlights the divergence across tiers: while large caps held up relatively well, altcoin tiers entered a prolonged drawdown. Both halves only become legible in the index.

Profit-taking Sentiment: Altcoin SOPR vs BTC SOPR

Spent Output Profit Ratio (SOPR), which measures whether coins moving on-chain are being spent at a profit (above 1) or a loss (below 1), is one of the clearest cases where a global metric adds value beyond the single-asset version. BTC SOPR and the median SOPR across altcoin baskets frequently diverge, and the spread between them becomes a signal in itself.

The following figure shows Median SOPR: Raw aggregate across all four baskets, BTC price overlaid. SOPR oscillates around 1.

View Live Metric

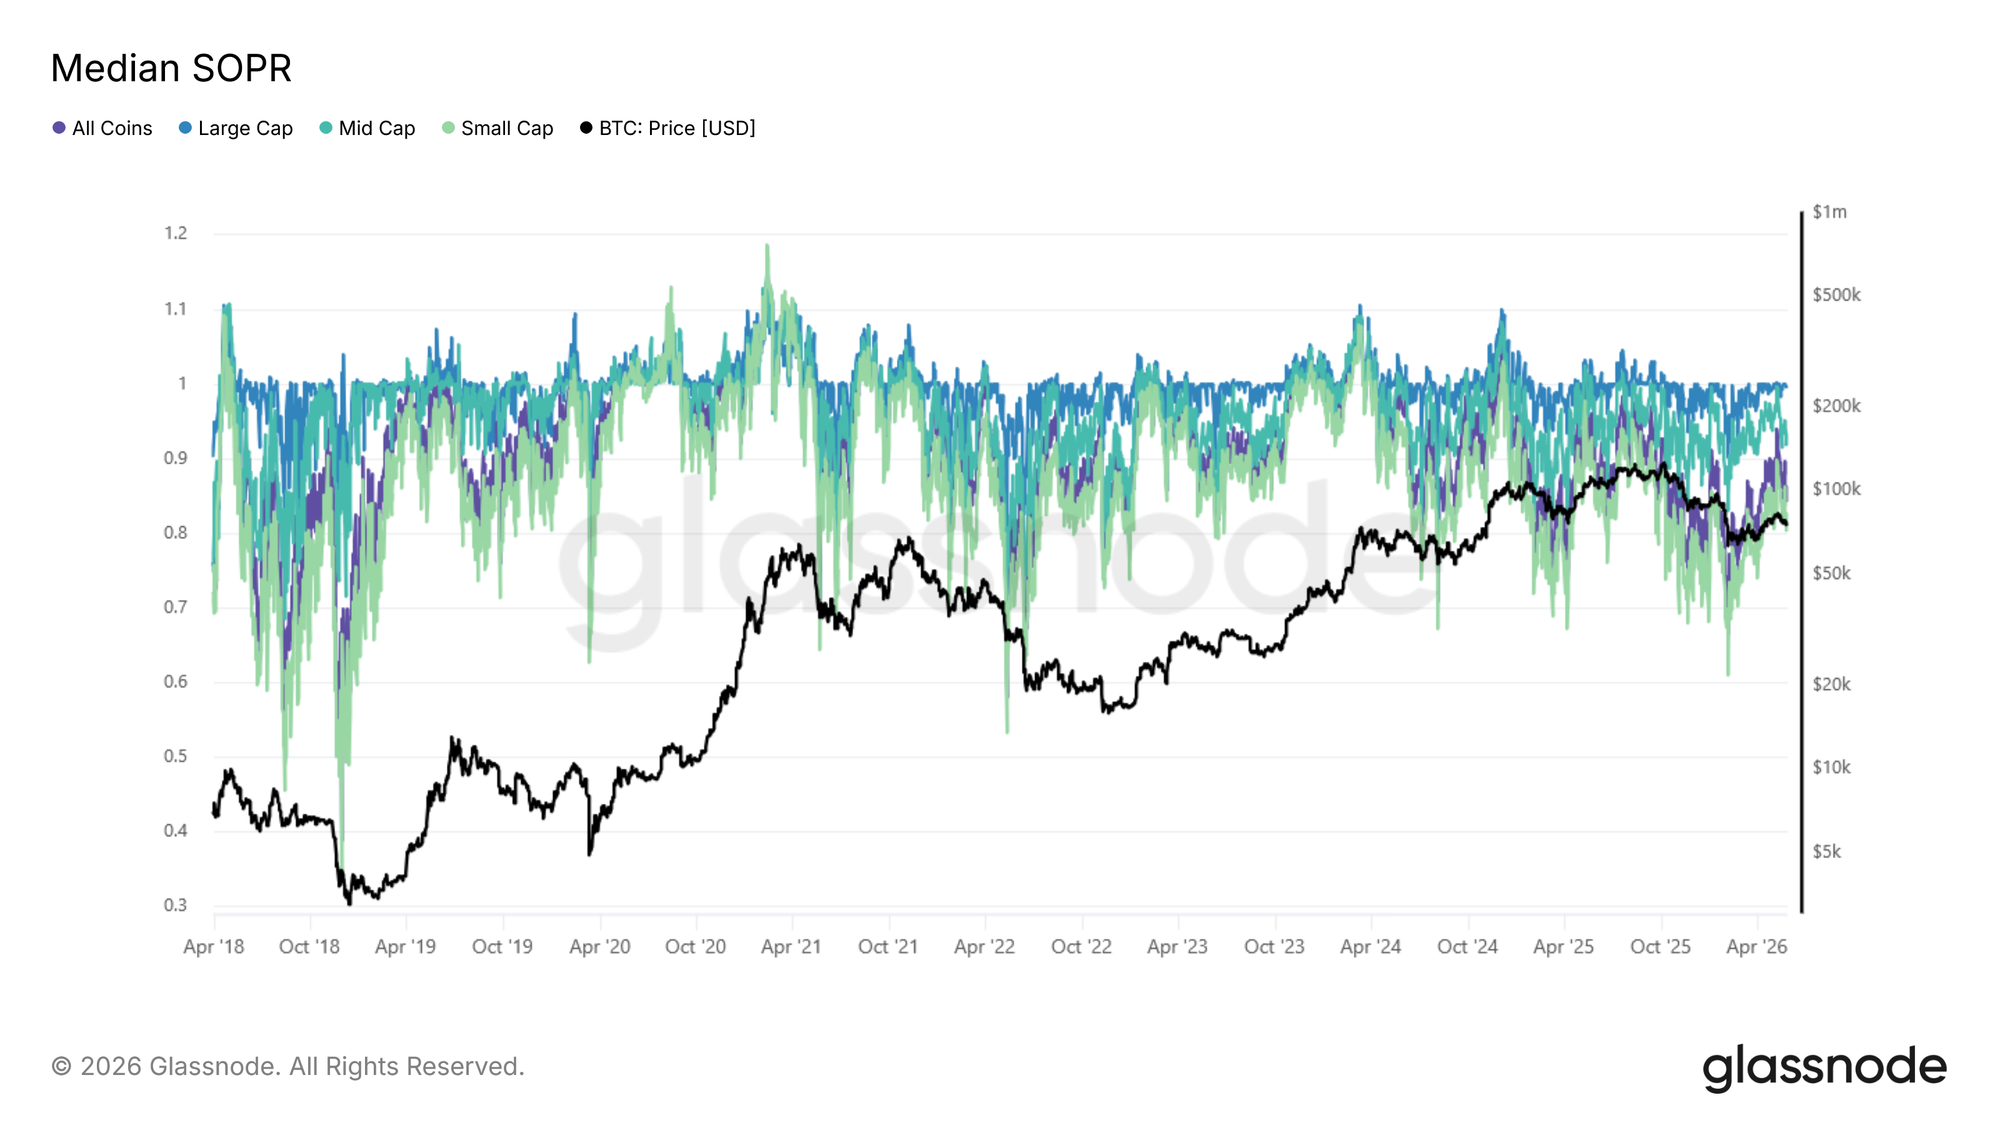
Compare to the Median SOPR: scaled index (base 100), across the same four baskets.

View Live Metric

The raw series tells the following story: small-cap SOPR crashes to levels comparable to the 2018 and 2022 bear markets, while large and mid caps have held up better in recent cycles. The index adds an additional nuance: because appreciated small-cap coins keep leaving the basket as they grow into higher tiers, the raw series overstates how bad sentiment is for the assets that actually remain.

Adjusted for this, small-cap sentiment is more stable than it appears. For large and mid caps no such correction applies, and what the index reveals is a genuine long-term trend: each cycle, the average holder in established assets extracts slightly less profit than the one before. As more supply locks into long-term holding, less of it cycles through at a profit.

Rather than relying on selected tokens as proxies for altcoin sentiment, the global SOPR index provides a cohort-level read directly. No need to cherry-pick individual tokens.

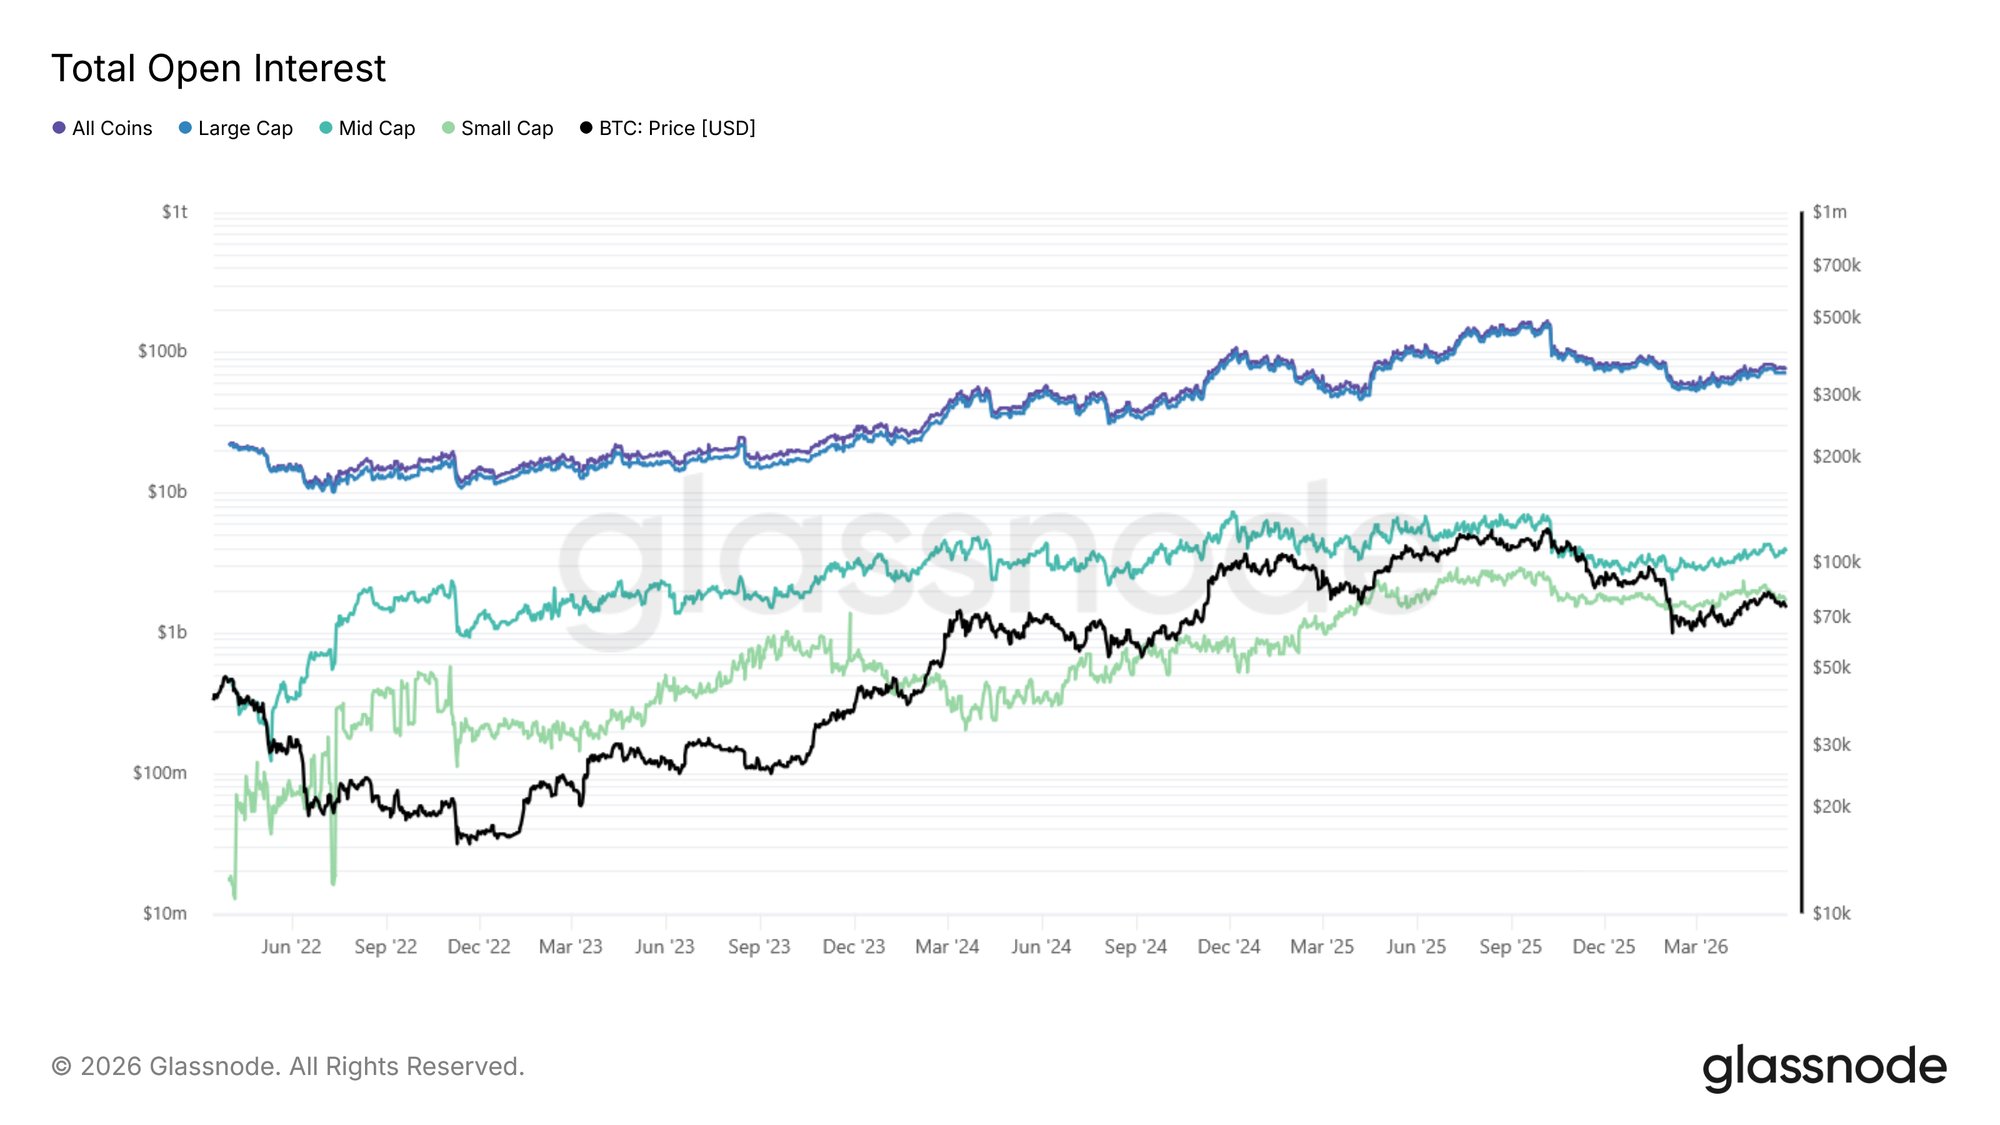
Derivatives Positioning: Open Interest

Open Interest (OI) measures the total value of outstanding perpetual futures contracts and provides a useful proxy for leverage concentration across the market.

The below figure presents Total Open Interest: Raw aggregate (USD, log scale) across all four baskets, data from 2022.

View Live Metric

Compare to the Total Open Interest Index: scaled (base 100) across the same four baskets.

View Live Metric

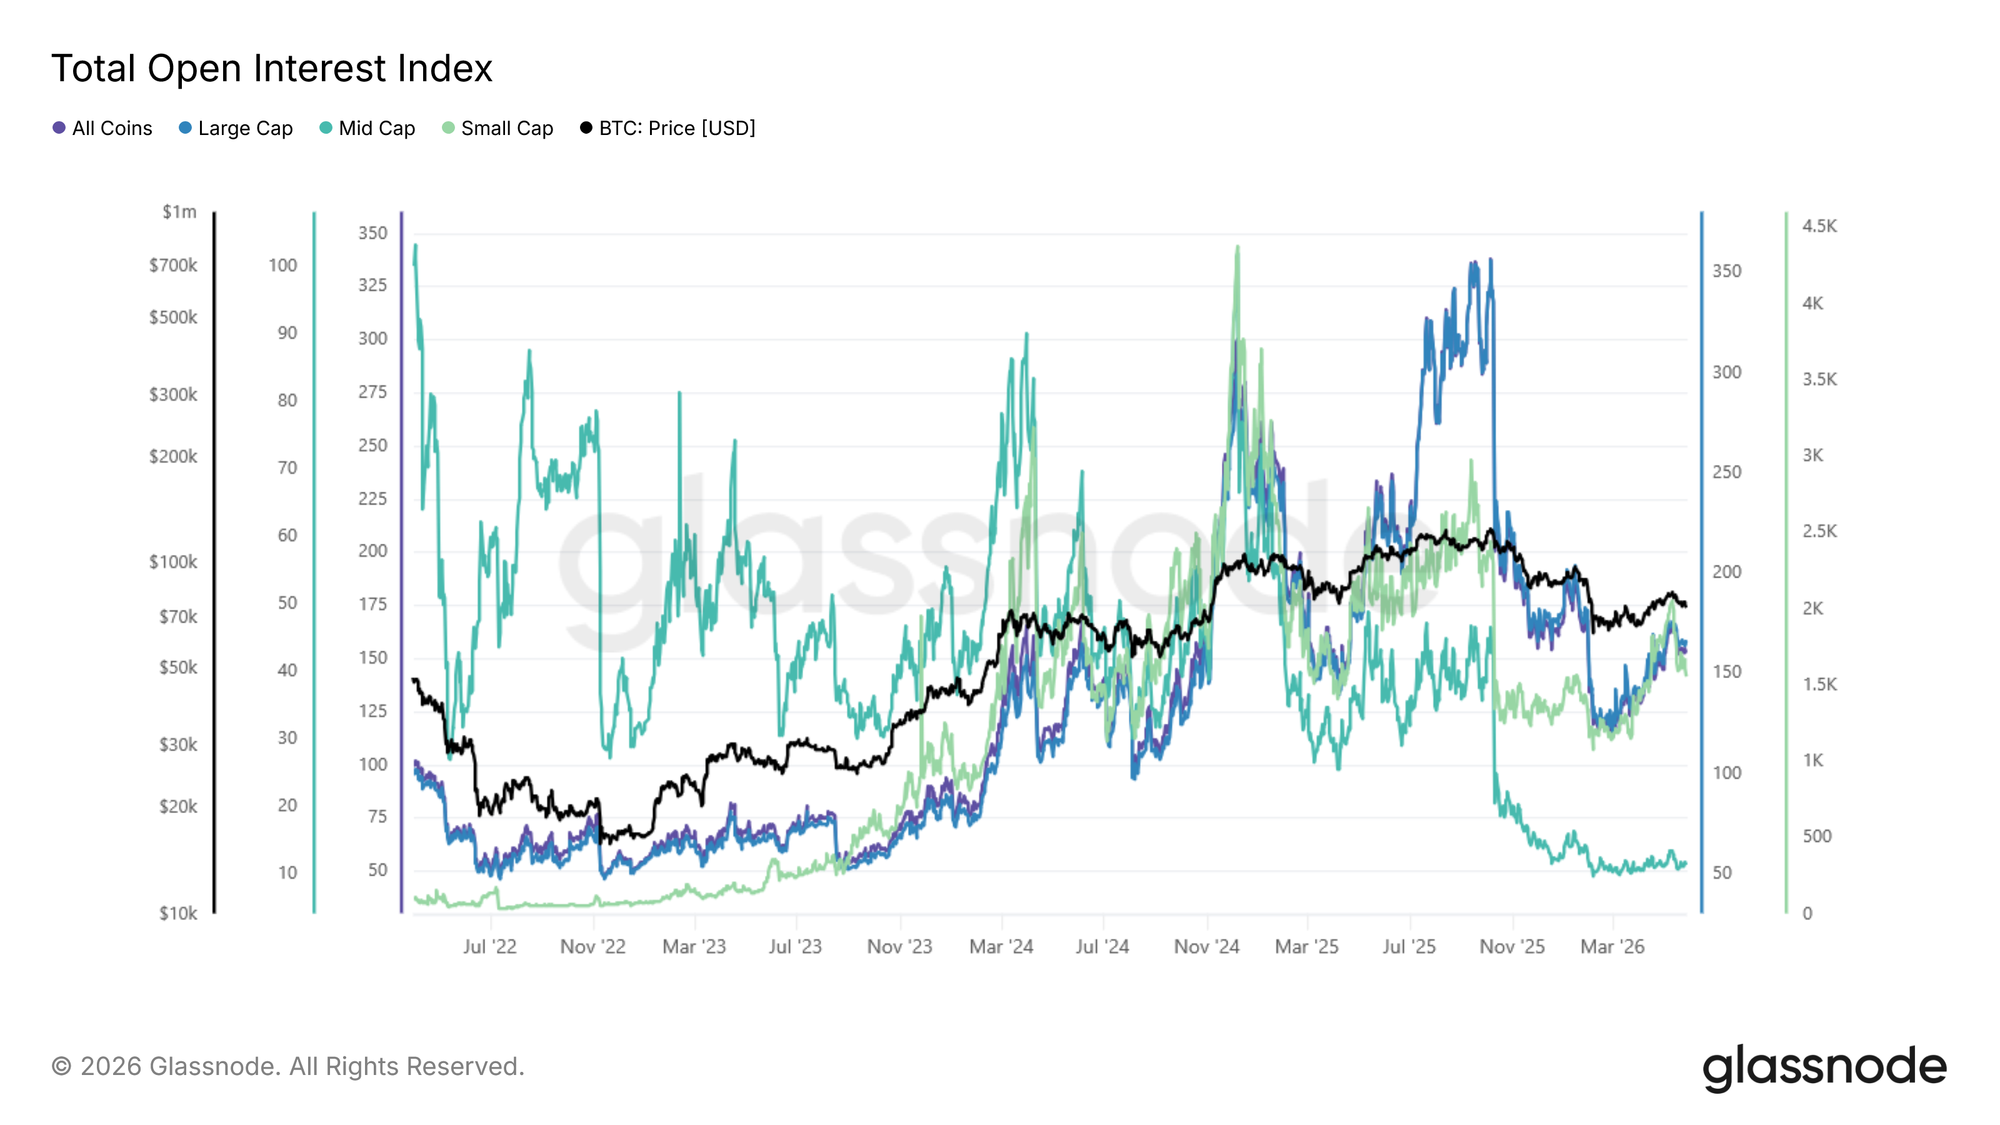
Large cap dominates open interest in absolute terms; most leverage sits on the biggest, most liquid assets. The index, however, makes the behavior of the smaller tiers comparable: mid- and small-cap open interest is far more volatile, spiking sharply during speculative episodes and unwinding just as fast. These spikes are a useful early-warning signal for cascade risk in the more fragile parts of the market.

The continuity-adjusted framework makes these shifts easier to isolate by separating changes in leverage behavior from changes in cohort composition.

The Glassnode Global Metric Suite

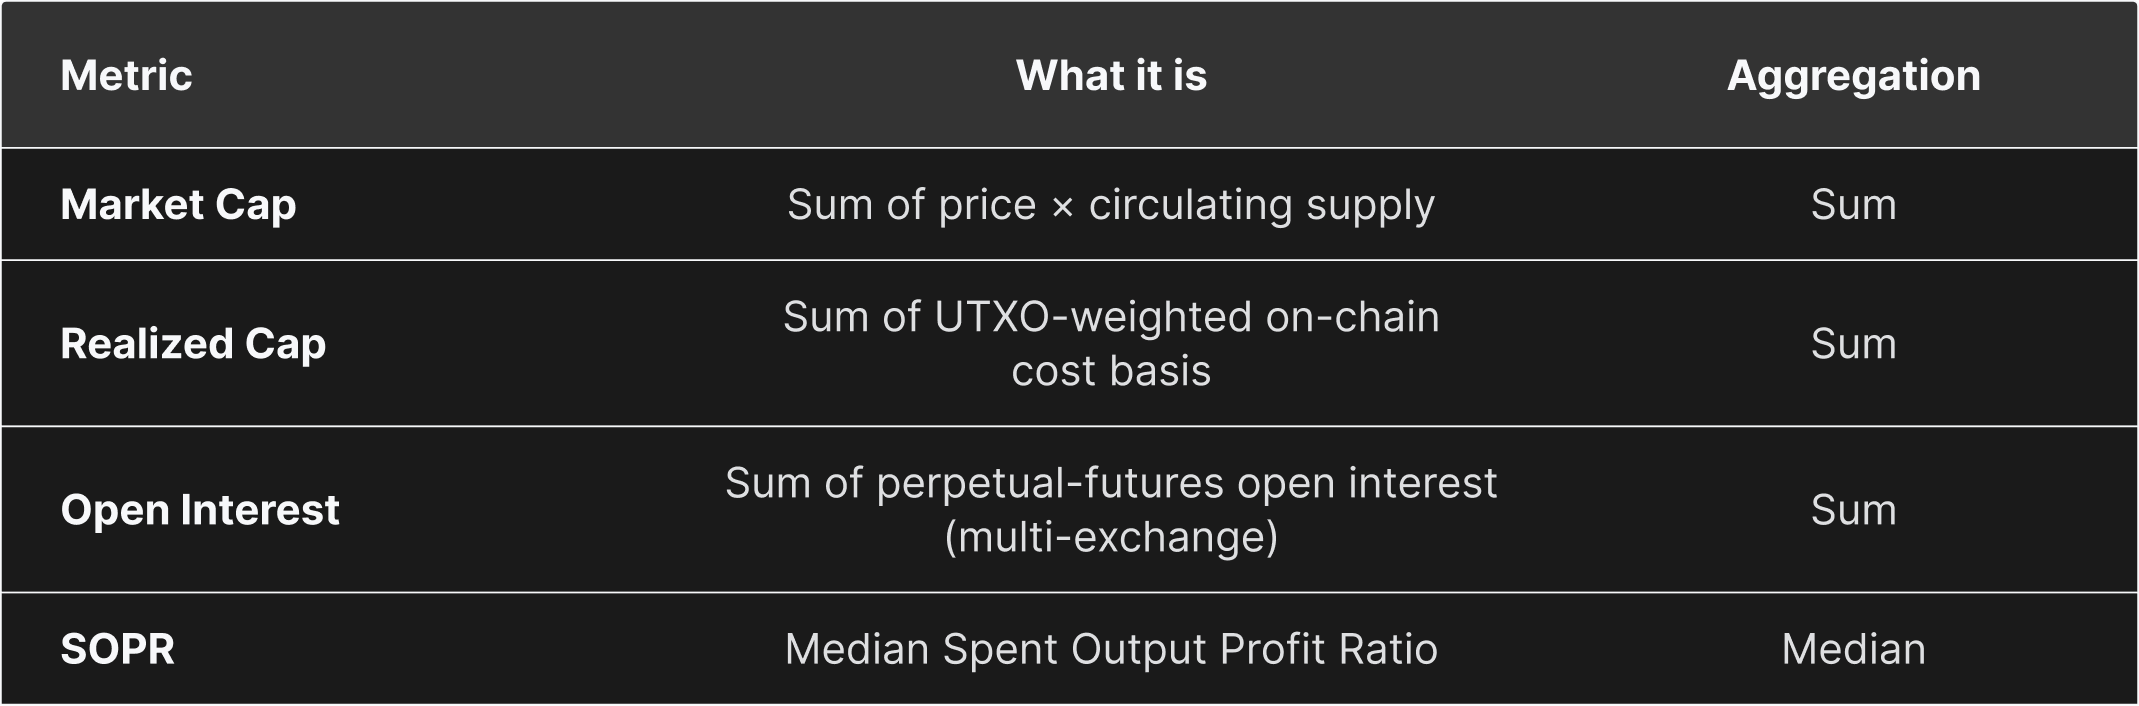
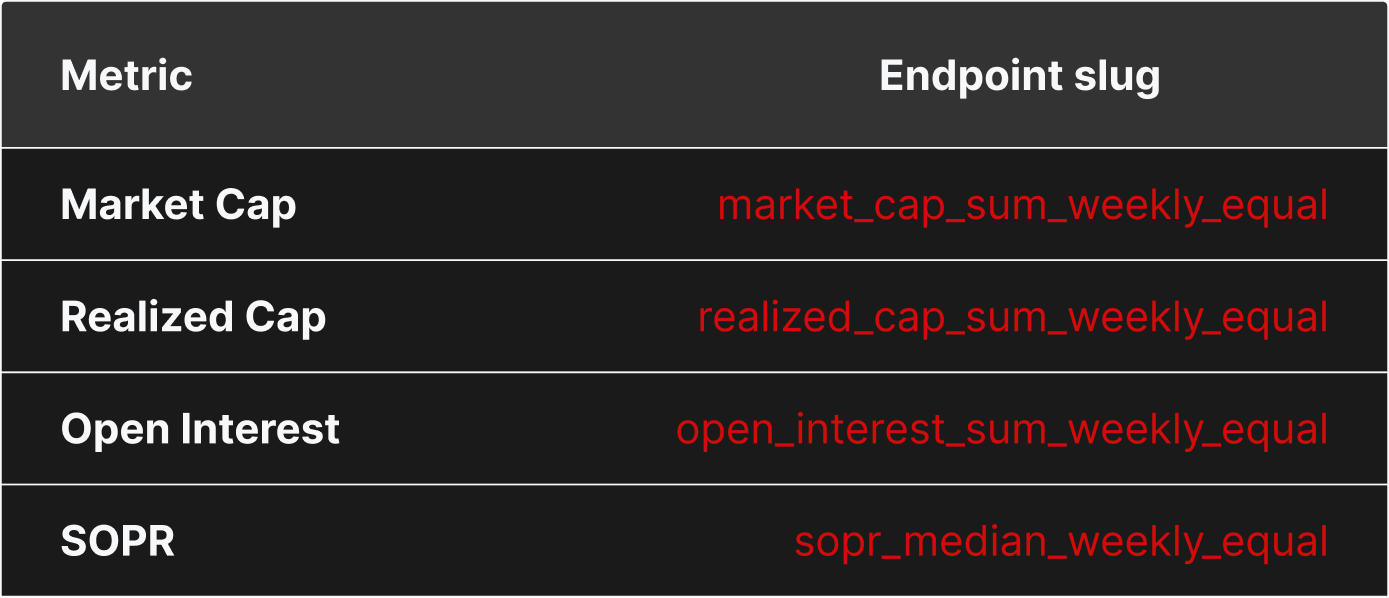
Four metrics are live with this release, each computed for all four baskets, sixteen time series in total. All use weekly rebalancing and equal weighting.

The baskets are the market-cap tiers used throughout this paper:

  • All Coins (no filter)
  • Large Cap (≥$1B)
  • Mid Cap ($100M–$1B)
  • Small Cap (<$100M).

Eligibility filtering, start dates, and the choice of sum versus median aggregation are covered in the appendix.

Accessing the Data via API

Each metric is published in two forms. 1) The raw aggregate preserves the original units (discontinuous at rebalances) and is intended to use for absolute sizing and point-in-time snapshots. 2) The index is scaled, base-100, and continuous, making it more suitable for trend analysis and cross-basket comparison.

Raw and index versions are served from separate endpoints, and each endpoint returns all baskets for that metric:

https://api.glassnode.com/v1/metrics/global/{metric}_{aggregation}_{rebalancing}_{weighting}_raw
https://api.glassnode.com/v1/metrics/global/{metric}_{aggregation}_{rebalancing}_{weighting}_index

For full request details, please see the Glassnode API documentation. The framework is extensible (additional metrics, alternative weightings, and tag-based sector baskets are planned), but the four metrics above are live today, and they already bring the continuity discipline of traditional price indices to on-chain and market data for a market that is increasingly multi-asset.

Methodology

Full details on basket selection, eligibility filtering, scaling-factor formulas, and index normalization, please reach out to your account manager for access.


  • Follow us on X for timely market updates and analysis
  • Join our Telegram channel for regular market insights
  • For on-chain metrics, dashboards, and alerts, visit Glassnode Studio

Disclaimer: This report is for informational and educational purposes only. The analysis represents a limited case study with significant constraints and should not be interpreted as investment advice or definitive trading signals. Past performance patterns do not guarantee future results. Always conduct thorough due diligence and consider multiple factors before making investment decisions.

Related Questions

QWhat is the core challenge that Glassnode Global Metrics aim to solve in crypto analytics?

AGlassnode Global Metrics aim to solve the fundamental challenge of tracking on-chain and market metrics across a highly dynamic group of assets over time without artificial discontinuities caused by basket composition changes. This is in contrast to indices that focus solely on price.

QExplain the key difference between the 'Raw Aggregates' and 'Indices' provided by Glassnode Global Metrics.

AThe 'Raw Aggregates' provide true values in original units (e.g., USD for market cap), preserving economic meaning but potentially containing structural discontinuities. The 'Indices' are scaling-factor-adjusted, base-normalized (to 100) time series designed for continuous trend analysis and cross-basket comparison, as they neutralize the effect of assets entering or leaving the basket.

QUsing the 2024 small-cap market cap example from the article, why does the raw aggregate series fail to capture a genuine small-cap rally, and how does the index correct for this?

AThe raw small-cap market cap series suffers from a 'winners leave' structural bias. When a small-cap asset appreciates and crosses the $100M threshold, it leaves the small-cap basket, taking its gains with it. Therefore, the raw aggregate cannot capture sustained gains. The index corrects for this by applying a continuity adjustment that neutralizes the effect of composition changes, allowing the true performance of the small-cap tier to be visible.

QAccording to the analysis of the Median SOPR (Spent Output Profit Ratio) index, what long-term trend does it reveal for large and mid-cap assets?

AThe analysis of the Median SOPR index reveals a genuine long-term trend for large and mid-cap assets: in each market cycle, the average holder in these established assets extracts slightly less profit than in the cycle before. This is attributed to more supply being locked into long-term holding, resulting in less of it cycling through at a profit.

QHow does the Global Open Interest index help identify risk, particularly for smaller market cap tiers?

AThe Global Open Interest index helps identify risk by making the *behavior* of different market cap tiers comparable. It shows that open interest for mid- and small-cap assets is far more volatile than for large caps, spiking sharply during speculative episodes and unwinding rapidly. These spikes serve as an early-warning signal for cascade risk in the more fragile, less liquid parts of the market.

Related Reads

SpaceX, OpenAI, Anthropic: The Three AI Giants Racing for IPO, Which One Is Worth Betting On?

SpaceX, OpenAI, and Anthropic are poised for historic IPOs within weeks, potentially raising a combined $180 billion—a sum exceeding the entire internet bubble's fundraising. The hosts of the Limitless Podcast argue this isn't just individual company financing but an unprecedented capital concentration for AI infrastructure, driven by an insatiable need for compute, data centers, power, and chips. SpaceX's IPO is notable for reportedly changing market index rules to allow faster inclusion, potentially funneling trillions in passive retirement funds into its stock, despite its unproven space-based data center business model. In contrast, Anthropic demonstrates explosive growth, with ARR reportedly hitting $45 billion and approaching profitability, fueled by strong enterprise adoption of products like Claude Code. Google's separate $80 billion raise highlights the immense capital pressure, even for giants. The discussion acknowledges bubble risks but leans optimistic. The hosts contend the massive spending is building essential physical infrastructure for the next technological era. A key bottleneck isn't capital but the real-world limits of chip manufacturing and construction speed. As long as demand for AI compute outstrips supply, this investment cycle represents a foundational build-out rather than a purely financial bubble. All three companies are seen as foundational bets on the future, with Anthropic often cited as the most immediately compelling due to its proven revenue trajectory.

marsbit1h ago

SpaceX, OpenAI, Anthropic: The Three AI Giants Racing for IPO, Which One Is Worth Betting On?

marsbit1h ago

From 'Old Guys' to 'New Favorites': How AI Is Revaluing Old Infrastructure from Dell to Nokia?

From "Vintage Tech" to "New AI Darlings": How AI Revalues Old Infrastructure One year ago, tech giants like Dell, Nokia, Cisco, and Western Data were seen as slow-growth, low-valuation stories, far from the AI spotlight dominated by players like Nvidia. Now, these legacy tech stocks are gaining market attention, sparking debate on whether this is genuine industry revaluation or a temporary narrative. As AI moves from model parameters to real-world data centers, the market is recognizing companies with proven delivery and infrastructure capabilities. This shift marks a change in the AI investment thesis: from pure model and GPU focus to the complex systems engineering required for deployment. Companies like Dell, HPE, and Corning are being revalued not for being "sexy" AI innovators, but for their decades of accumulated expertise in supply chains, enterprise delivery, and infrastructure—assets that have become critical in the AI buildout phase. The revaluation is unfolding across three key infrastructure lines: 1. **Servers & System Integration:** Dell and HPE are emerging as crucial system integrators or "general contractors" for AI data centers, translating GPU orders into complete, deployable server racks integrated with power, cooling, and networking. 2. **Networking & Connectivity:** AI's scale demands robust high-speed connections. Corning (fiber optics), Nokia (AI-RAN, 6G), and Cisco (data center switches) are gaining importance for enabling efficient data transfer within and between AI clusters. 3. **Storage:** Beyond high-speed memory (HBM/DRAM), the AI data explosion is driving demand for high-capacity hard drives (HDDs) from companies like Western Digital and Seagate to handle training data, logs, and cold storage cost-effectively. For this revaluation to be substantive and not just a narrative, three criteria are key: 1) Concrete AI-related order and revenue growth (e.g., Dell's AI server sales), 2) Upward revisions to company financial guidance, and 3) Sustainable improvements in profit quality, not just top-line revenue spikes. In essence, AI's transition to a real construction phase is re-pricing "old assets" against "new demand." The opportunity, however, is selective. Only those legacy firms that are demonstrably integrated into the capital expenditure chains of data center and enterprise AI deployment are likely to experience a true "logic re-rating" rather than just a temporary valuation bounce.

marsbit1h ago

From 'Old Guys' to 'New Favorites': How AI Is Revaluing Old Infrastructure from Dell to Nokia?

marsbit1h ago

The Merger of Codex and ChatGPT Marks the Beginning of a Major Reshuffle in Programming Tools

OpenAI is shifting its strategic focus from ChatGPT to Codex, merging them along with the browser tool Atlas into a unified desktop super-app. This move signals an internal belief that Codex, originally a programming tool, represents the next evolution of AI more than conversational models like ChatGPT. Over the past year, Codex's weekly active users have surged past 5 million. The key distinction is that while ChatGPT answers questions, Codex executes tasks. Enterprises increasingly value this ability to get work done over simply receiving advice. Consequently, Codex is attracting professionals beyond developers, including analysts, bankers, marketers, and product managers. OpenAI's reorganization and increased investment in Codex stem from recognizing that the future of AI competition lies in execution capabilities, not just conversation. The company is launching role-specific plugins (e.g., for data analysis, sales, design) to transform Codex into a broad knowledge work platform that automates and redefines white-collar workflows. Beyond being a tool, Codex reflects OpenAI's ambition to redefine software. New features like "Sites"—which generates interactive websites from documents—and collaborative "Annotations" aim to create a paradigm where the AI understands the goal and handles the tools and steps, functioning more like a digital colleague than traditional software. The ultimate goal is a unified experience where the user cares only about the completed task.

marsbit1h ago

The Merger of Codex and ChatGPT Marks the Beginning of a Major Reshuffle in Programming Tools

marsbit1h ago

Interpreting Investment Opportunities in the Age of Great Navigation, Invesco Great Wall Fund Releases '2026 Report on Chinese Enterprises Going Global'

Invesco Great Wall Fund has released its "2026 China Corporate Globalization Report," titled "The 'Great Navigation Era' of Chinese Enterprises." The report analyzes the new trends and investment opportunities as Chinese companies expand globally, moving from simple product exports to comprehensive overseas operations involving services, branding, and local production. Driven by factors like trade friction, the pursuit of higher profit margins abroad, and policy support, globalization is becoming essential for Chinese companies. The report outlines an evolution: from early product export ("Globalization 1.0") to the current "Globalization 2.0," characterized by overseas capacity, capital goods investment, consumer brand expansion, and service exports. Chinese firms' competitive advantages are highlighted, including a vast engineer talent pool, low-cost and robust infrastructure, and complete industrial clusters. Specific sectors with significant出海 potential are identified: * **Capital Goods** (e.g., engineering machinery, power equipment): Benefiting from global demand, especially in Belt & Road markets and the AI-driven power grid upgrade cycle. * **Consumer Brands**: Transitioning from cost to brand advantage, leveraging供应链 efficiency. * **Technology & Innovation**: Including AI applications, optical modules within global tech supply chains, and new energy vehicles focusing on local production. * **Pharmaceuticals**: Chinese biotech firms are becoming preferred partners for global pharma, with potential for breakthrough drugs in areas like oncology and weight loss. The report concludes that corporate globalization represents a sustained, core theme for China's capital markets, though companies must navigate challenges like geopolitics and localization.

marsbit1h ago

Interpreting Investment Opportunities in the Age of Great Navigation, Invesco Great Wall Fund Releases '2026 Report on Chinese Enterprises Going Global'

marsbit1h ago

Trading

Spot
Futures
活动图片