After 6 Quarters of Calling for Rate Cuts, Rate Expectations Are Instead Moving Upwards

marsbitPublished on 2026-03-19Last updated on 2026-03-19

Abstract

In September 2024, the Federal Reserve began its rate-cutting cycle, projecting a median federal funds rate of 3.4% by the end of 2025—implying four additional cuts. However, six quarters later, the March SEP (Summary of Economic Projections) reveals a significant shift: the rate now stands at 3.50%-3.75%, 25 basis points higher than initially expected. The median projection for 2026 has also risen from 2.9% to 3.4%. The Fed’s internal consensus has fractured. Out of 19 FOMC participants, seven now expect no rate cuts in 2026, while seven anticipate only one cut. This 7:7 split reflects a fundamental disagreement over the direction of monetary policy, moving from debates over the magnitude of cuts to whether cuts should occur at all. Persistent inflation is the core issue. The Fed has consistently revised its PCE inflation forecasts upward over the past six quarters, with the 2026 projection now at 2.7%—up 0.6 percentage points from initial estimates. Core PCE, a key indicator of underlying inflation, was revised up sharply to 2.7%, signaling entrenched price pressures. Despite slightly raising its GDP growth forecast to 2.4% and holding unemployment steady at 4.4%, the Fed’s unchanged median rate projection conflicts with its own rising inflation outlook. Market expectations remain more dovish, pricing in around 50 basis points of cuts, but the Fed’s internal division and consistent underestimation of inflation suggest continued uncertainty. The central bank is effectivel...

In September 2024, the Federal Reserve officially initiated interest rate cuts. The median dot plot at the time drew a clear line: down to 3.4% by the end of 2025, implying 4 more cuts.

Six quarters have passed. Last night's March SEP tells us this line has completely distorted.

The Fed kept rates unchanged at 3.50%-3.75%, which was no surprise to the market. But what happened inside the dot plot is more worthy of dissection than the rate decision itself. Among the 19 members, 7 believed there should be no rate cuts this year, and 7 believed there should be one cut. A perfect split. The median didn't change, but the consensus has collapsed.

Using the three charts below, we briefly examine how the Fed has been chasing reality to revise its expectations step by step, the extent of its internal divisions, and why its inflation forecasts are likely underestimated again.

The Collapse of Rate Cut Expectations

According to the Fed's official SEP data, when the rate cuts started in September 2024, the median dot plot projection for the end of 2025 was 3.4%, implying 4 more cuts from the then level of 4.75%-5.00%.

Three months later, in the December SEP, this number jumped to 3.9%. Only 2 cuts remained. After that, through four SEP updates in March, June, September, and December of 2025, the year-end projection for 2025 never returned to 3.4%. The actual year-end rate for 2025 landed in the 3.50%-3.75% range, a full 25 basis points higher than expected when the cuts began.

The projection for 2026 followed the same path. In September 2024, the Fed expected rates to fall to 2.9% by the end of 2026. By last night's March SEP, this number stabilized at 3.4%, 50 basis points higher than the initial expectation.

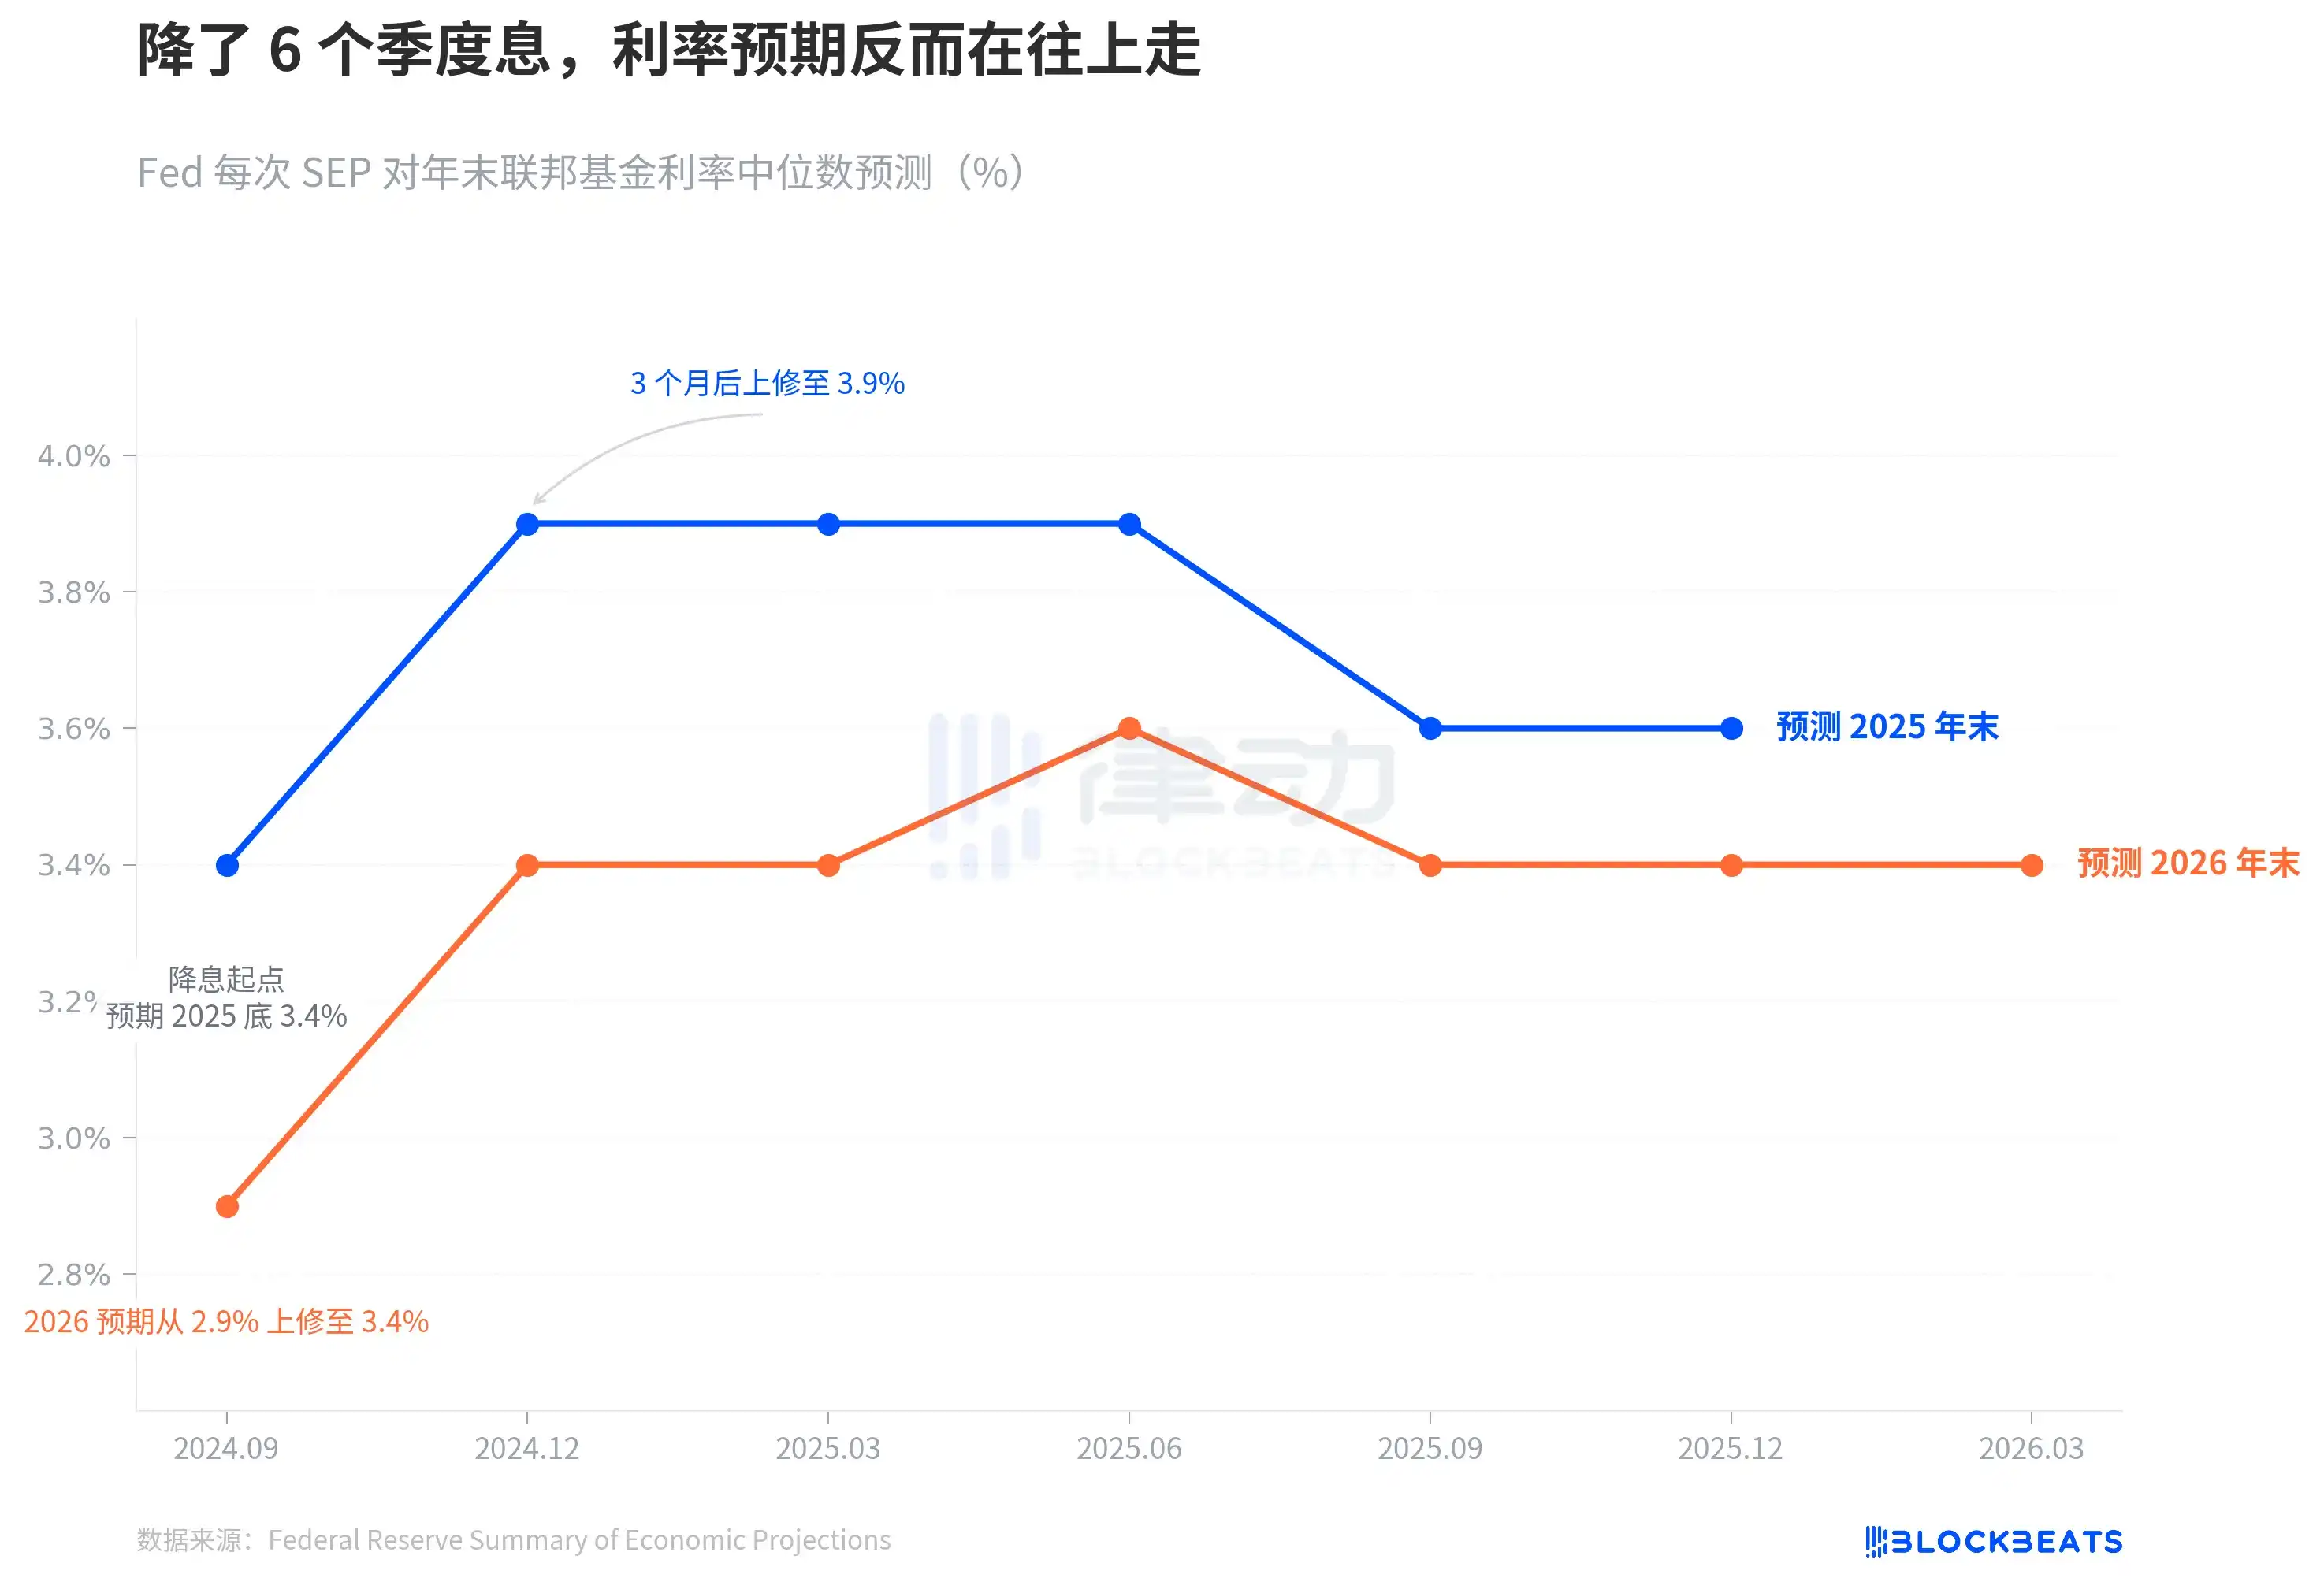
The trends of the blue and orange lines tell the same story: the rate-cutting cycle did indeed start, but the Fed's own judgment on the terminal rate has been continuously shifting upwards.

This drift speed is even more evident when viewed in a longer time frame. In September 2024, the Fed had just cut rates from the peak of 5.25%-5.50% to 4.75%-5.00%. Market confidence in the rate cut path was strong at the time. CME FedWatch once gave a high implied probability of 4-5 cuts in 2025. But the Fed's own forecast ran away first—in December, it directly halved the projected cuts, with the blue line jumping from 3.4% to 3.9%, a single-quarter jump of 50 basis points. No matter how the economic data fluctuated afterwards, this line never came back.

In other words, just 3 months after the rate-cutting cycle began, the dot plot was already hitting the brakes on the rate cut path.

7:7, The Fed Can't See the Direction Clearly

The median is a number that masks the division behind it.

According to the Fed's March SEP Figure 2 dot plot (compiled by BondSavvy), the distribution of votes from the 19 participants for the end-2026 rate is: 7 for no cuts, 7 for one cut, 2 for two cuts, 2 for three cuts, and 1 for four cuts.

7:7, a perfect split. 14 people are concentrated in the "maintain status quo" and "cut once" categories, with only 5 expecting more than one cut.

Compared to the December 2025 SEP, the change is dramatic. In December, 12 people still expected 2 or more cuts; by March, only 5 remained. Powell confirmed this shift at the press conference: "4 to 5 people moved from expecting 2 cuts to expecting 1 cut."

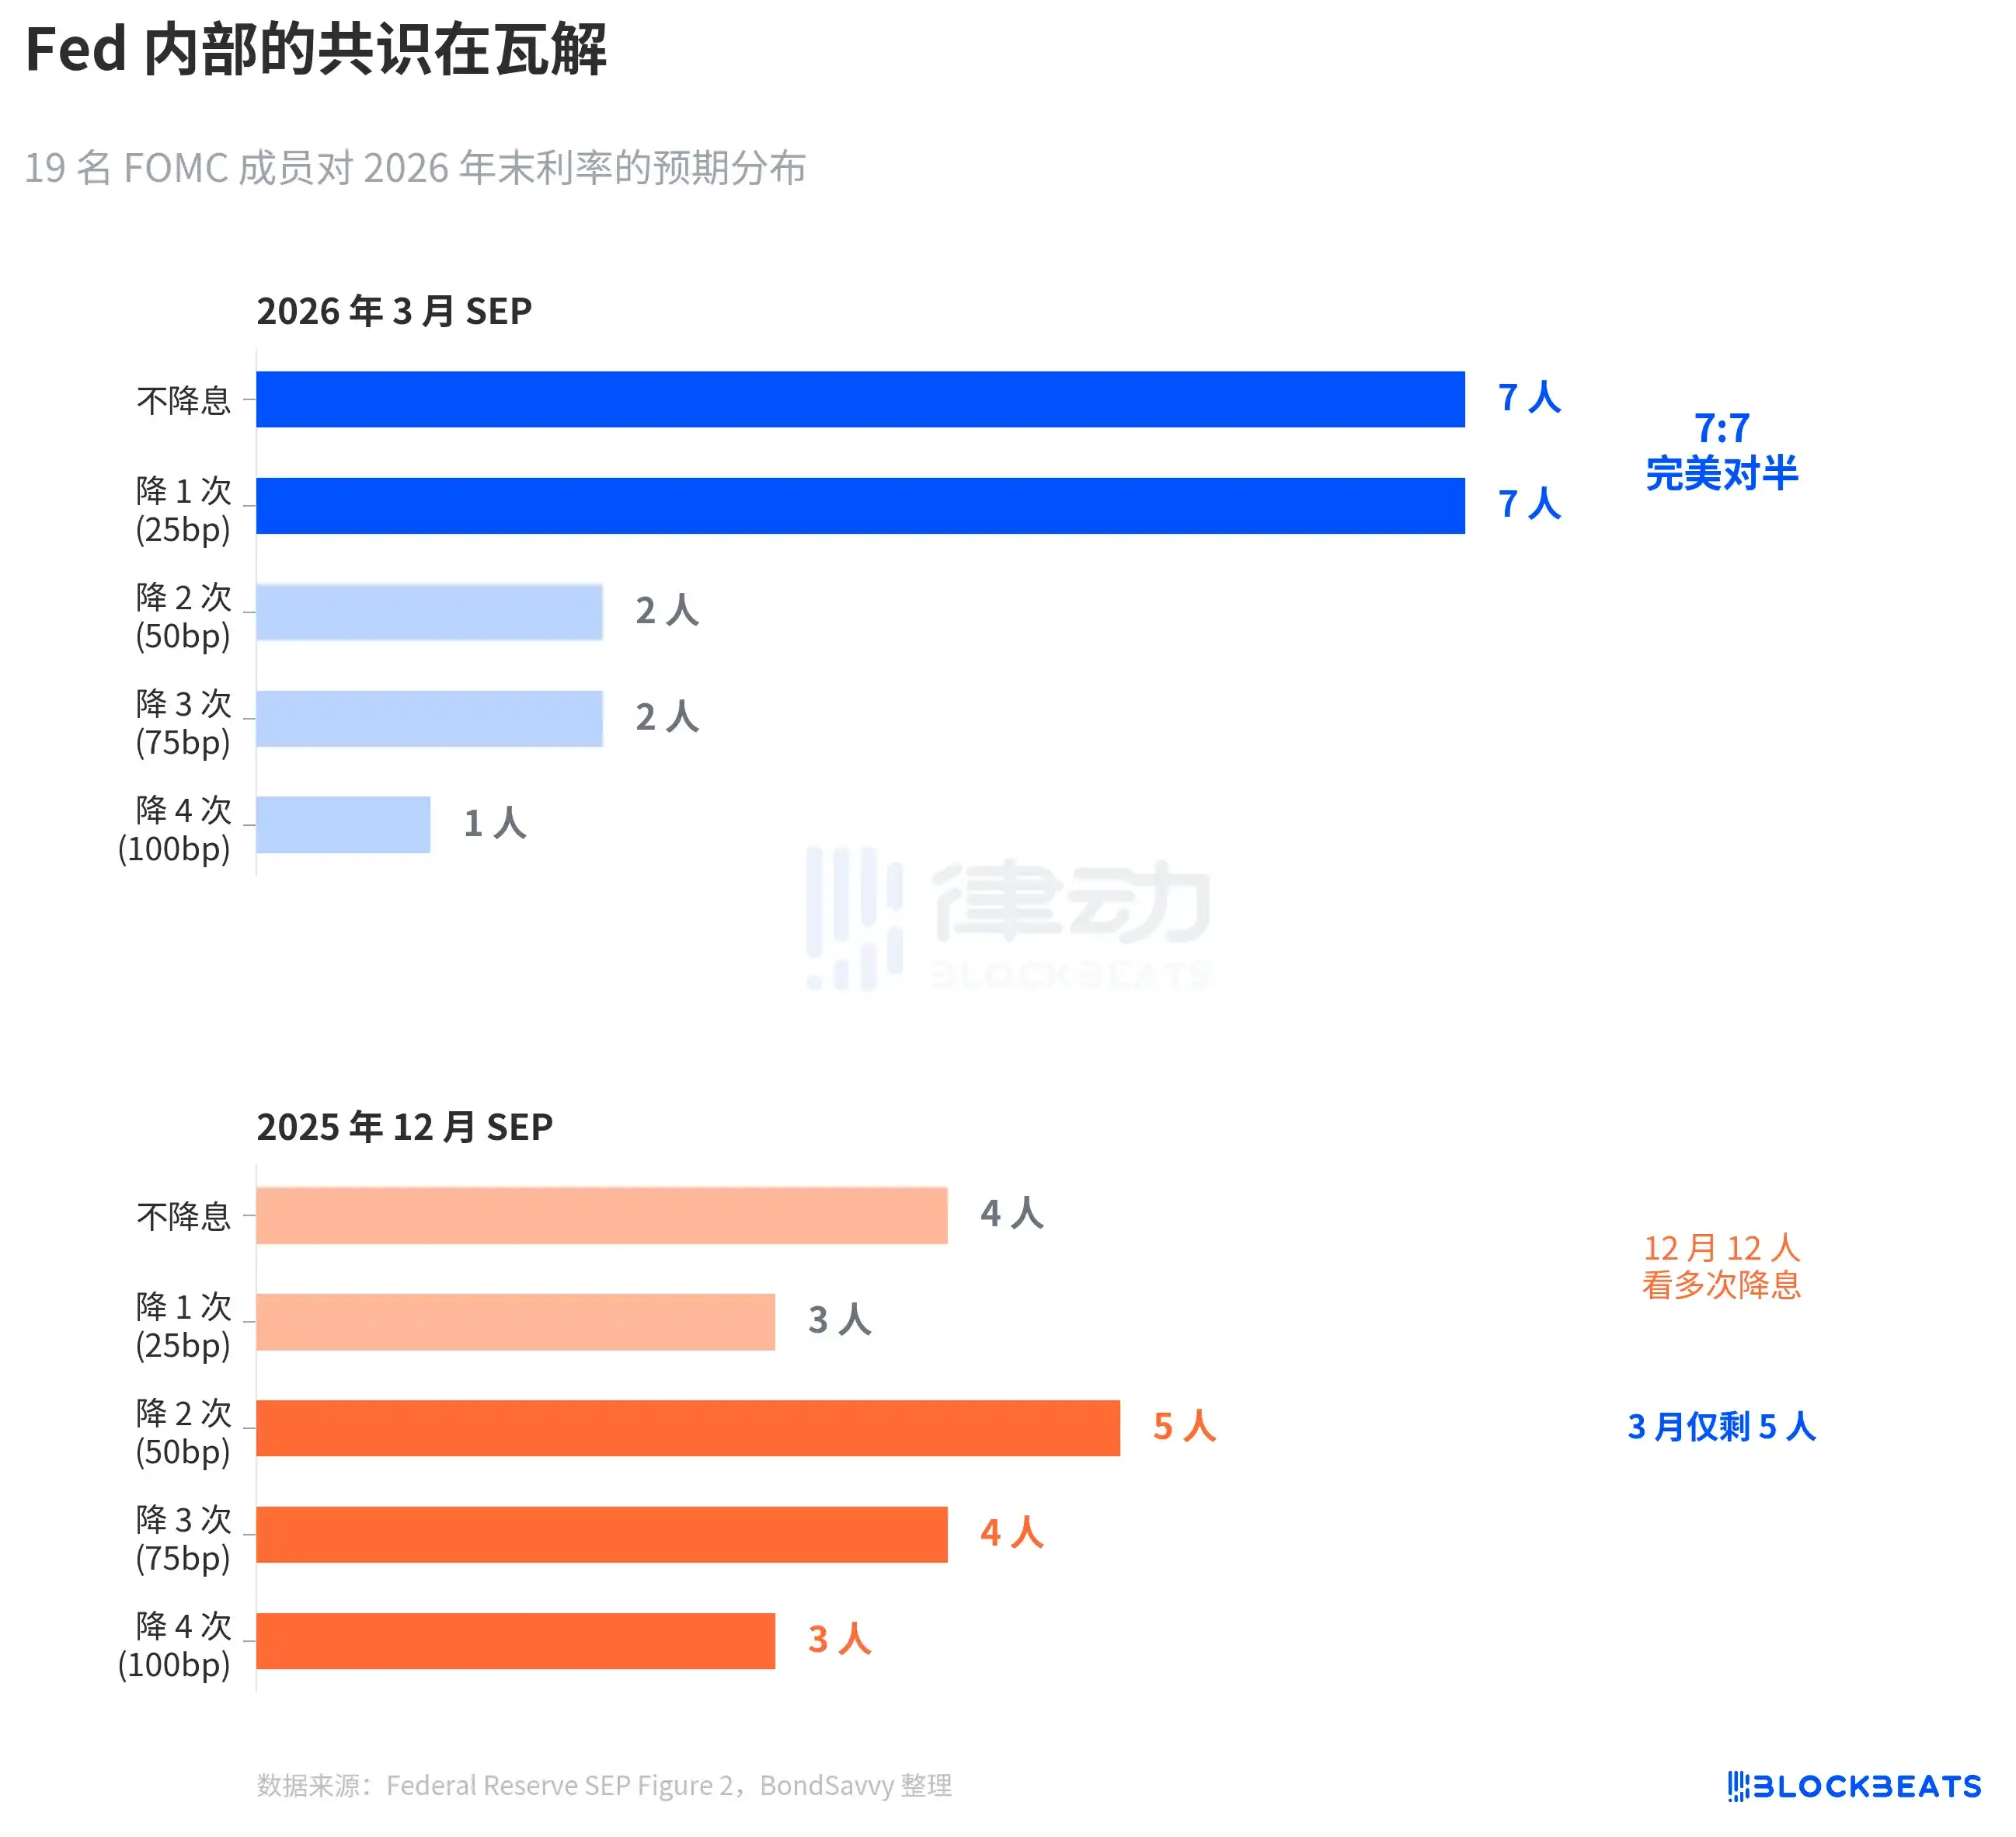
This symmetrical split is very rare in FOMC history. According to a 2023 study by the San Francisco Fed (Bundick & Smith), internal divergence in the dot plot was almost zero during the 2020 pandemic and gradually increased during the subsequent hiking cycle. But past disagreements were mainly about "magnitude"—whether to hike 25 or 50 basis points—the direction was consistent. The March 2026 disagreement is a "directional dispute": whether to cut or not.

The median remains at 3.4%, but beneath this 3.4% stand two teams pulling in opposite directions.

More notably is how the distribution narrowed. The December dot plot was widely scattered, with dots from significant cuts to standing pat. The March dot plot distribution actually narrowed—14 dots squeezed between two categories—but this isn't consensus coalescing; it's two opposing camps each solidifying. Dispersed uncertainty has turned into concentrated disagreement. This is more dangerous than dispersion because any surprise in inflation data could cause one of these teams to collectively shift, causing the median to jump.

The Fed Always Underestimates Inflation

The root of the interest rate dispute is the inflation dispute.

According to various Fed SEP data, in December 2024, the Fed first provided its 2026 PCE inflation forecast: 2.1%. It has been revised upwards every quarter since. March 2025: 2.2%, June: 2.4%, September: 2.6%. December briefly fell back to 2.4%, only to jump to 2.7% in March 2026. Six quarters, a cumulative upward revision of 0.6 percentage points.

This pattern is not new. The 2025 PCE inflation followed the exact same path. In December 2024, the Fed forecast 2025 PCE at 2.5%, subsequently revised up quarter by quarter to 2.7%, 3.0%, 3.0%, and 2.9%. According to data from the Bureau of Economic Analysis (BEA), the actual PCE year-on-year for December 2025 was 2.9%. The Fed spent a whole year catching up, only matching it in the final release.

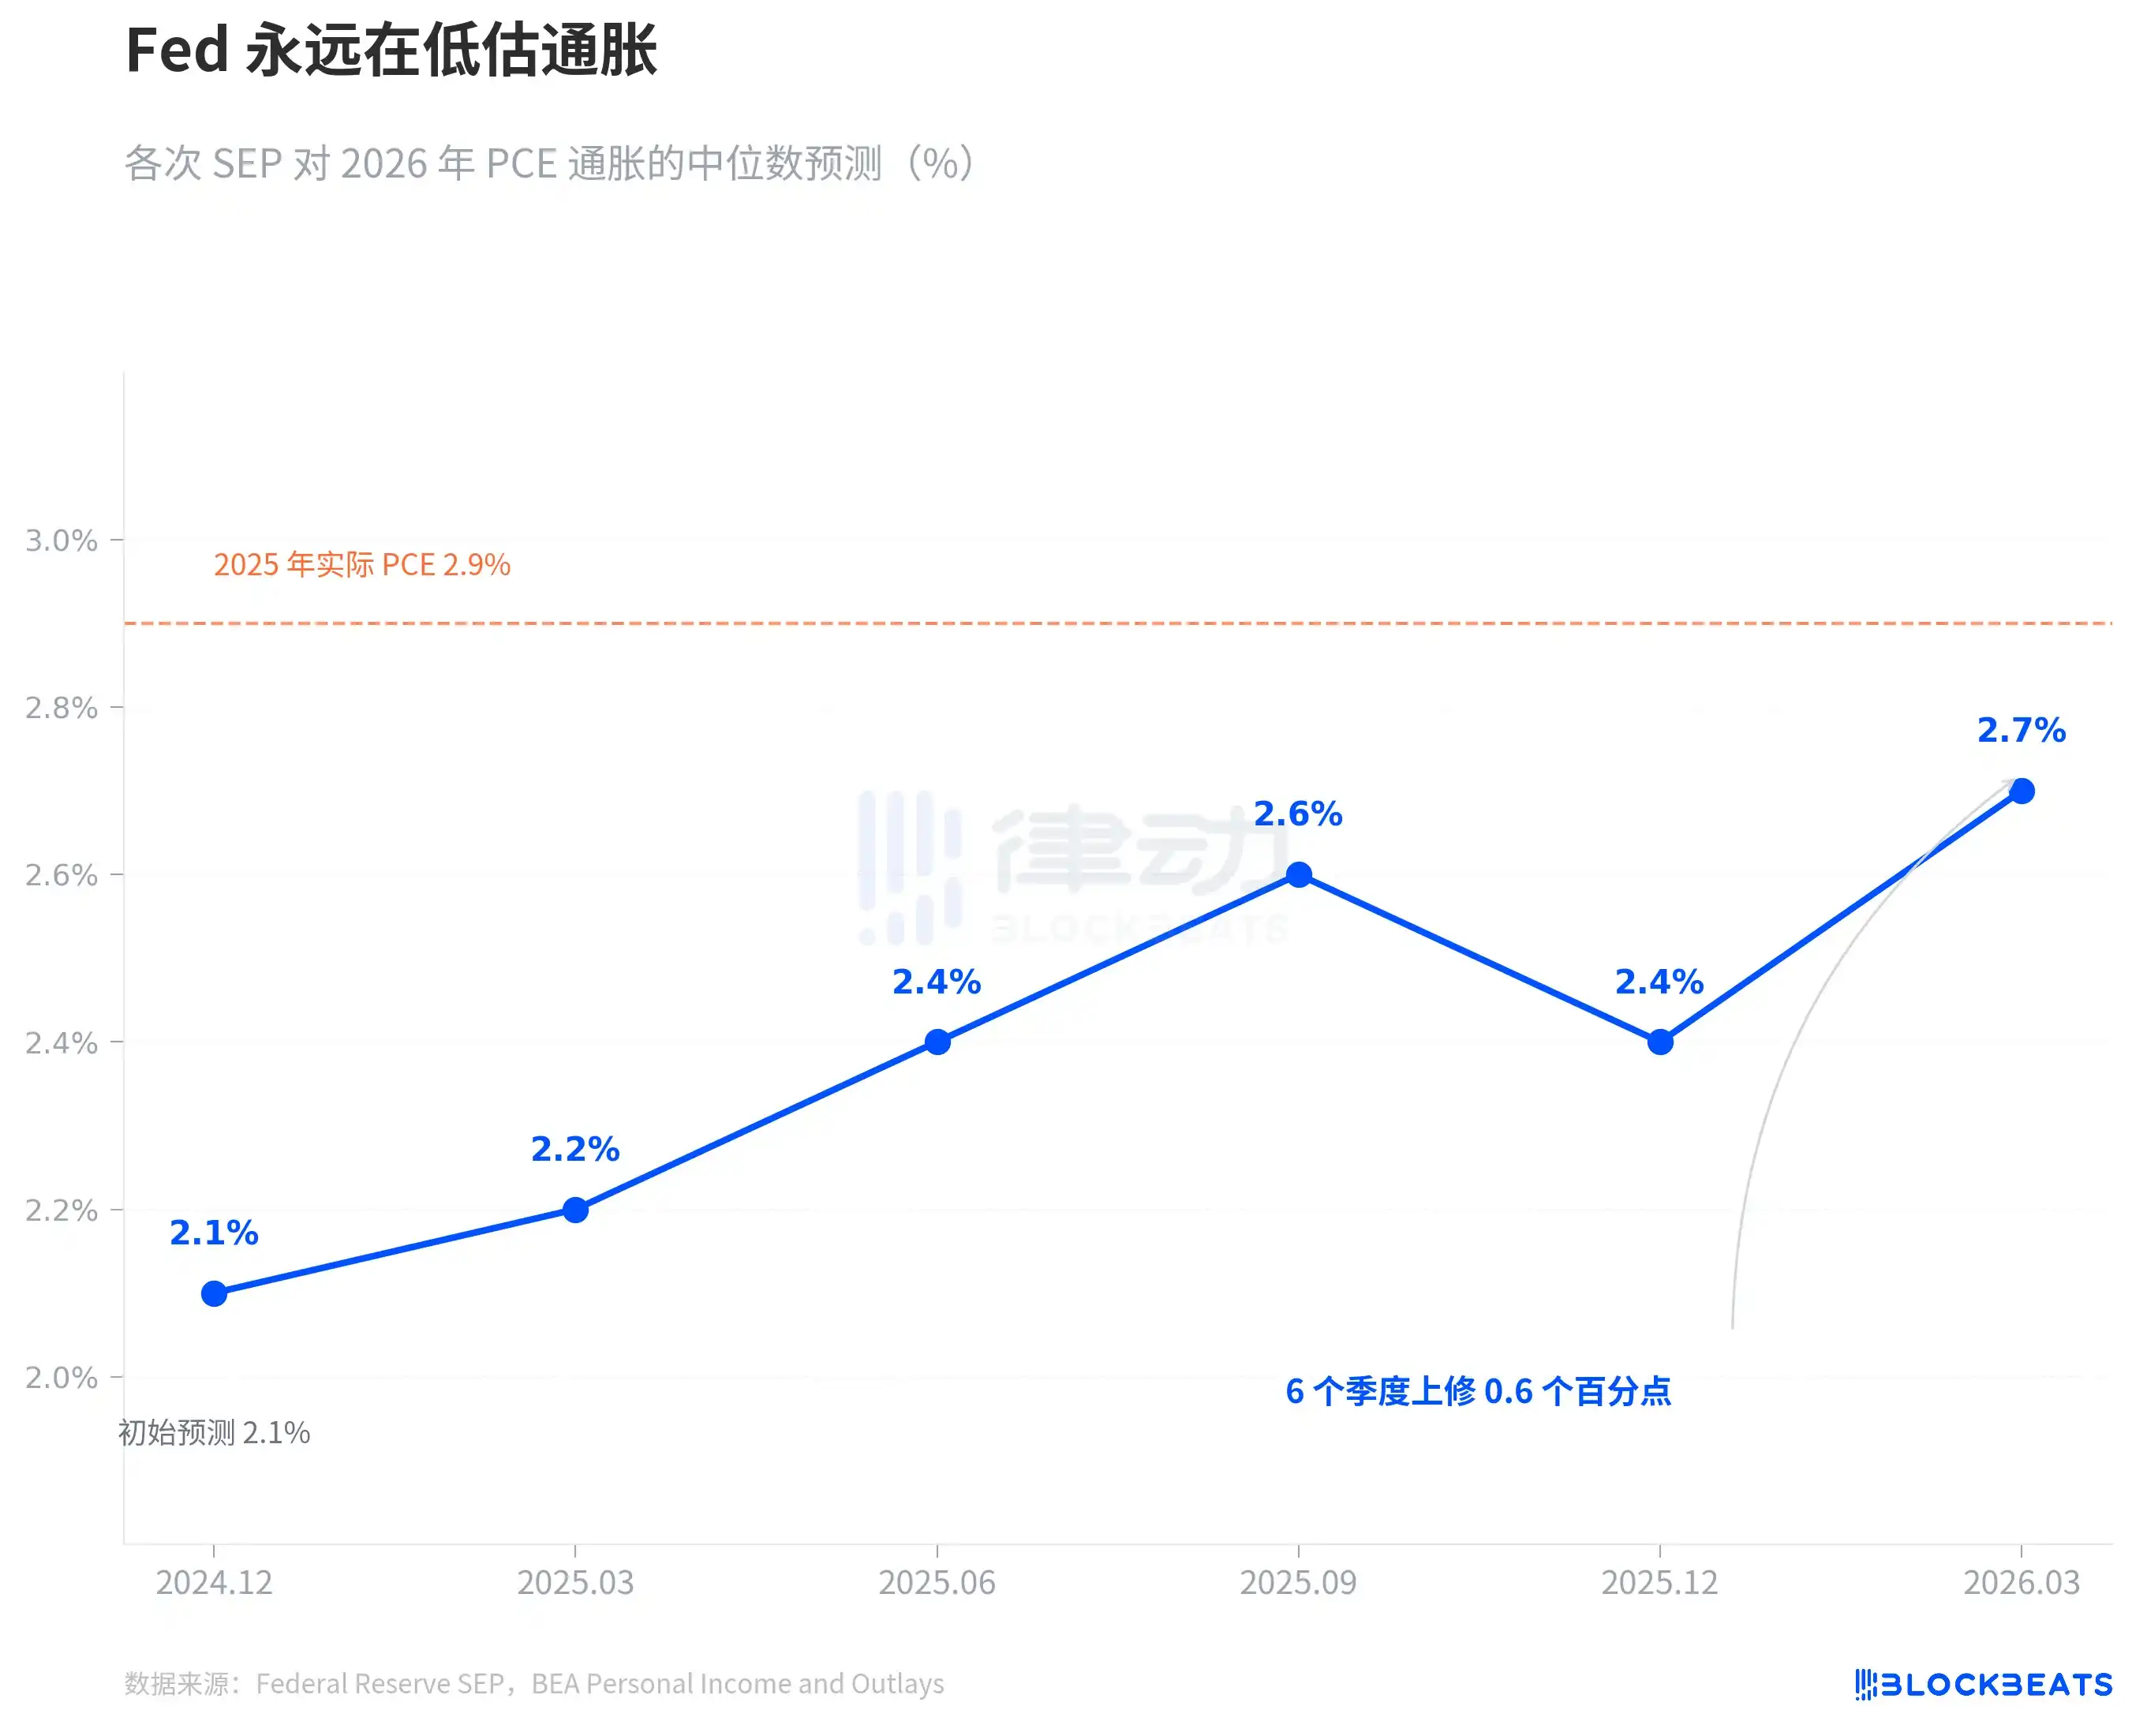
Now the Fed says the 2026 PCE is 2.7%. The orange dashed line on the chart marks the 2025 actual value of 2.9%. Based on their own track record, 2.7% is likely just the starting point, not the endpoint. It's not a conspiracy, it's a pattern. The Fed's real-time inflation forecasts over the past two years have only had one direction—chasing it higher.

Core PCE is worth looking at separately. The March SEP revised the 2026 core PCE forecast up from 2.5% in December to 2.7%, a single-quarter revision of 0.2 percentage points, the largest adjustment among all indicators. Core PCE excludes the volatility of food and energy and is considered by the Fed a more reliable gauge of underlying inflation. When the forecast for this indicator is being revised up, it suggests the issue isn't oil price volatility, but underlying inflation stickiness exceeding expectations.

In the same March SEP, the GDP forecast was slightly raised from 2.3% to 2.4%, and the unemployment rate remained unchanged at 4.4%. The economy is slightly better, inflation is more stubborn, yet the rate path remains unchanged.

There is tension between these three judgments. If inflation is more stubborn than expected, how can the rate path remain unchanged? The 7:7 split provides the answer—it's not that the Fed thinks rates don't need to change, it's that the Fed's internal judgment on the inflation path itself is split.

According to CME FedWatch data, the market's current pricing for all of 2026 is: 32.5% probability of a 50 basis point cut (2 cuts), 25.9% probability of a 75 basis point cut (3 cuts), 21.1% probability of only 1 cut. The market's weighted expectation is about 50 basis points, more dovish than the Fed's median of 25 basis points. But the divergence between the highest probability scenario and the Fed's median恰好映射了 exactly mirrors the Fed's internal 7:7 split.

No one knows the answer. Including the Fed itself.

Related Reads

M&A Deals in the Crypto Market Are Unusually Active

Title: M&A Activity in Crypto Market Becomes Unusually Active A rare signal is emerging in the crypto primary market: mergers and acquisitions (M&A) are nearing half of all financing deals. According to RootData, this month, M&A cases in the crypto industry reached 10, while financing rounds numbered only 14, meaning M&A accounts for approximately 42% of primary market transactions—the highest level in history. This does not signal a sudden industry boom. Instead, the rapid rise in M&A share primarily reflects the continued downturn in the financing market. Since November 2024, monthly crypto M&A deals have remained between 10-20, while financing deals have plummeted from around 100 to about 50, possibly hitting a new low this month. For project teams, this means the traditional path of relying on narratives, token expectations, and ecosystem subsidies to maintain valuations is narrowing. For leading companies, it presents a rare window to acquire teams, licenses, technology, liquidity, and market access at lower prices, with less competition and stronger bargaining power. Key active buyers include Coinbase, Kraken, Ripple, MoonPay, Polymarket, Kaiko, Sol Strategies, GSR, Keyrock, Jupiter, Paxos, and Ondo Finance. Their M&A logic is consistent: acquiring key capabilities at lower costs during the industry downturn. This is driven by more attractive valuations, reduced time and trial-and-error costs, the acquisition of licenses and compliance resources, and the integration of industry upstream and downstream segments. Current M&A focuses are concentrated in four areas: trading infrastructure (e.g., Coinbase acquiring Deribit, Kraken acquiring NinjaTrader), payments and stablecoins (e.g., MoonPay, Ripple expanding payment networks), compliance licenses, and asset issuance/distribution (e.g., acquisitions related to RWA and token issuance platforms like Coinbase's purchases of Liquifi and Echo). The rise in M&A is altering the primary market's exit logic. It provides an alternative path to the token-dependent model, encouraging teams to build tangible products, revenue, and strategic value that can be integrated. This could inject confidence into the market, showing that asset buyers and exit possibilities still exist, albeit with a stricter focus on real utility. However, this trend also indicates the crypto industry is becoming more centralized. As asset issuance, trading, market-making, custody, payments, and data gradually consolidate in the hands of a few major players, the industry's initial emphasis on openness and anti-monopoly is being reshaped by commercial realities. Coupled with rising compliance barriers, this signals the end of the low-barrier era for crypto entrepreneurship.

链捕手32m ago

M&A Deals in the Crypto Market Are Unusually Active

链捕手32m ago

M&A Deals Are Exceptionally Active in the Crypto Market

Mergers and acquisitions (M&A) activity in the cryptocurrency primary market has reached a historic high, accounting for approximately 42% of total deals in the current month, nearly matching the number of financing rounds. This shift does not signal a new boom cycle but rather reflects a severe contraction in the venture capital funding environment. As financing dwindles, established industry giants—including major exchanges, payment firms, and infrastructure providers—are seizing the opportunity to acquire strategic assets at lower valuations. Key drivers behind the surge in M&A include depressed project valuations, the need to quickly acquire talent and technology to capture short market windows, the pursuit of crucial regulatory licenses, and the strategic expansion into adjacent business verticals such as derivatives, payments, stablecoins, and real-world asset (RWA) issuance. Major acquisitions, like Coinbase's purchase of Deribit and Kraken's acquisition of NinjaTrader, exemplify the push to expand into high-margin areas like derivatives and multi-asset trading. This trend is reshaping the industry's exit landscape, offering an alternative to token-based exits and incentivizing startups to build tangible products and revenue streams with inherent strategic value for acquisition. However, it also points toward increasing centralization, as critical functions—trading, custody, payments, compliance—become concentrated within a few large, well-capitalized platforms, potentially raising barriers to entry for new ventures.

marsbit33m ago

M&A Deals Are Exceptionally Active in the Crypto Market

marsbit33m ago

Solana Privacy Ecosystem Panorama: A Complete Privacy Stack from Compute to AI

**Title: The Solana Privacy Ecosystem: A Full-Stack View from Compute to AI** **Summary:** This article provides a comprehensive overview of the emerging privacy landscape on the Solana blockchain, characterizing it as still in early development. It identifies two primary verticals—Neobanks and Private DeFi—as key drivers, while noting gaps in tooling and user experience. The discussion centers on two main approaches to private computation: Arcium, which utilizes Multi-Party Computation (MPC) networks (Multi-Party eXecution Environments) to process encrypted data with final settlement on Solana; and Magic Block, which leverages Trusted Execution Environments (TEEs) via its Private Ephemeral Rollup (PER). Both enable confidential applications like dark pools and private DeFi with minimal code changes. Building on this infrastructure, projects are creating privacy-focused applications. Umbra, built on Arcium, offers Encrypted Token Accounts (ETAs) for private balances, transfers, and selective disclosure for compliance. Other wallets like Privacy Cash and Hush provide mixer-like functionality for SOL. For private trading, encifherio uses TEEs to encrypt swap details routed through Jupiter, while VanishTrade and Darklake focus on shielding transaction intent and liquidity routing, with Darklake introducing a "blind slippage pool" to prevent front-running. Further applications include private prediction markets (e.g., Melee Markets using Arcium's encrypted order books) and private AI. Loyal exemplifies the latter, using both Magic Block and Arcium to enable decentralized AI agents that store user data, conversations, and transactions confidentially on-chain. The article concludes by framing privacy not as a single technology but as an evolving "ultimate privacy stack," with experts like Helius's Mert envisioning a future combination of Fully Homomorphic Encryption (FHE) and Zero-Knowledge proofs (ZK). Helius Privacy itself is developing a ZK-based UTXO privacy layer for Solana.

Foresight News38m ago

Solana Privacy Ecosystem Panorama: A Complete Privacy Stack from Compute to AI

Foresight News38m ago

Trading

Spot
Futures
活动图片