Different Choices After the Plunge: Institutions Buy the Dip, Traders Shift to US Stocks

marsbitPublished on 2026-06-08Last updated on 2026-06-08

Abstract

Title: Diverging Strategies After the Crash: Institutions Buying the Dip, Traders Shifting to US Stocks Following a sharp decline where Bitcoin briefly fell below $60,000 on June 6th, market sentiment remains "extreme fear" despite a partial recovery. This has led to varied responses from major market participants. Several institutional figures and analysts present a cautiously optimistic long-term view for Bitcoin. Glassnode's co-founder identifies $46k-$54k as a probable key bottom range based on historical on-chain models, while a Standard Chartered executive suggests the bottom is nearly formed. Strive's CEO points to Bitcoin touching its 200-week moving average as a historically reliable buy signal. Analysts highlight metrics like MVRV ratio and the "Power Law" model indicating Bitcoin is in an extremely undervalued zone. Conversely, some traders are exiting the crypto space. One trader cited a more attractive risk/reward profile and deeper research opportunities in US stocks, particularly with AI-related equities outperforming and capital rotating away from crypto. This shift is partly attributed to perceived ongoing risks, including those related to Strategy's Bitcoin sales. Market prediction data suggests a high probability (72%) of Bitcoin falling below $55,000, but lower odds for a deeper crash below $35k-$40k. The overall picture is one of division: institutions and long-term analysts see a accumulating opportunity, while some active traders are seeking alpha e...

On June 6th, BTC once fell below the $60,000 mark, dipping as low as $59,130. By June 8th, the Bitcoin price had recovered to around $63,000. Although the price has rebounded several thousand dollars, the earlier breach of the key psychological integer level continues to weigh heavily on market confidence and sentiment in the cryptocurrency space.

The current Fear & Greed Index stands at 15, indicating that market sentiment remains in "Extreme Fear." Most altcoins have also followed suit, plunging into a deep correction alongside the broader market.

Is it now a dip-buying zone? Institutions, traders, and others have shared their perspectives.

Glassnode Co-founder: $46k to $54k is the Key Bottom Range

Rafael, the co-founder of Glassnode, posted stating that Bitcoin has retraced approximately 50% from its all-time high. On-chain data shows that BTC is currently trading near a crucial support zone formed by the Median Realized Price ($64.1k) and the 200-week moving average ($61.7k).

Historically, Bitcoin has traded below this level for only about 7% of the time.

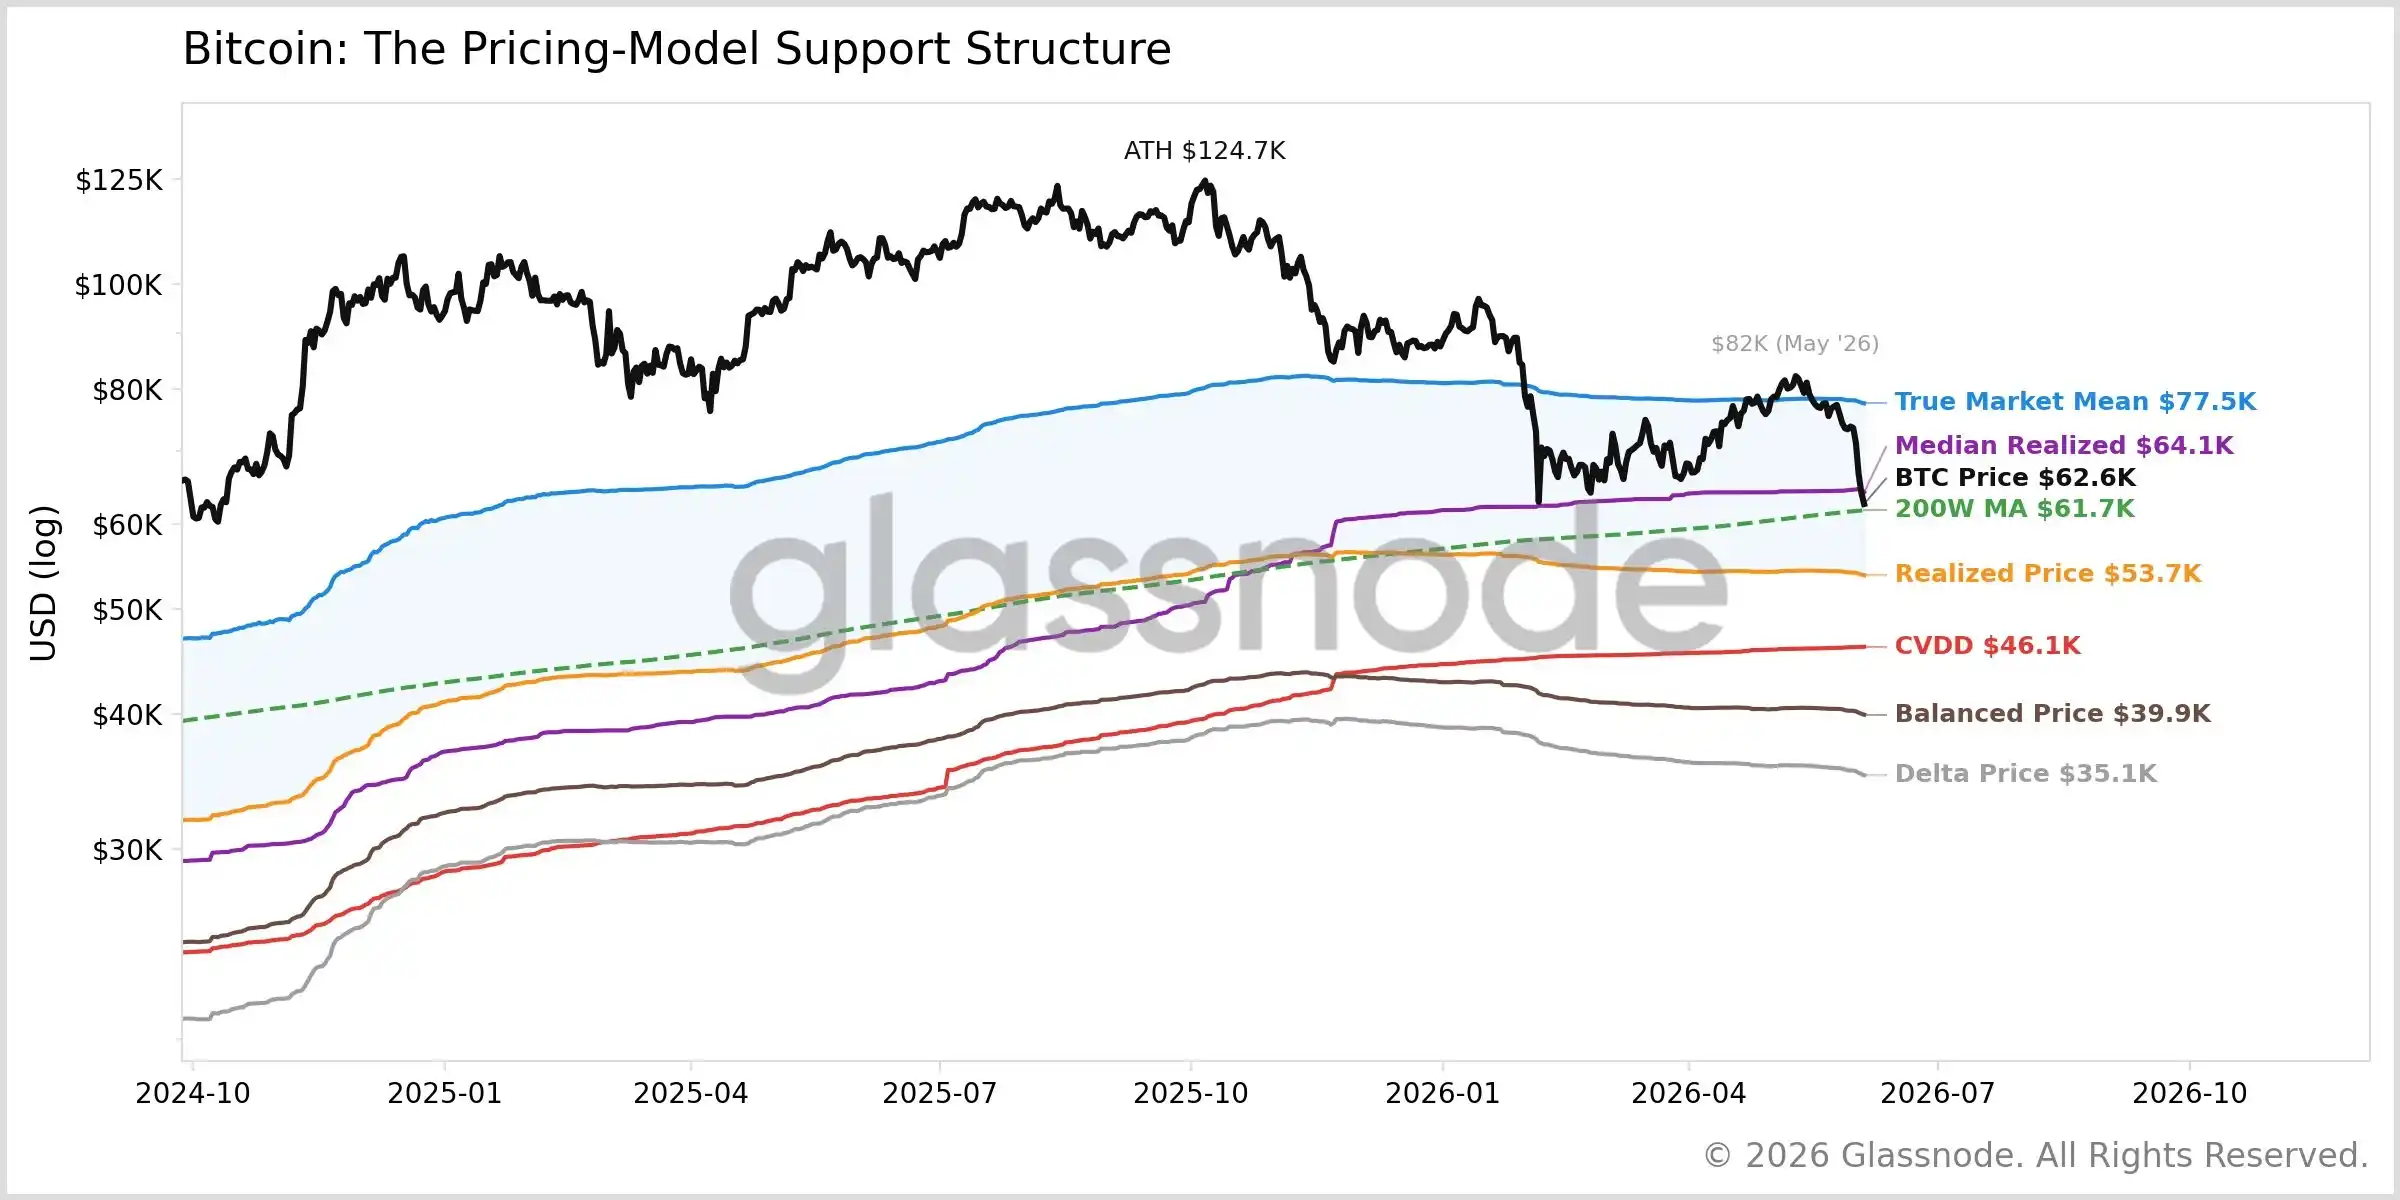
Looking at long-term valuation models, below the 200-week moving average lie the Realized Price (~$54k), the CVDD (~$46.2k), the Balanced Price (~$40k), and the Delta Price (~$35k) in descending order. Historically, bear market bottoms have touched this cost basis range before reversing. Among these, the CVDD is considered the most historically accurate bottom anchor. According to current model projections, the $46k to $54k range constitutes a higher-probability bottom zone, while $35k to $40k belongs to a deep capitulation area under extreme panic scenarios, accounting for less than 3% of trading days in history.

However, as the Bitcoin market matures, the magnitude of cyclical drawdowns shows a narrowing trend. The maximum declines in previous bear markets were 85%, 84%, and 77% respectively, whereas the current cycle has only retraced about 50% from its all-time high so far. This suggests the possibility of further declines, but a higher-probability bottom may lie in the $46k to $54k range. If a subsequent rebound occurs, $75k to $79k will become the first significant recovery zone, with greater resistance likely around the 50-week moving average near ~$93k and the previous all-time highs.

NYDIG Global Head of Research: AI is Siphoning Significant Crypto Capital

Greg Cipolaro, Global Head of Research at NYDIG, stated in a research report that he believes the overlap between AI and crypto investors is far greater than many realize. Both attract investors seeking exposure to emerging technologies and alpha returns. As AI-related stocks continue to outperform the broader market, capital flows and rotates out of the crypto market. Investors are also preparing for what could be the largest tech IPO cycle in years. Sales by Mt. Gox creditors and increased market concerns have exacerbated the downturn.

Greg Cipolaro noted in his report that multiple metrics are approaching levels historically coincident with major bottoms. Bitcoin's MVRV Ratio has fallen to 1.2, and the percentage of supply in profit recently slipped below 50%, another indicator often associated with capitulation. However, the magnitude of this drawdown remains relatively mild by historical standards. He pointed out that Bitcoin's decline of about 53% from its peak ($126k in October) is much shallower than the 75%-90% retracements seen in previous cycles. Whether the low has already been formed likely depends on whether institutional demand has structurally altered the cycle or merely delayed a deeper realignment.

Standard Chartered Head of Digital Asset Research: Bitcoin Bottom is Almost Formed

Geoffrey Kendrick, Head of Digital Asset Research at Standard Chartered, stated that the Bitcoin bottom is "almost certainly formed," and the current price range may be the long-awaited buying opportunity for investors.

An important trigger for this decline was the sale of 32k BTC by Mt. Gox creditors. However, referencing the historical experience from late 2022, it's likely that Mt. Gox creditors will soon engage in much larger-scale repurchases, potentially reaching 10 or even 100 times the amount previously sold.

If such buying is confirmed, it would serve as a significant signal for a market bottom.

Strive CEO: Bitcoin Touched 200-Week Moving Average (Fifth Time in History), First Four Times Were Perfect Buying Opportunities

Matt Cole, CEO of asset management firm Strive, stated in an interview with CNBC's Squawk Box Europe that Bitcoin touching the 200-week moving average (the fifth time in history) with the first four times being "perfect buying opportunities." He also emphasized that Bitcoin's fundamentals have "never been better" and views this touch of the 200-week MA as a historic buying opportunity.

Trader Eugene: Has Temporarily Exited Crypto for US Stocks, Won't Try to Catch the Bitcoin Falling Knife

Trader Eugene Ng Ah Sio posted on his personal channel that he has largely exited the cryptocurrency market since May 13th of this year and shifted his primary focus to researching the stock market. He believes that, compared to the current crypto market, the stock market offers greater appeal in terms of research depth, cognitive challenge, and trading/investment opportunities. Based on his assessment of the industry's current state, he expects to maintain this strategy for the foreseeable future, only continuing to follow crypto industry developments without active participation in trading.

Eugene further stated that unless the market presents an extremely attractive risk-reward opportunity, he has no plans to return to the crypto market in the near term, and he does not currently see such conditions materializing. He believes the trajectory of the crypto market is diminishing its appeal as a trading and investment arena, hence he will continue focusing on traditional stock markets for now.

Regarding Mt. Gox, Eugene believes the associated risks are just beginning to surface. He stated that even if Mt. Gox creditors have sold more Bitcoin recently, it merely delays the problem rather than solving it.

Until the high correlation between Mt. Gox and Bitcoin is broken, he is not optimistic about long opportunities for Bitcoin. As for the market bottom location, he admitted he cannot predict it, but he has stopped attempting "catching the falling knife" style dip-buying trades.

Trader Killa: Now is a Generational Buying Opportunity

Trader Killa tweeted during Bitcoin's decline on June 6th, stating that now is a generational buying opportunity. On June 8th, he indicated that BTC has entered the "final phase" and "final extension," and he has deployed 90% of his capital.

Additionally, Killa mentioned that the "protective buy walls" that emerged during last weekend's crash have not been withdrawn, and he believes the likelihood of quickly revisiting these support levels in the short term is low. Killa is a quantitative trader focused on BTC, who previously predicted the peak of this bull cycle in May 2025.

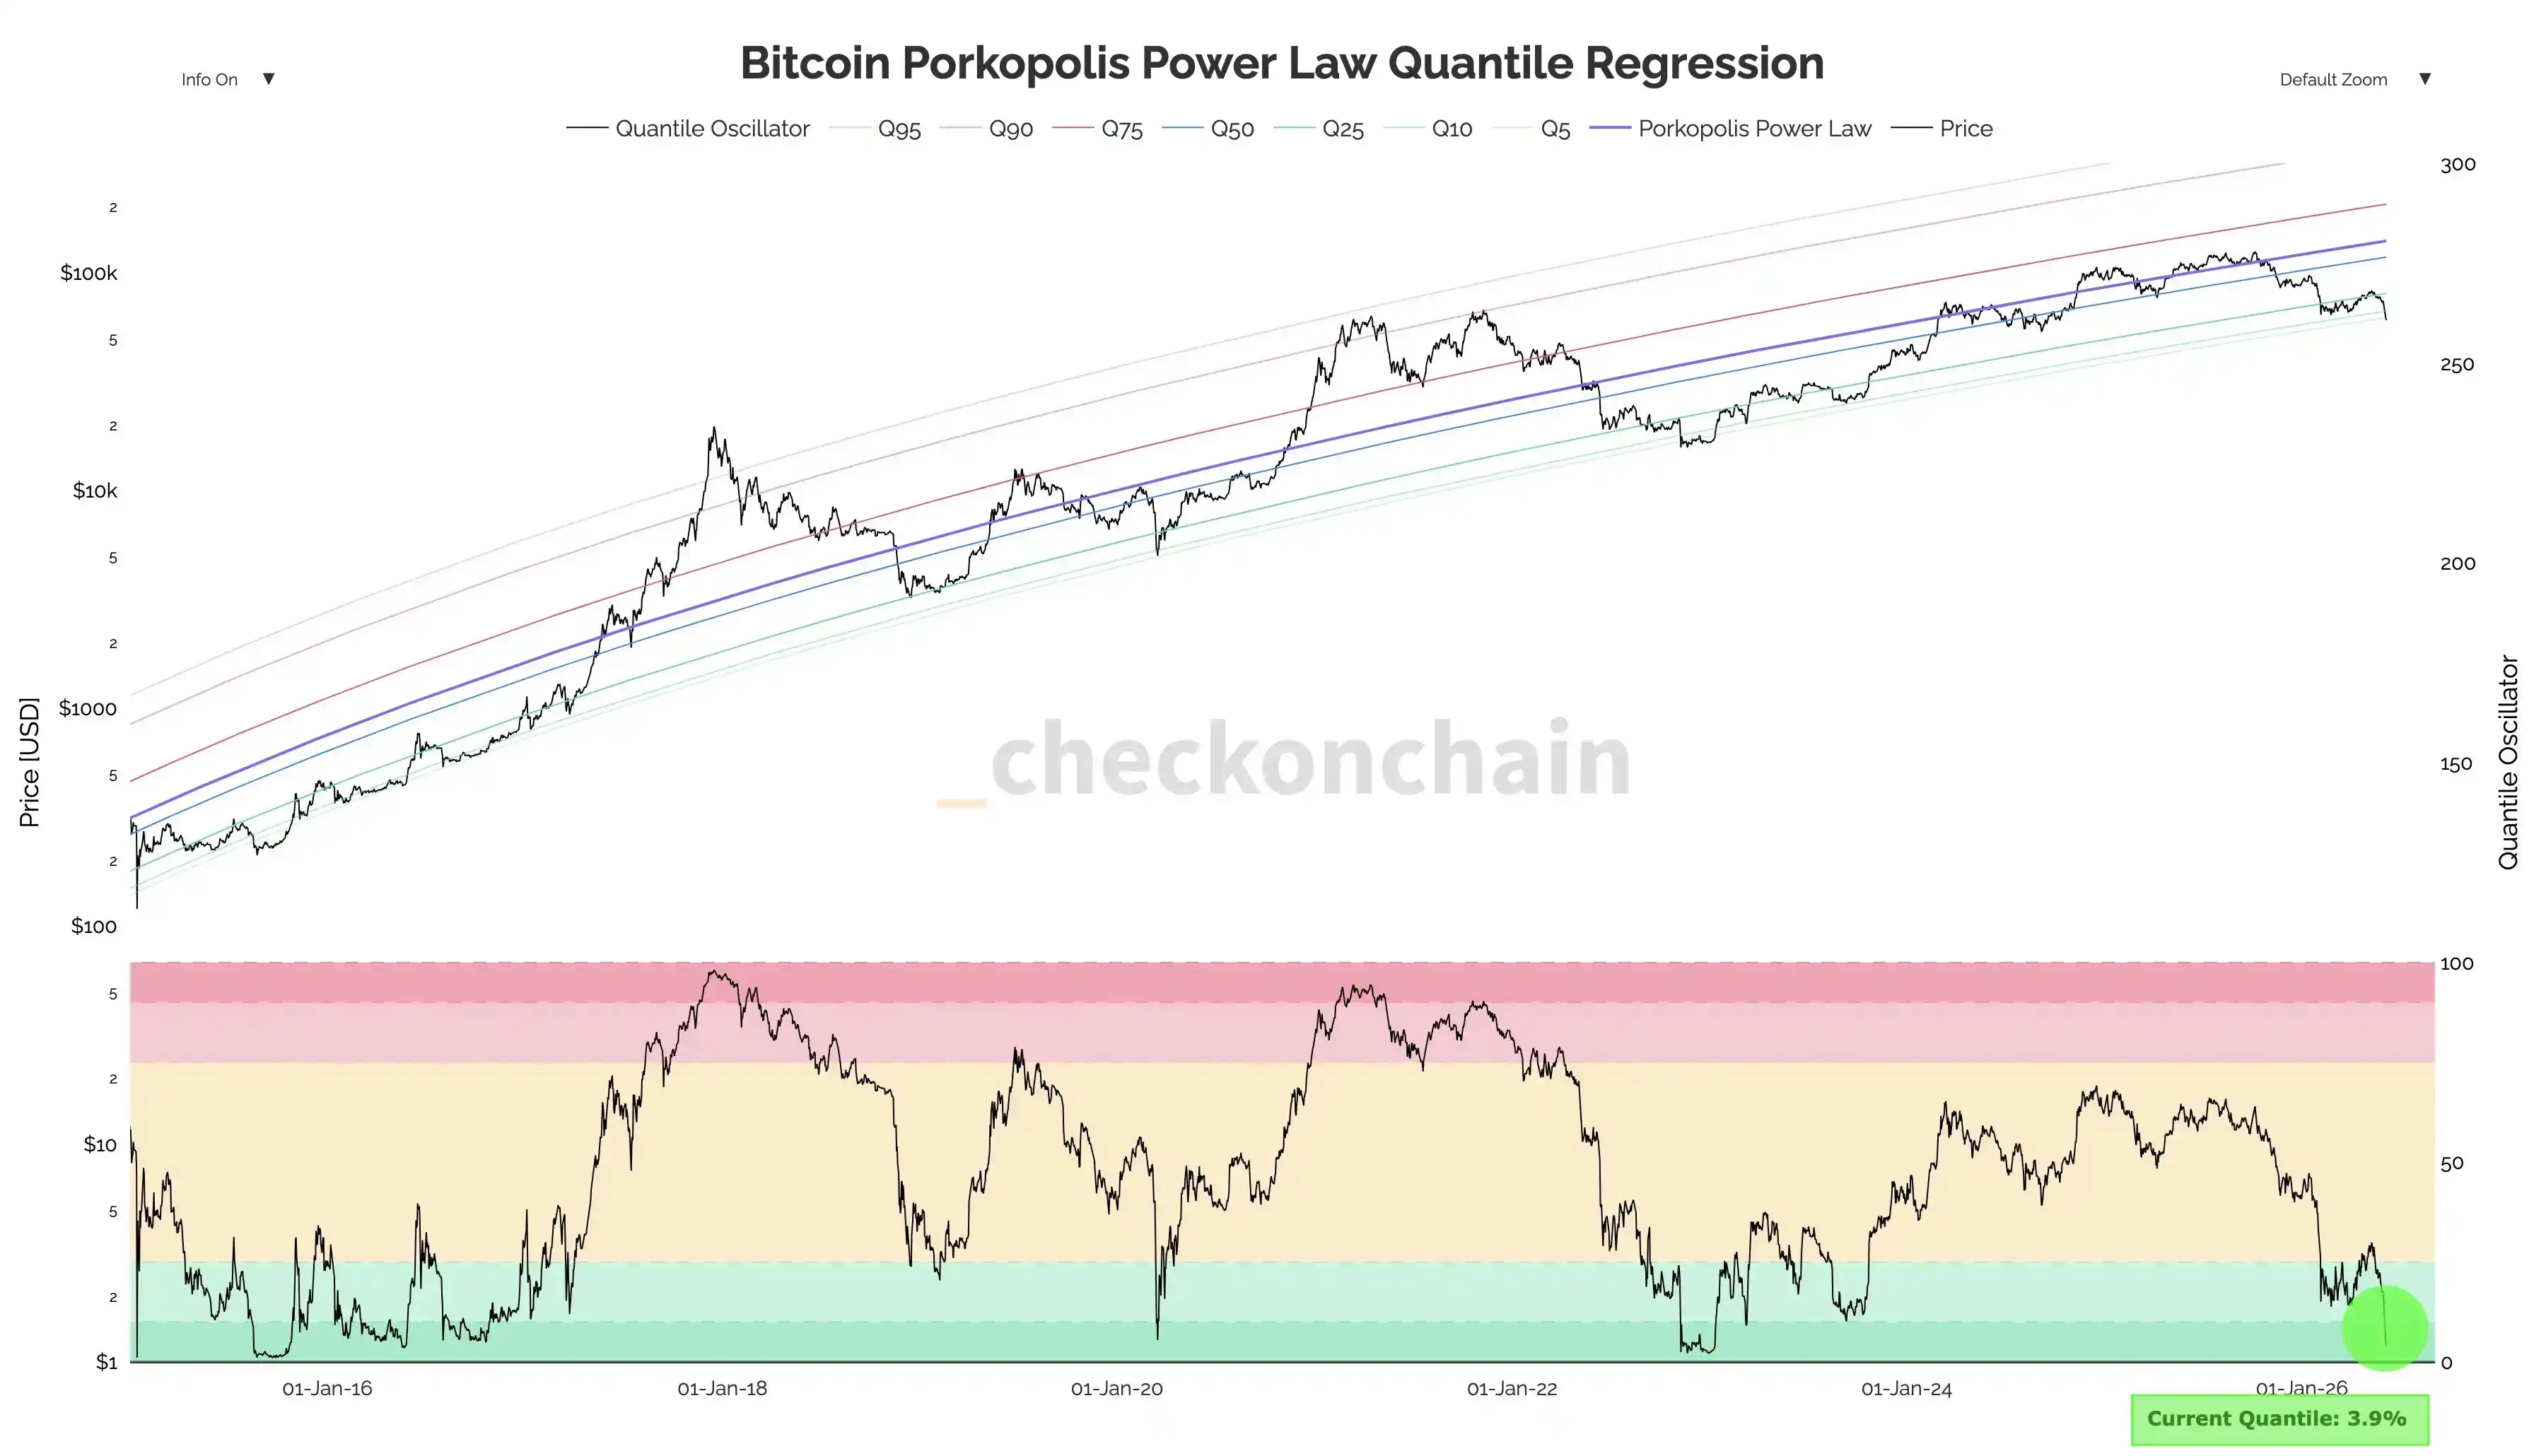
Analyst Darkfost: Bitcoin Has Entered Extreme Undervaluation Zone

According to data from analyst Darkfost, Bitcoin has retraced to fall below the 4th percentile line of the Power Law model, entering an extreme undervaluation zone. Historically, Bitcoin has only traded at such valuation levels 4% of the time. Darkfost emphasized that this is a suitable period for long-term position building, not a short-term price prediction.

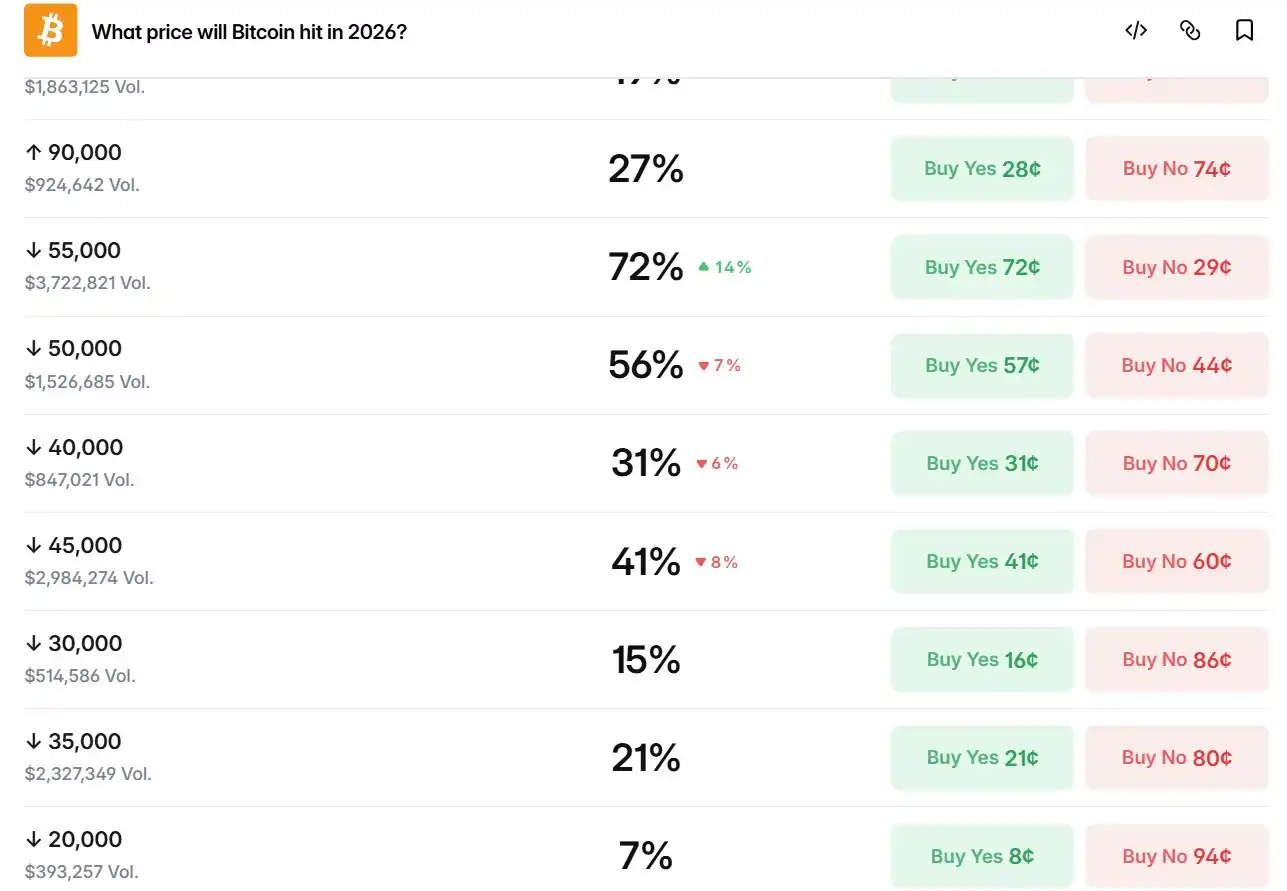
Polymarket Data: 72% Probability BTC Falls Below $55k

Latest data on Polymarket shows the probability of BTC falling below $45k is 41%, below $50k is 56%, and below $55k is 72%. The probability of falling below $40k is 31%, and below $35k is only 21%.

Most market participants currently believe the probability of BTC falling to the $35k–$40k range is not high.

Related Questions

QAccording to the article, what price range does Glassnode's co-founder identify as the key bottom zone for Bitcoin, and what model does he cite as historically the most accurate bottom anchor?

AGlassnode's co-founder, Rafael, identifies the key bottom zone for Bitcoin as between $46,000 and $54,000. He cites the CVDD model as historically the most accurate bottom anchor point.

QWhat is the main reason provided by NYDIG's Global Head of Research, Greg Cipolaro, for capital flowing out of the crypto market?

AGreg Cipolaro states that capital is flowing out of the crypto market because AI-related stocks are outperforming, attracting investors who seek exposure to emerging technologies and excess returns. This has led to a rotation of capital from crypto into AI and also in anticipation of a large tech IPO cycle.

QWhy does Standard Chartered's Head of Digital Assets Research, Geoffrey Kendrick, believe the Bitcoin bottom is 'almost formed'?

AGeoffrey Kendrick believes the Bitcoin bottom is 'almost formed' because he sees the current price range as a long-awaited buying opportunity. He points to Mt. Gox's potential large-scale buyback as a key signal, expecting it to be 10 to 100 times the size of their recent sales, similar to the pattern observed in late 2022.

QWhat is the primary reason trader Eugene Ng Ah Sio has shifted his focus from crypto to the stock market?

ATrader Eugene Ng Ah Sio has shifted his focus to the stock market because he finds it more attractive in terms of research depth, intellectual challenge, and the availability of trading and investment opportunities compared to the current crypto market. He believes the crypto market's development trajectory is diminishing its appeal as a trading/investment field for now.

QWhat does the data from the prediction market Polymarket indicate about the probability of Bitcoin's price falling to different levels?

AAccording to Polymarket data, the probability of Bitcoin falling below $55,000 is 72%, below $50,000 is 56%, and below $45,000 is 41%. The probabilities for dropping to $40,000 and $35,000 are 31% and 21% respectively, indicating that most market participants believe a drop to the $35,000-$40,000 range is less likely.

Related Reads

Bitcoin Monthly Chart Adjustment Structure Established, HYPE Entry Opportunity Emerges | Exclusive Analysis

Bitcoin Monthly Correction Structure Confirmed, HYPE Entry Opportunity Emerges | Guest Analysis Last week's analysis correctly identified that the $60,000 level for Bitcoin was an intermediate point, not the bottom of the current correction. This was validated on June 5th when the price broke below this key support, dropping to around $59,100. The monthly-level a-b-c three-wave corrective structure from the October 2025 high of $126,200 is now fully established, with the market currently in the c-wave decline phase. The cumulative adjustment time is less than 35 days, indicating the structure is far from complete. This week's focus will be tracking the rebound's strength and resistance performance. The two key resistance zones of $65,000 and $69,500~$70,500 will be crucial observation points for determining the subsequent trend. For HYPE, last week's top warning signal was also validated, with the price falling up to 27% from its $75.87 high. The token has now entered a support zone, presenting a potential short-term entry opportunity. From a strategic standpoint, the medium-term outlook remains bearish, awaiting optimal timing to add short positions upon a rebound. **Key Trading Views Summary:** * **BTC:** The analysis maintains a bearish medium-term bias. Strategy involves building short positions on rebounds towards $65,000 or the $69,500~$70,500 resistance area. A break below the $59,000-$60,000 support could trigger additional short entries. Short-term trading (30% capital) focuses on range-bound opportunities. * **HYPE:** Following a confirmed correction from the $75.87 high, the short-term strategy shifts to "buying on dips." Consider light long positions (under 30%仓位) if the price finds support and shows stabilization signals in the $55-$57 or deeper $47-$49 support zones, contingent on confirming technical signals. The key resistance to watch is the $62.5-$64.57 area. **Risk Management Reminder:** Always set an initial stop-loss immediately upon opening a position. Move the stop-loss to breakeven upon achieving 1% profit, and subsequently trail it to lock in gains. Market conditions change rapidly; this analysis is for informational purposes only and not investment advice.

marsbit4m ago

Bitcoin Monthly Chart Adjustment Structure Established, HYPE Entry Opportunity Emerges | Exclusive Analysis

marsbit4m ago

Valuation Surpasses 200 Billion, Kimi Reportedly Raises 13.6 Billion More, Speeds Up Hong Kong IPO

Beijing-based AI unicoth MoonDark (Kimi) is reportedly in talks for a new funding round aiming to raise up to $20 billion (approximately RMB 136 billion), targeting a post-money valuation of $300 billion (approximately RMB 2.035 trillion). If successful, this would mark its third round in six months and a six-fold increase from its $43 billion valuation in December last year. Last month, the company completed a $20 billion funding round led by Meituan Longzhu, reaching a valuation exceeding $200 billion. According to reports, MoonDark has raised over RMB 376 billion across six rounds, making it the most funded large language model startup in China. Founded in 2023 by CEO Yang Zhilin, the company's core product is the Kimi AI Assistant. In April, it launched and open-sourced its flagship model, Kimi K2.6, which has demonstrated performance comparable to top models like GPT-5.4 in certain benchmarks. Recently, it began beta testing for Kimi Work, a local AI agent for knowledge workers. Commercially, the company's Annual Recurring Revenue (ARR) reportedly surpassed $2 billion in April. Regarding its IPO plans, Bloomberg reported in March that MoonDark is preparing for a listing in Hong Kong, though the process remains in early stages. The funding and IPO pace for leading Chinese AI firms has accelerated notably in 2026, mirroring global trends where companies like OpenAI and Anthropic are also setting new fundraising and valuation records. Securing substantial capital is becoming a critical factor in the competitive landscape alongside model capabilities.

marsbit8m ago

Valuation Surpasses 200 Billion, Kimi Reportedly Raises 13.6 Billion More, Speeds Up Hong Kong IPO

marsbit8m ago

South Korea's KOSPI Plunges 8.37% at Opening, Triggers Circuit Breaker: The 'Two Stocks' That Powered the Bull Market Recoil in a Single Day

On June 8th, South Korea's KOSPI index plunged 8.37% within minutes of market open, triggering a circuit breaker and halting trading. The crash was driven by a massive sell-off in heavyweight stocks Samsung Electronics and SK Hynix, which each fell 10%. These two chip giants alone account for over half of the KOSPI's total market capitalization and had contributed roughly 70% of the index's gains year-to-date, pushing it to become the world's sixth-largest stock market. The sell-off was ignited by negative guidance from U.S. chipmaker Broadcom on June 3rd, which sparked a global semiconductor stock rout. This shockwave hit South Korean markets on June 5th, with foreign investors leading a sustained exodus. The sharp decline on June 8th was exacerbated by high levels of retail margin debt (over 38 trillion KRW), forced liquidations, leveraged ETFs tied to the top stocks, and automated program trading, creating a vicious cycle. The Korean won also weakened significantly, further fueling foreign capital outflow. South Korean authorities issued emergency statements to calm markets, echoing recent warnings from the central bank governor about the risks of debt-driven investing. While some institutions like Goldman Sachs maintain long-term bullish targets for the KOSPI, the crash exposed the extreme market concentration and fragility behind its historic rally.

marsbit10m ago

South Korea's KOSPI Plunges 8.37% at Opening, Triggers Circuit Breaker: The 'Two Stocks' That Powered the Bull Market Recoil in a Single Day

marsbit10m ago

The Compounding Crisis in an Era of High Valuations: Is the US Stock Market Facing a New 'Lost Decade'?

This article analyzes the long-term structural risks in US equity markets, challenging the assumption that "time in the market" always ensures positive returns. Drawing on 155 years of historical data, it identifies three prolonged periods—1929-1954, 1966-1982, and 2000-2013—where real buy-and-hold returns were near zero or negative. Collectively, these "lost decades" represent roughly 35% of market history since 1871 and cause not just delayed wealth accumulation but permanent damage to compound growth paths due to the mathematics of recovering from significant drawdowns. Crucially, the authors argue that current conditions mirror historical precursors to such phases. Multiple valuation indicators, including the CAPE ratio (near its 99th percentile), the Buffett Indicator, and Tobin's Q, signal extreme overvaluation, historically associated with lower future 10-year real returns (averaging 3.6%). The paper debunks the common objection to tactical management—fear of missing the "best days" in the market—by showing that the vast majority of these top-performing days occur during bear markets and crises, often adjacent to the worst days. Therefore, avoiding major drawdowns inherently means missing these volatile surges. A key framework proposed involves monitoring market breadth (advance/decline data), which tends to deteriorate before major indices peak, providing an early warning signal. Combined with high valuations, breadth analysis offers a more robust risk-assessment tool. The conclusion for investors and advisors is not a forecast of an inevitable downturn, but a call to move from complacency to preparedness. The empirical evidence suggests that the conditions preceding lost decades are identifiable. A disciplined, adaptive strategy focused on valuation and breadth signals, rather than precise timing, can help protect long-term compounding from permanent impairment.

marsbit28m ago

The Compounding Crisis in an Era of High Valuations: Is the US Stock Market Facing a New 'Lost Decade'?

marsbit28m ago

Trading

Spot
Futures

Hot Articles

What is $BITCOIN

DIGITAL GOLD ($BITCOIN): A Comprehensive Analysis Introduction to DIGITAL GOLD ($BITCOIN) DIGITAL GOLD ($BITCOIN) is a blockchain-based project operating on the Solana network, which aims to combine the characteristics of traditional precious metals with the innovation of decentralized technologies. While it shares a name with Bitcoin, often referred to as “digital gold” due to its perception as a store of value, DIGITAL GOLD is a separate token designed to create a unique ecosystem within the Web3 landscape. Its goal is to position itself as a viable alternative digital asset, although specifics regarding its applications and functionalities are still developing. What is DIGITAL GOLD ($BITCOIN)? DIGITAL GOLD ($BITCOIN) is a cryptocurrency token explicitly designed for use on the Solana blockchain. In contrast to Bitcoin, which provides a widely recognized value storage role, this token appears to focus on broader applications and characteristics. Notable aspects include: Blockchain Infrastructure: The token is built on the Solana blockchain, known for its capacity to handle high-speed and low-cost transactions. Supply Dynamics: DIGITAL GOLD has a maximum supply capped at 100 quadrillion tokens (100P $BITCOIN), although details regarding its circulating supply are currently undisclosed. Utility: While precise functionalities are not explicitly outlined, there are indications that the token could be utilized for various applications, potentially involving decentralized applications (dApps) or asset tokenization strategies. Who is the Creator of DIGITAL GOLD ($BITCOIN)? At present, the identity of the creators and development team behind DIGITAL GOLD ($BITCOIN) remains unknown. This situation is typical among many innovative projects within the blockchain space, particularly those aligning with decentralized finance and meme coin phenomena. While such anonymity may foster a community-driven culture, it intensifies concerns about governance and accountability. Who are the Investors of DIGITAL GOLD ($BITCOIN)? The available information indicates that DIGITAL GOLD ($BITCOIN) does not have any known institutional backers or prominent venture capital investments. The project seems to operate on a peer-to-peer model focused on community support and adoption rather than traditional funding routes. Its activity and liquidity are primarily situated on decentralized exchanges (DEXs), such as PumpSwap, rather than established centralized trading platforms, further highlighting its grassroots approach. How DIGITAL GOLD ($BITCOIN) Works The operational mechanics of DIGITAL GOLD ($BITCOIN) can be elaborated on based on its blockchain design and network attributes: Consensus Mechanism: By leveraging Solana’s unique proof-of-history (PoH) combined with a proof-of-stake (PoS) model, the project ensures efficient transaction validation contributing to the network's high performance. Tokenomics: While specific deflationary mechanisms have not been extensively detailed, the vast maximum token supply implies that it may cater to microtransactions or niche use cases that are still to be defined. Interoperability: There exists the potential for integration with Solana’s broader ecosystem, including various decentralized finance (DeFi) platforms. However, the details regarding specific integrations remain unspecified. Timeline of Key Events Here is a timeline that highlights significant milestones concerning DIGITAL GOLD ($BITCOIN): 2023: The initial deployment of the token occurs on the Solana blockchain, marked by its contract address. 2024: DIGITAL GOLD gains visibility as it becomes available for trading on decentralized exchanges like PumpSwap, allowing users to trade it against SOL. 2025: The project witnesses sporadic trading activity and potential interest in community-led engagements, although no noteworthy partnerships or technical advancements have been documented as of yet. Critical Analysis Strengths Scalability: The underlying Solana infrastructure supports high transaction volumes, which could enhance the utility of $BITCOIN in various transaction scenarios. Accessibility: The potential low trading price per token could attract retail investors, facilitating wider participation due to fractional ownership opportunities. Risks Lack of Transparency: The absence of publicly known backers, developers, or an audit process may yield skepticism regarding the project's sustainability and trustworthiness. Market Volatility: The trading activity is heavily reliant on speculative behavior, which can result in significant price volatility and uncertainty for investors. Conclusion DIGITAL GOLD ($BITCOIN) emerges as an intriguing yet ambiguous project within the rapidly evolving Solana ecosystem. While it attempts to leverage the “digital gold” narrative, its departure from Bitcoin's established role as a store of value underscores the need for a clearer differentiation of its intended utility and governance structure. Future acceptance and adoption will likely depend on addressing the current opacity and defining its operational and economic strategies more explicitly. Note: This report encompasses synthesised information available as of October 2023, and developments may have transpired beyond the research period.

363 Total ViewsPublished 2025.05.13Updated 2025.05.13

What is $BITCOIN

Discussions

Welcome to the HTX Community. Here, you can stay informed about the latest platform developments and gain access to professional market insights. Users' opinions on the price of BTC (BTC) are presented below.

活动图片