This Bitcoin Index Just Entered The High Risk Territory As Price Stalls

bitcoinistPublished on 2026-05-28Last updated on 2026-05-28

Abstract

A Bitcoin risk indicator has entered a "high risk zone," signaling potential market weakness as BTC's price stalls near critical levels. Analyst Crypto Tice warns that previously supportive market conditions are breaking down, with the loss of the $78,000-$79,000 area suggesting selling pressure is no longer being fully absorbed. Two scenarios are outlined: if the risk index falls, recovery could continue; if it rises, a broader market breakdown may begin. Separately, analyst Killa identifies a make-or-break zone for Bitcoin. A rebound to $81,000-$82,000 would confirm a bullish structure shift, while a breakdown below current support could invalidate the bullish setup and potentially lead to a drop below $60,000. Traders are urged to monitor the risk index closely.

A market analyst has issued a fresh warning on Bitcoin (BTC), pointing to a shift in the cryptocurrency’s risk index as it moves back into a high-risk zone. The update comes as key price levels are broken and signs of weakness begin to emerge, raising concerns that BTC’s recovery may be losing momentum and a decline could be imminent.

Bitcoin Risk Index Signals Major Threat

Market analyst Crypto Tice is sounding the alarm on Bitcoin after flagging the cryptocurrency’s weakening market structure and rising downside risk. In a recent X post, the analyst stated that the Bitcoin risk index, a metric used to measure the current market environment, has moved back into “a high risk zone.”

According to him, this dangerous shift signals that the safe market conditions that had previously supported BTC’s recovery above $83,000 are now starting to break down. He added that the price area between $78,000 and $79,000, which previously acted as a breakeven level for many traders, has also been lost.

In his view, this change suggests that selling pressure is no longer fully absorbed by buyers and that sellers are now gaining more control over the market and BTC’s short-term price direction.

Attempting to pinpoint BTC’s next move, Crypto Tice outlined two possible paths from here. In the first scenario, the analyst suggested that if Bitcoin’s risk index falls back below 25, the market could stabilize, and the cryptocurrency’s recovery trend may continue.
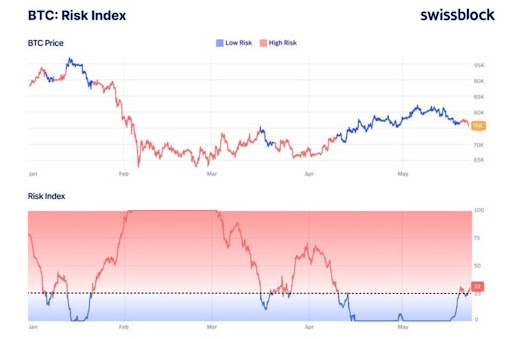
Source: Chart from Crypto Tice on X

However, he highlights a less optimistic scenario for his second outlook. Crypto Tice stated that if Bitcoin’s risk reading continues to rise, it could be an early confirmation that a broader breakdown has officially begun. The analyst noted that the BTC price would then enter a more fragile phase where recent support levels may no longer hold.

As a warning, Crypto Tice stressed that BTC’s current structure, which has supported its price for weeks, is now under serious threat. While he did not predict a specific price direction, he cautioned that the next move could be significant and urged traders to closely monitor Bitcoin’s risk index for further confirmation of trend direction.

BTC Sits At Critical Price Level That Could Decide Next Move

In a separate analysis, crypto expert Killa has identified a key Bitcoin price level that is critical to its broader market direction. He stated that BTC is currently in a make-or-break zone that could determine whether its uptrend continues or reverses, depending on its next move.

If Bitcoin holds current levels and rebounds toward $81,000 to $82,000, the analyst said it would confirm a shift in structure and suggest the market is continuing higher. He described this move as a strong bullish signal, noting that many traders are underestimating its importance.

On the flip side, the analyst has warned that a breakdown below current support levels would automatically invalidate Bitcoin’s bullish setup and open the door to a deeper correction. In that scenario, he sees BTC potentially dropping below $60,000 as selling pressure intensifies.

BTC trading at $75,880 on the 1D chart | Source: BTCUSDT on Tradingview.com

Related Questions

QAccording to analyst Crypto Tice, what key shift has occurred in the Bitcoin risk index and what does it signal?

AAccording to analyst Crypto Tice, the Bitcoin risk index has moved back into a 'high risk zone'. This signals that the previously safe market conditions supporting Bitcoin's recovery are starting to break down, with sellers gaining more control over the market.

QWhat is the critical price zone identified by analyst Killa that could determine Bitcoin's broader market direction?

AAnalyst Killa identified that Bitcoin is currently in a make-or-break price zone. This zone is critical and will determine whether the uptrend continues or reverses based on Bitcoin's next price move from this level.

QWhat are the two possible scenarios for Bitcoin's next move as outlined by Crypto Tice, based on the risk index behavior?

ACrypto Tice outlined two possible scenarios: 1) If the Bitcoin risk index falls back below 25, the market could stabilize and the recovery trend may continue. 2) If the risk index continues to rise, it could confirm the start of a broader breakdown, making recent support levels fragile and potentially failing to hold.

QWhat specific price levels did the analysts mention as either support or targets in their analysis of Bitcoin's potential movement?

AThe analysts mentioned several key price levels: a previous recovery above $83,000, the loss of the $78,000-$79,000 breakeven area, a potential rebound target of $81,000-$82,000, and a warning of a potential drop below $60,000 if a deeper correction occurs.

QWhat is the main concern raised by the analysts regarding Bitcoin's current market structure and momentum?

AThe main concern is that Bitcoin's recovery may be losing momentum. Analysts point to signs of weakness emerging, key price levels being broken, and a shift in market structure where selling pressure is no longer fully absorbed by buyers, suggesting a significant move could be imminent.

Related Reads

Consumer Confidence Hits Bottom, Macro Correlations Simultaneously Break Down: How Much Longer Can the U.S. Stock Market's Solo Rally Last?

The U.S. stock market is exhibiting a rare divergence: while consumer confidence hits historic lows and traditional macro asset correlations break down, major indices like the Nasdaq 100 and S&P 500 continue reaching record highs, fueled primarily by AI and semiconductor momentum. The rally is now highly concentrated, with strength rotating from giants like Nvidia to higher-beta plays within semiconductors, particularly memory chips. This surge occurs despite a significant split between pessimistic consumer sentiment and still-resilient actual spending behavior, partially supported by fiscal stimulus. Goldman Sachs traders highlight a critical structural fissure: correlations between the S&P 500 and key macro assets (rates, gold, VIX, oil) have deviated extremely from long-term historical norms. Concurrently, the market is in a negative Gamma regime, making it more sensitive to price moves, and hedge fund positioning in momentum and semiconductors is at crowded levels. The sustainability of this "solo rally" faces three main constraints: 1) Oil price volatility linked to Middle East geopolitical risks, 2) Extreme crowding in semiconductor and momentum trades, increasing vulnerability to disappointments, and 3) The breakdown of traditional macro correlations, suggesting the rally reflects a specific mix of factors rather than broad-based risk appetite. The key question is not if indices can rise further, but which variable—oil, rates, or semiconductor momentum—might trigger a repricing of the current fragile logic.

marsbit30m ago

Consumer Confidence Hits Bottom, Macro Correlations Simultaneously Break Down: How Much Longer Can the U.S. Stock Market's Solo Rally Last?

marsbit30m ago

Will OpenAI Swallow the Application Layer? a16z Says Real Opportunities Lie Outside General Models

As large language models (LLMs) from companies like OpenAI and Anthropic become more powerful, many fear they will dominate the AI application layer, leaving no room for startups. However, this article argues that the real opportunity lies not on the "Yellow Brick Road"—the high-profile, general-purpose tasks like code and text generation that model labs are directly pursuing—but in the "rest of Oz": complex, vertical-specific applications. On the Yellow Brick Road, model companies have inherent advantages: control over the model, better margins, pricing power, and strong distribution. Startups building generic, horizontal "co-pilot" tools for standard tasks are competing directly on this path and are vulnerable. True defensibility and value are found in specialized, vertical applications. These involve deep integration into messy, multi-step business workflows (e.g., sales, insurance, legal), handling legacy systems, data quality issues, compliance, and governance. The "scaffolding" around the model—the specialized tools, automations, workflows, and industry knowledge—becomes more critical than the raw model power itself. Vertical AI companies can build defensible moats through: * **Data & Learning Flywheels:** Capturing unwritten industry practices and specific customer feedback not found in public training data. * **Managing Model Complexity:** Routinely evaluating and routing queries across multiple models (including open-source) to optimize for performance and cost, and absorbing the migration burden of model upgrades for clients. * **Cost Optimization:** Using cheaper, fine-tuned models for specific sub-tasks instead of always calling the most expensive, general-purpose model. * **Governance & Compliance:** Providing the control plane for permissions, auditing, and ensuring compliance with industry-specific regulations (e.g., HIPAA, FINRA). Examples from sales (11x) and insurance (FurtherAI) illustrate that clients pay for systems that drive specific business outcomes (e.g., sales pipeline, policy underwriting), not for generic intelligence. These systems become the "operational memory" of a business, a layer that is hard to replace, even as the underlying LLMs commoditize and improve. To test if a startup is building in the "rest of Oz," it should pass checks like the **Tool & Steps Test** (requires complex, multi-step workflows), the **System Test** (owns the end-to-end workflow, not just a tool on top), and the **Hedge Fund / P&L Test** (measured by client business outcomes, not benchmark scores). Both model labs and vertical application companies will win. The next generation of enterprise software will be built in the specialized, complex, and high-value territory beyond the Yellow Brick Road.

marsbit58m ago

Will OpenAI Swallow the Application Layer? a16z Says Real Opportunities Lie Outside General Models

marsbit58m ago

'ASIC Giant' Marvell Sets Record Quarterly Revenue, Raises Guidance Again, CEO Says Data Center Business Is 'On Fire'

Marvell Technology, a leading player in custom AI chips and data center connectivity, reported record revenue for its fiscal Q1 2027, driven by explosive demand in its data center business. Revenue reached $2.418 billion, slightly surpassing expectations, though GAAP net income fell year-over-year due to acquisition-related costs. Crucially, data center revenue hit $1.83 billion, making up 76% of the total and growing 27% YoY. The company significantly raised its full-year and next-year guidance, citing "exceptionally strong AI-related orders." Revenue is now projected at ~$11.5 billion for FY2027 and ~$16.5 billion for FY2028. CEO Matt Murphy emphasized that growth in the data center segment is accelerating. The AI Interconnect business, now expected to grow over 70% annually, saw its forecast lifted again due to rising network demands in complex AI models. Additionally, Marvell's custom chip (XPU) business is on a steep growth path, with FY2028 revenue anticipated to double and a target of over $10 billion by FY2029. The company also expanded its strategic collaboration with NVIDIA, focusing on silicon photonics, system integration, and AI-RAN solutions. To secure supply for surging demand, Marvell plans about $1 billion in supplier prepayments this fiscal year, highlighting its long-term capacity planning. Despite the strong results, the stock dipped slightly in after-hours trading.

marsbit1h ago

'ASIC Giant' Marvell Sets Record Quarterly Revenue, Raises Guidance Again, CEO Says Data Center Business Is 'On Fire'

marsbit1h ago

Trading

Spot
Futures

Hot Articles

What is $BITCOIN

DIGITAL GOLD ($BITCOIN): A Comprehensive Analysis Introduction to DIGITAL GOLD ($BITCOIN) DIGITAL GOLD ($BITCOIN) is a blockchain-based project operating on the Solana network, which aims to combine the characteristics of traditional precious metals with the innovation of decentralized technologies. While it shares a name with Bitcoin, often referred to as “digital gold” due to its perception as a store of value, DIGITAL GOLD is a separate token designed to create a unique ecosystem within the Web3 landscape. Its goal is to position itself as a viable alternative digital asset, although specifics regarding its applications and functionalities are still developing. What is DIGITAL GOLD ($BITCOIN)? DIGITAL GOLD ($BITCOIN) is a cryptocurrency token explicitly designed for use on the Solana blockchain. In contrast to Bitcoin, which provides a widely recognized value storage role, this token appears to focus on broader applications and characteristics. Notable aspects include: Blockchain Infrastructure: The token is built on the Solana blockchain, known for its capacity to handle high-speed and low-cost transactions. Supply Dynamics: DIGITAL GOLD has a maximum supply capped at 100 quadrillion tokens (100P $BITCOIN), although details regarding its circulating supply are currently undisclosed. Utility: While precise functionalities are not explicitly outlined, there are indications that the token could be utilized for various applications, potentially involving decentralized applications (dApps) or asset tokenization strategies. Who is the Creator of DIGITAL GOLD ($BITCOIN)? At present, the identity of the creators and development team behind DIGITAL GOLD ($BITCOIN) remains unknown. This situation is typical among many innovative projects within the blockchain space, particularly those aligning with decentralized finance and meme coin phenomena. While such anonymity may foster a community-driven culture, it intensifies concerns about governance and accountability. Who are the Investors of DIGITAL GOLD ($BITCOIN)? The available information indicates that DIGITAL GOLD ($BITCOIN) does not have any known institutional backers or prominent venture capital investments. The project seems to operate on a peer-to-peer model focused on community support and adoption rather than traditional funding routes. Its activity and liquidity are primarily situated on decentralized exchanges (DEXs), such as PumpSwap, rather than established centralized trading platforms, further highlighting its grassroots approach. How DIGITAL GOLD ($BITCOIN) Works The operational mechanics of DIGITAL GOLD ($BITCOIN) can be elaborated on based on its blockchain design and network attributes: Consensus Mechanism: By leveraging Solana’s unique proof-of-history (PoH) combined with a proof-of-stake (PoS) model, the project ensures efficient transaction validation contributing to the network's high performance. Tokenomics: While specific deflationary mechanisms have not been extensively detailed, the vast maximum token supply implies that it may cater to microtransactions or niche use cases that are still to be defined. Interoperability: There exists the potential for integration with Solana’s broader ecosystem, including various decentralized finance (DeFi) platforms. However, the details regarding specific integrations remain unspecified. Timeline of Key Events Here is a timeline that highlights significant milestones concerning DIGITAL GOLD ($BITCOIN): 2023: The initial deployment of the token occurs on the Solana blockchain, marked by its contract address. 2024: DIGITAL GOLD gains visibility as it becomes available for trading on decentralized exchanges like PumpSwap, allowing users to trade it against SOL. 2025: The project witnesses sporadic trading activity and potential interest in community-led engagements, although no noteworthy partnerships or technical advancements have been documented as of yet. Critical Analysis Strengths Scalability: The underlying Solana infrastructure supports high transaction volumes, which could enhance the utility of $BITCOIN in various transaction scenarios. Accessibility: The potential low trading price per token could attract retail investors, facilitating wider participation due to fractional ownership opportunities. Risks Lack of Transparency: The absence of publicly known backers, developers, or an audit process may yield skepticism regarding the project's sustainability and trustworthiness. Market Volatility: The trading activity is heavily reliant on speculative behavior, which can result in significant price volatility and uncertainty for investors. Conclusion DIGITAL GOLD ($BITCOIN) emerges as an intriguing yet ambiguous project within the rapidly evolving Solana ecosystem. While it attempts to leverage the “digital gold” narrative, its departure from Bitcoin's established role as a store of value underscores the need for a clearer differentiation of its intended utility and governance structure. Future acceptance and adoption will likely depend on addressing the current opacity and defining its operational and economic strategies more explicitly. Note: This report encompasses synthesised information available as of October 2023, and developments may have transpired beyond the research period.

363 Total ViewsPublished 2025.05.13Updated 2025.05.13

What is $BITCOIN

Discussions

Welcome to the HTX Community. Here, you can stay informed about the latest platform developments and gain access to professional market insights. Users' opinions on the price of BTC (BTC) are presented below.

活动图片