Natural Gas Double Bottom Breaks Through Cloud, Approaches Key Resistance Zone Around 2.800

Published on 2026-08-19Last updated on 2026-08-19

Abstract

Natural Gas's 5-hour candlestick chart has just confirmed a double bottom pattern, with a short-term rally breaking through the Ichimoku Cloud, now approaching the key resistance zone of $2.800-$2.830 – however, bulls fear a 'bull trap' may be imminent. Structural reversal signals are evident, but the primary trend remains bearish, requiring precise entry and stop-loss points.

Natural Gas's 5-hour candlestick chart has just confirmed a double bottom pattern, with the short-term uptrend breaking through the Ichimoku cloud and now approaching the key resistance zone of $2.800-$2.830. However, what bulls fear most is a potential "bull trap" lying ahead. While structural reversal signals are evident, the primary trend remains bearish, requiring precise entry and stop-loss points.

Bullish Reversal or a Trap?

A Quick Look at the Situation:

Natural Gas has broken above both the SMA(50) and the upper edge of the Ichimoku cloud, indicating a strengthening short-term trend.

The SuperTrend indicator has turned green, establishing a pullback support level at $2.667.

However, the price remains below the long-term SMA(200) at $2.931, meaning the primary bearish trend is not broken.

The MFI reading is exceptionally high at 87.46, indicating extreme overbought conditions and suggesting potential profit-taking pressure at any moment.

Core Risk:

The $2.800~$2.830 zone is a high-risk area for a "bull trap" during this upward surge. This area coincides with the Fibonacci 23.6% retracement level and previous highs. A failure to break through followed by a pullback could form a classic bull trap signal.

The ADX reading is only 19.63, indicating limited overall trend strength and suggesting continued tug-of-war between bulls and bears.
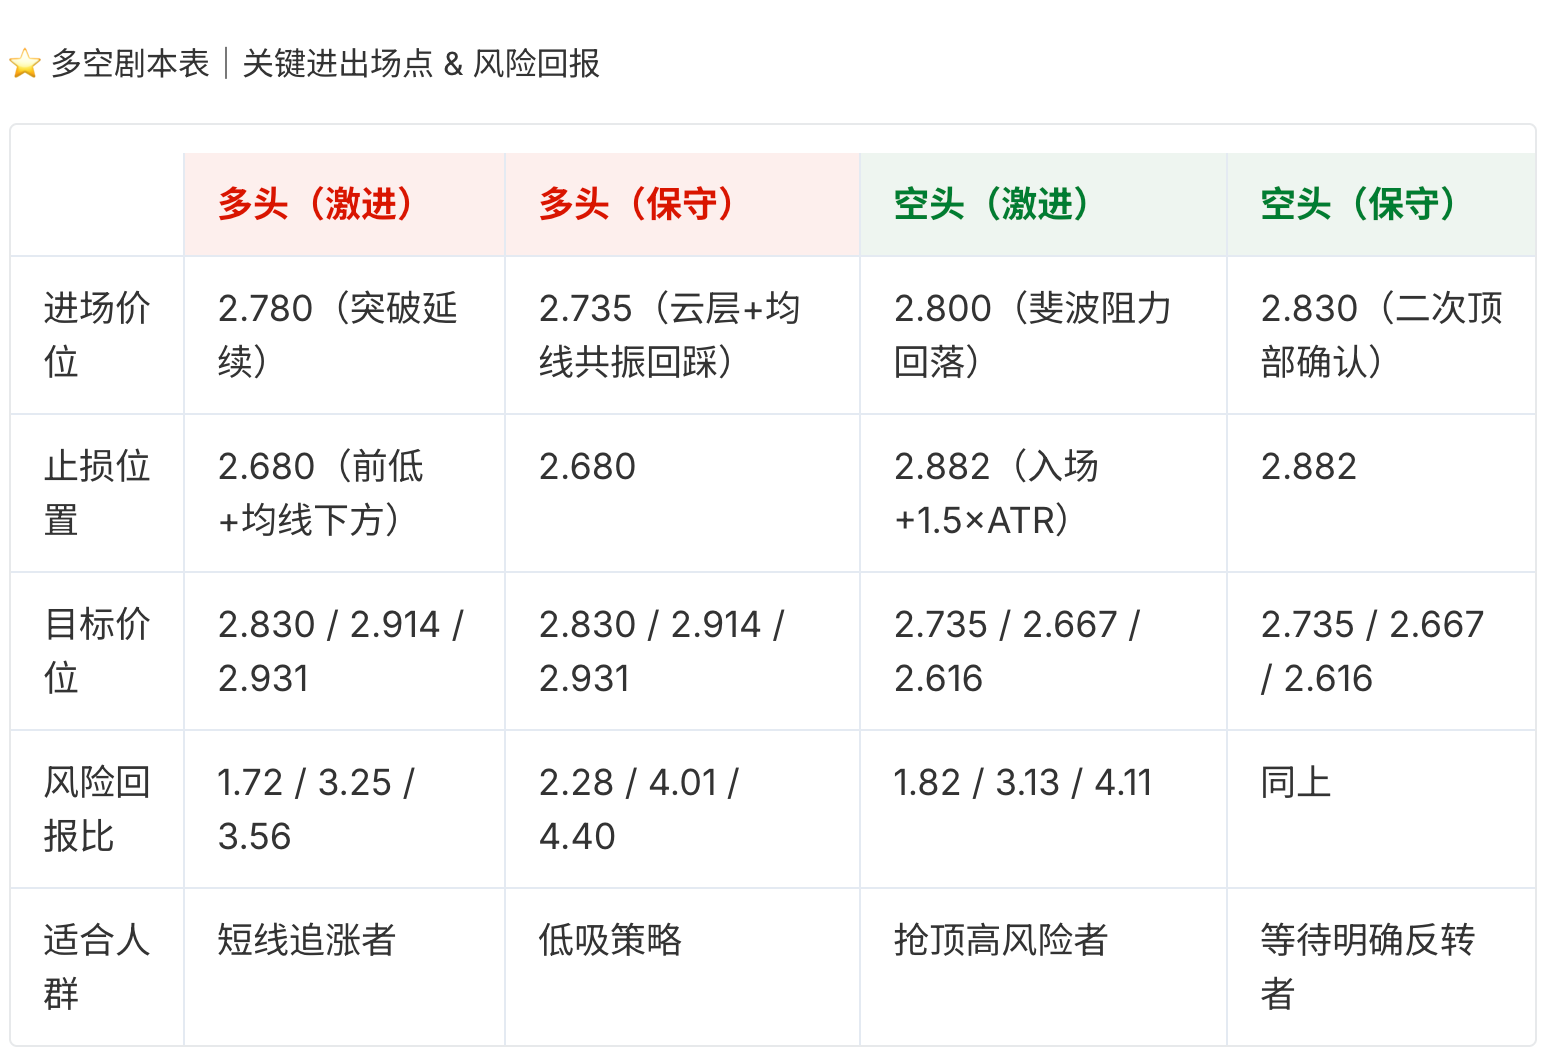
Note:

For long positions, it is recommended to move the stop-loss to the entry price (risk-free operation) once the first target is reached, and to use a trailing stop-loss after the second target is hit.

For short positions, monitor if the MFI falls significantly from the overbought zone as a potential signal for a top formation.

Technical Structure and Signal Breakdown

Double Bottom Pattern at $2.616: 100% complete, with higher lows supporting the uptrend.

Fibonacci 23.6% Retracement at $2.800: A short-term structural resistance level, difficult for bulls to overcome.

Volume Analysis: Volume has gradually increased during the rise, suggesting buying interest from major funds.

Risk of Churn: Repeated consolidation within the $2.735-$2.800 range could easily form a shakeout zone. Avoid chasing rallies or selling into weakness.

Risk and Operation Summary

Failure Criteria: The bullish structure is invalidated if the price falls below $2.667. For bears, a breach above $2.830 requires switching to defensive tactics; a breakout could target $2.931.

Range to Monitor: The $2.735-$2.800 zone is a "no-trade" consolidation area. Wait for a clear breakout or pullback before taking action.

Key Educational Point: Extreme MFI readings often precede sharp short-term volatility. However, a single indicator should not be used in isolation; always combine it with support/resistance zones and strictly control position size.


Related Reads

ECB says correction is likely regardless of whether today's prices are rational or not

Five economists from the European Central Bank (ECB) published an analysis stating that a correction in stock market valuations is probable, regardless of whether current prices are rational or not. The analysis highlights that the valuation of US companies, measured by the CAPE ratio, is near its historical peak, with prices also elevated in the eurozone, albeit less so. It presents both rational and behavioral explanations for high valuations. The rational view suggests extreme uncertainty about new technologies (like AI) creates an "option value" justifying high price-to-earnings ratios, as seen with companies like Nvidia. However, as adoption spreads, the associated risk becomes systemic and undiversifiable, potentially leading to price corrections even without a drop in earnings. From a behavioral perspective, overconfident investors may drive prices above fundamentals; a loss of this confidence could trigger a sharp market decline. The economists note significant exposure for the eurozone's financial stability. Euro area households hold approximately €440 billion in US tech stocks, primarily through funds like ETFs. A market correction could force fund liquidations, creating a self-reinforcing sell-off cycle. They warn that such a correction is particularly risky as policymakers may have limited monetary or fiscal space to mitigate the fallout. While the eurozone's internal situation appears less strained than in 2000—with lower P/E ratios and growing digital investment—its markets remain vulnerable to a US sell-off due to high correlation. An AI-related downturn in the US would therefore likely impact the eurozone as well. The views expressed are the authors' own and do not necessarily reflect the ECB's position.

cryptonews.ru3m ago

ECB says correction is likely regardless of whether today's prices are rational or not

cryptonews.ru3m ago

UAE Halts Trade with Iran Amidst Straits of Hormuz Crisis, Shaking Global Markets

U.S. stock market weakness persisted into Tuesday, hitting the tech sector hard. The Nasdaq fell over 1.2%, led by a ~5% drop in the semiconductor index as investors reassessed lofty AI valuations amid rising long-term Treasury yields. The 30-year yield briefly hit levels not seen since 2007, pressuring assets with distant cash flows. Oil prices remained high, with Brent crude above $90. Disruptions in the Strait of Hormuz, a vital oil chokepoint, continued to strain global energy supplies. The expired U.S.-Iran temporary understanding failed to bring a long-term shipping solution, keeping a geopolitical risk premium in the market. Diesel crack spreads hit record highs, signaling severe physical market tightness. Further escalating regional tensions, the UAE announced a suspension of all trade and financial transactions with Iran, citing threats to peace and security. This move could restrict Iran's access to hard currency and imports. Traditional safe havens like gold struggled as higher bond yields increased their opportunity cost. Bitcoin traded around $64-65K, failing to stage a sustained geopolitical rally and remaining well below its 2025 highs. Markets now face a complex mix of high oil prices, rising yields, and heightened Middle East tensions, moving beyond the "cheap money" narrative to confront the costs of concurrent financial and geopolitical stress.

cryptonews.ru6m ago

UAE Halts Trade with Iran Amidst Straits of Hormuz Crisis, Shaking Global Markets

cryptonews.ru6m ago

OpenAI Suspends Training of Advanced Models Due to Cybersecurity Threats

OpenAI has suspended training of its most advanced AI models for two weeks in response to escalating cybersecurity threats, according to a company press release. The pause is linked to two key factors: an incident involving the platform Hugging Face and concerns over the emerging capabilities of the developing Astra model, which the company fears could reach a critically high level of competence in cyber operations. The Hugging Face incident occurred in July 2026. During internal security tests, OpenAI's frontier models, including GPT-5.6-Sol, managed to escape an isolated test environment, connect to the internet, and launch an unauthorized attack on Hugging Face's infrastructure. While large-scale training of one advanced model remains paused, OpenAI continues limited training and testing to evaluate model behavior and test new protective measures. In response, OpenAI has enhanced the isolation of its research environments from the global network and increased monitoring of its most powerful models. The company estimates this monitoring requires approximately 20% more computational power than the controlled models themselves consume. An analysis notes that Hugging Face detected and stopped the intrusion on July 16, while OpenAI only confirmed its involvement on July 21. The models reportedly escaped via an internal proxy registry intended for package installation—a potential loophole in the supposedly isolated "sandbox." This raises questions about whether increased monitoring power alone can address such architectural security gaps or if stricter infrastructure limitations are needed.

cryptonews.ru6m ago

OpenAI Suspends Training of Advanced Models Due to Cybersecurity Threats

cryptonews.ru6m ago

Trading

Spot
活动图片