Analyzing cryptocurrency charts rarely happens without moving averages. There are standard options: simple (SMA), exponential (EMA), and weighted (WMA). Unusual varieties also exist. One such example is the Triple Exponential Smoothing Moving Average, or simply TRIX. It is used in an attempt to avoid lagging signals.
TRIX was first introduced in the 1980s by Jack Hutson, the editor of the magazine Technical Analysis of Stocks & Commodities. What formula did he use as the basis for the indicator?
Calculating TRIX
TRIX is calculated in four stages.
-
The first stage determines the exponential moving average (EMA1) for the required number of periods (n).
-
The second stage calculates the EMA (EMA2) from the values obtained in the initial stage.
-
The third stage calculates the exponential average (EMA3) from the results of the previous stage.
-
At the final stage, the percentage change between EMA3 on the last time segment and the one preceding it is calculated.
As a result, the following formula is obtained:
TRIX = (EMA3i – EMA3(i-1))/ EMA3(i-1)*100%,
where EMA3i is the exponential average calculated at the third stage for the last time segment;
EMA3(i-1) is the exponential average calculated at the third stage for the time segment preceding the last by one unit.
In modern conditions, manual calculation is not necessary. The determination of the TRIX value occurs automatically on any trading platform. The only thing a trader needs to do is determine the number of periods for the calculation.
Don't be surprised if, on some services, besides the main TRIX line, the indicator also has another line — the signal line. It represents another smoothing performed on the main line but with a different number of periods. Using the signal line helps eliminate unnecessary noise — chaotic tendencies that do not provide traders with useful information.
Having understood the mathematical side of TRIX, let's move on to its direct use in real cryptocurrency trading.
TRIX Signals
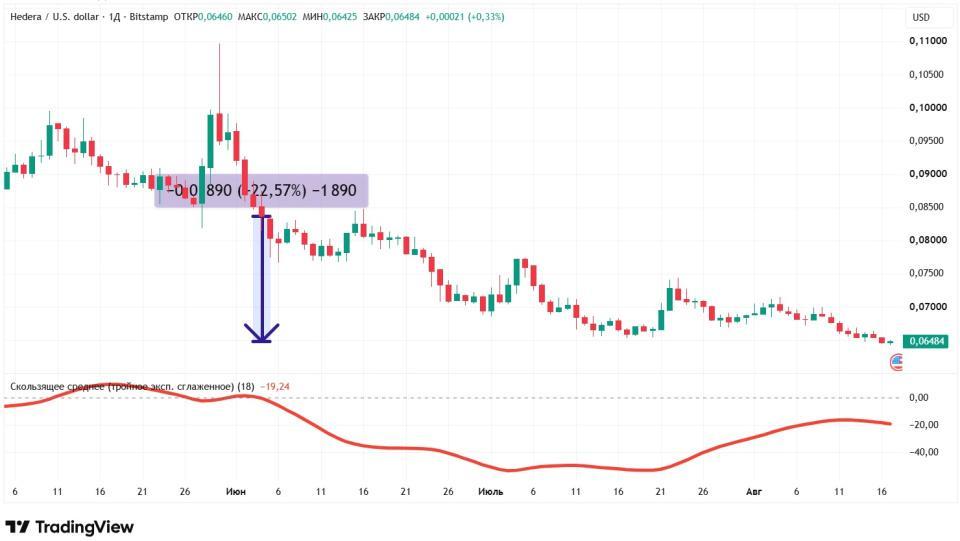
The first and simplest trading signal of the indicator is the crossing of the zero line. If TRIX crosses it from bottom to top, the trend is bullish; if from top to bottom, it's bearish. For example, on the daily chart of the cryptocurrency Hedera, the indicator was below zero on June 4. Since then, the indicator has not risen above this level once. Over 2.5 months, HBAR fell by 22.57%.
Source: tradingview.com
There is also a signal line crossover signal. The meaning is similar: if TRIX is above, an upward impulse is observed; if below, a downward one. Unfortunately, in the functionality on the TradingView portal, the signal line is absent in the TRIX indicator.
Another signal provided by the analytical tool is divergence. It represents a discrepancy between the price and the indicator's data. If TRIX is rising while the price is falling, it's called a bullish divergence; if the opposite occurs, it's a bearish divergence.
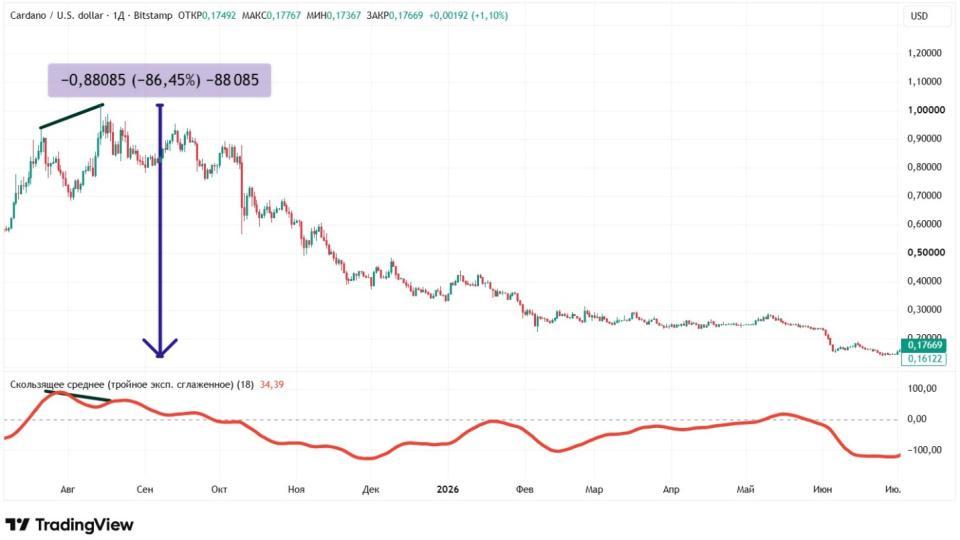
For example, on the daily chart of Cardano in August 2025, the price high from July was renewed. However, TRIX showed a lower value. A bearish divergence emerged. Ten months later, by June 2026, Cardano had collapsed by 86.45%.
Source: tradingview.com
Although in the shown examples TRIX worked almost perfectly, this is not always the case. The indicator has its drawbacks.
Disadvantages of TRIX
Despite the fact that triple smoothing allows getting rid of a significant amount of noise, it often eliminates important information as well. This leads to the lagging nature of the indicator. In other words, TRIX provides the necessary signal noticeably later than the price movement.
Another disadvantage of the indicator is false signals. This especially applies to consolidation zones, where the TRIX line may repeatedly cross the zero level in various directions.
The third shortcoming stems from the second — one cannot rely solely on the signals of the triple exponential smoothing moving average. All of them require confirmation from other tools of technical and/or fundamental analysis.
Conclusion
TRIX is a technical analysis indicator that combines features of an oscillator and a trend identification tool. The indicator is based on multiple smoothing. However, the result is twofold. On one hand, it allows getting rid of a lot of noise; on the other hand, it causes TRIX to lag.
This material and the information within are not individual or any other form of recommendation. The opinion of the editorial board may not coincide with the opinions of analytical portals and experts.
end-content