dogwifhat jumps 16% – but massive resistance stands in WIF’s path to more gains

ambcryptoPublished on 2026-06-28Last updated on 2026-06-28

Abstract

Dogwifhat (WIF) surged 16% in 24 hours, marking a potential rebound after a 38% year-to-date decline. However, the rally faces a major obstacle: a persistent descending resistance line that has rejected price advances three times previously. While key indicators like Accumulation/Distribution and the Money Flow Index signal strong buying pressure and capital inflow, WIF must achieve a confirmed breakout and close above this resistance to sustain its upward momentum. Additionally, liquidation data suggests limited near-term upside and room for further downside. The token's outlook hinges on decisively overcoming this key technical barrier.

dogwifhat [WIF] is staging a comeback after spending most of the year subdued, with the memecoin down 38% on a year-to-date basis yet up 16% over the past day.

Market analysis shows that a stronger rally could still take shape once the asset overcomes the key structural level that could keep its price from staging a surge.

A descending resistance line caps WIF’s rally

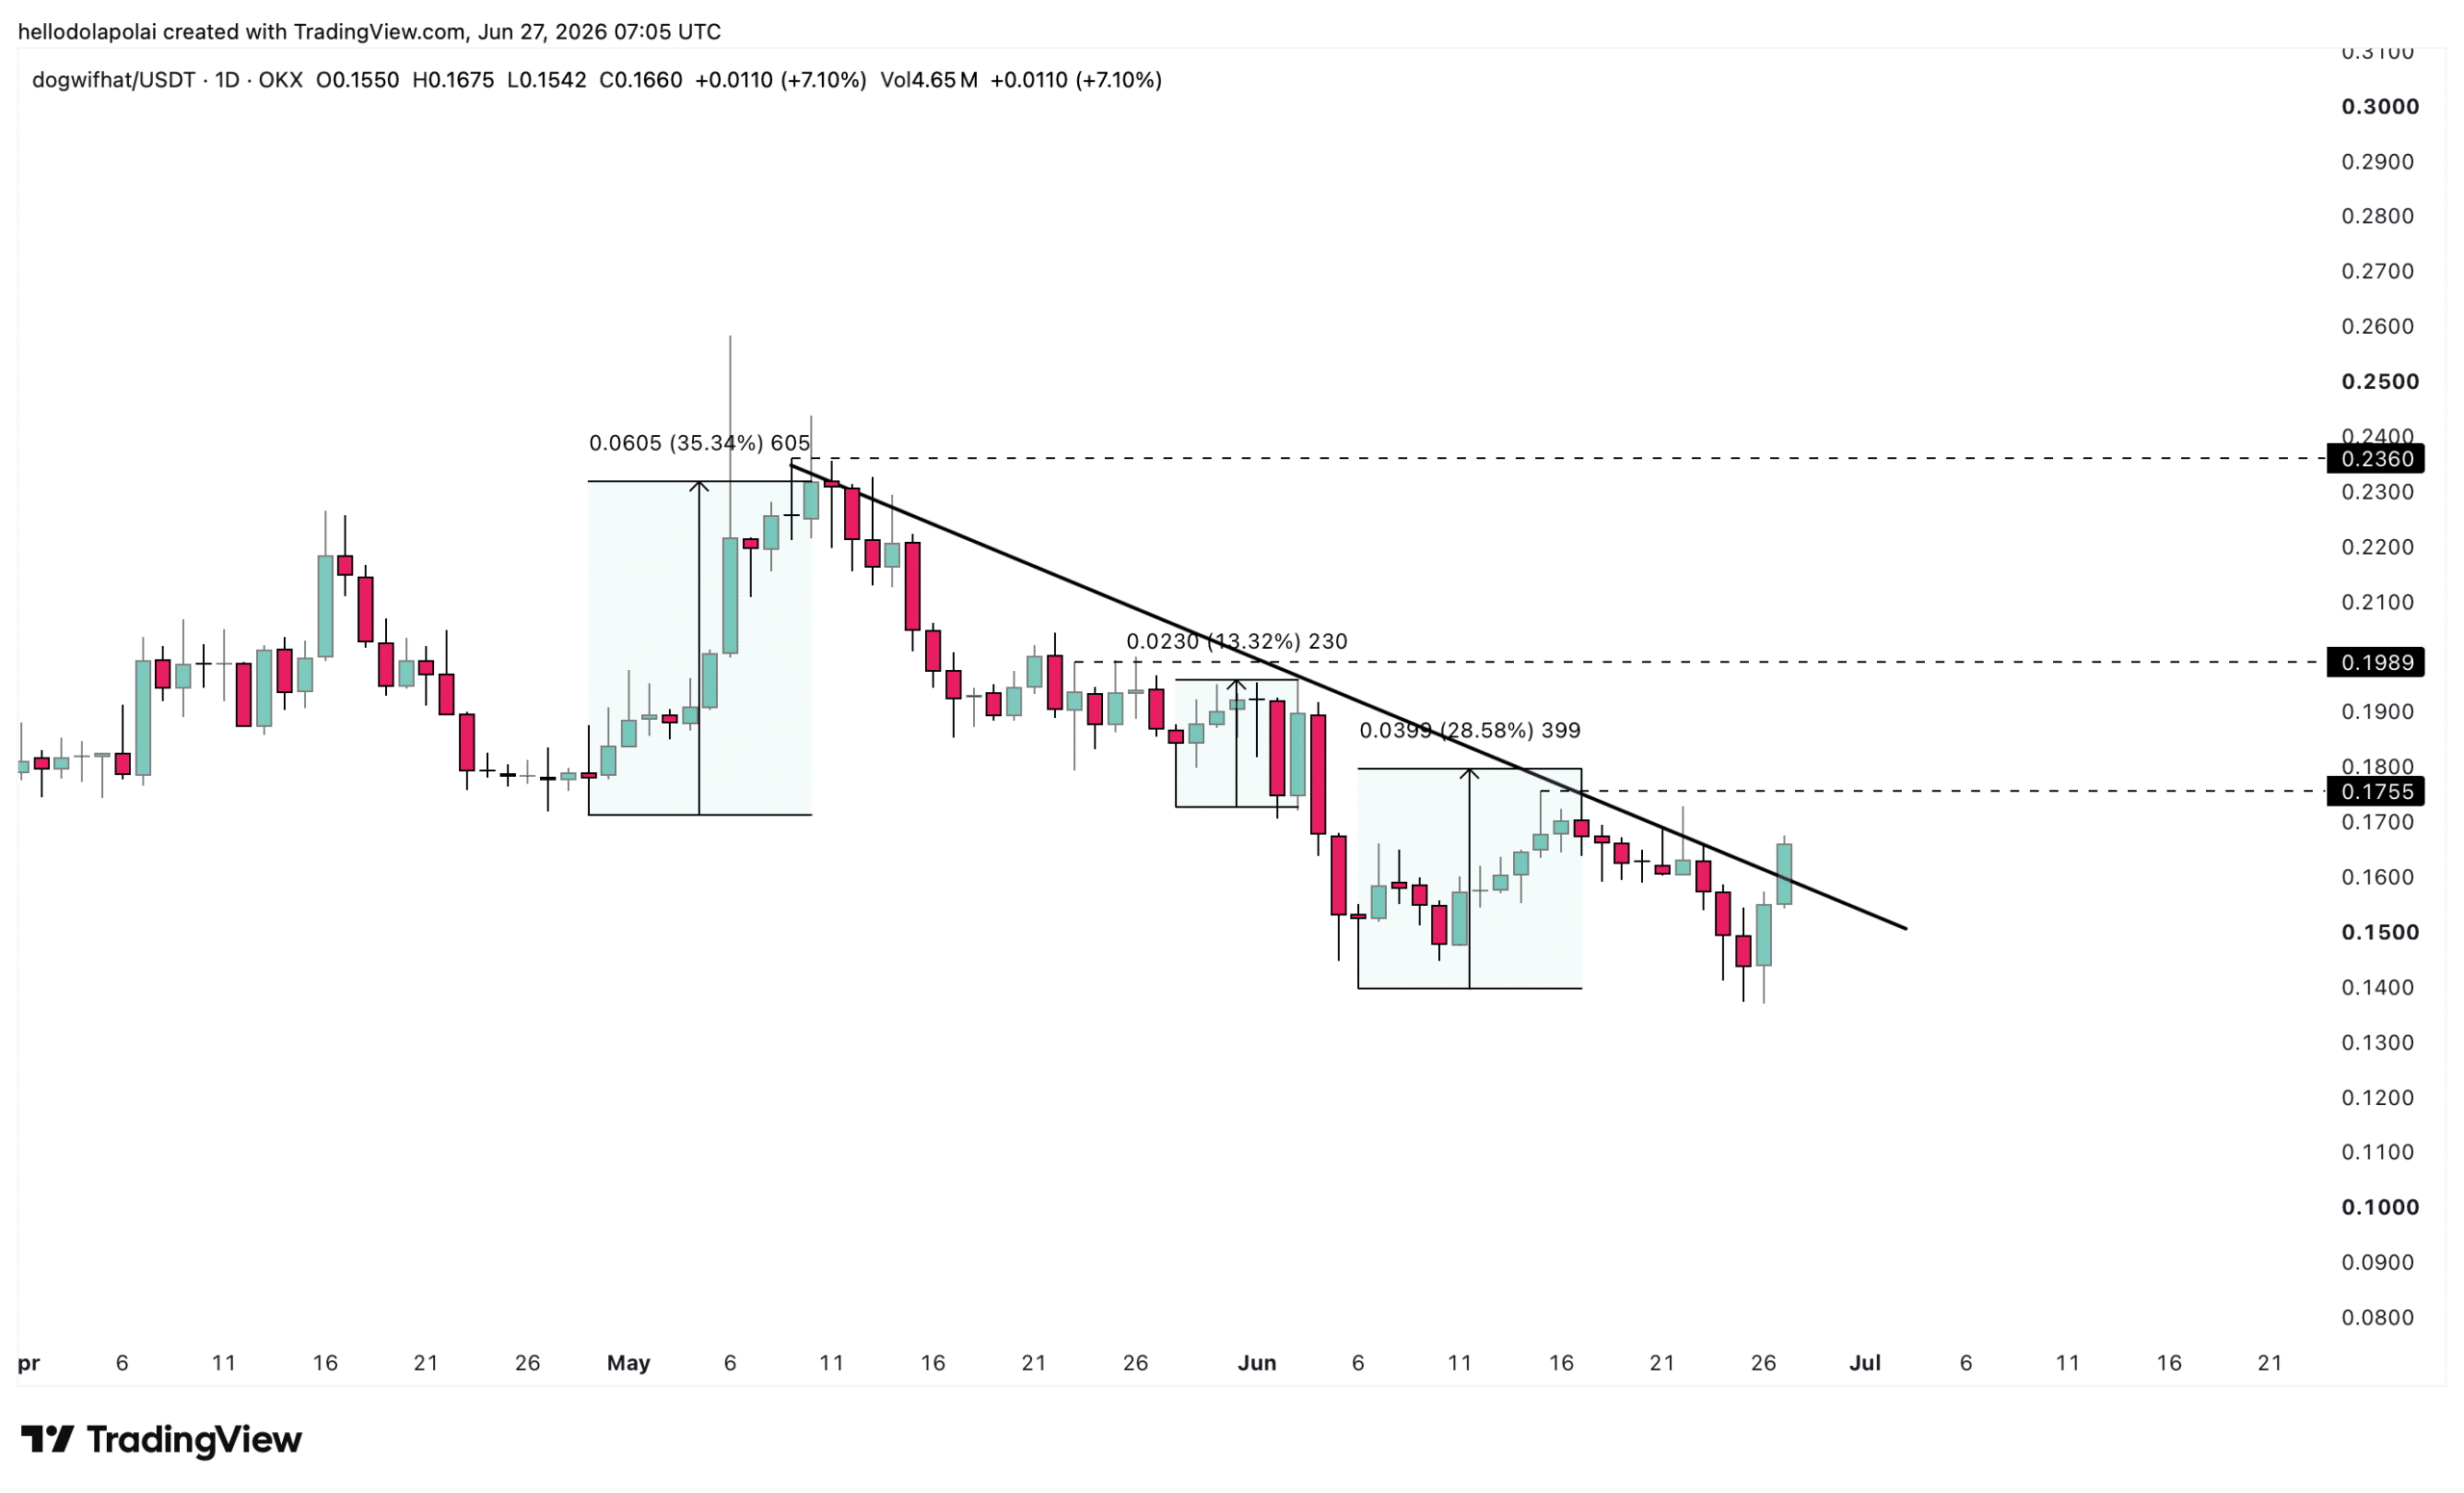
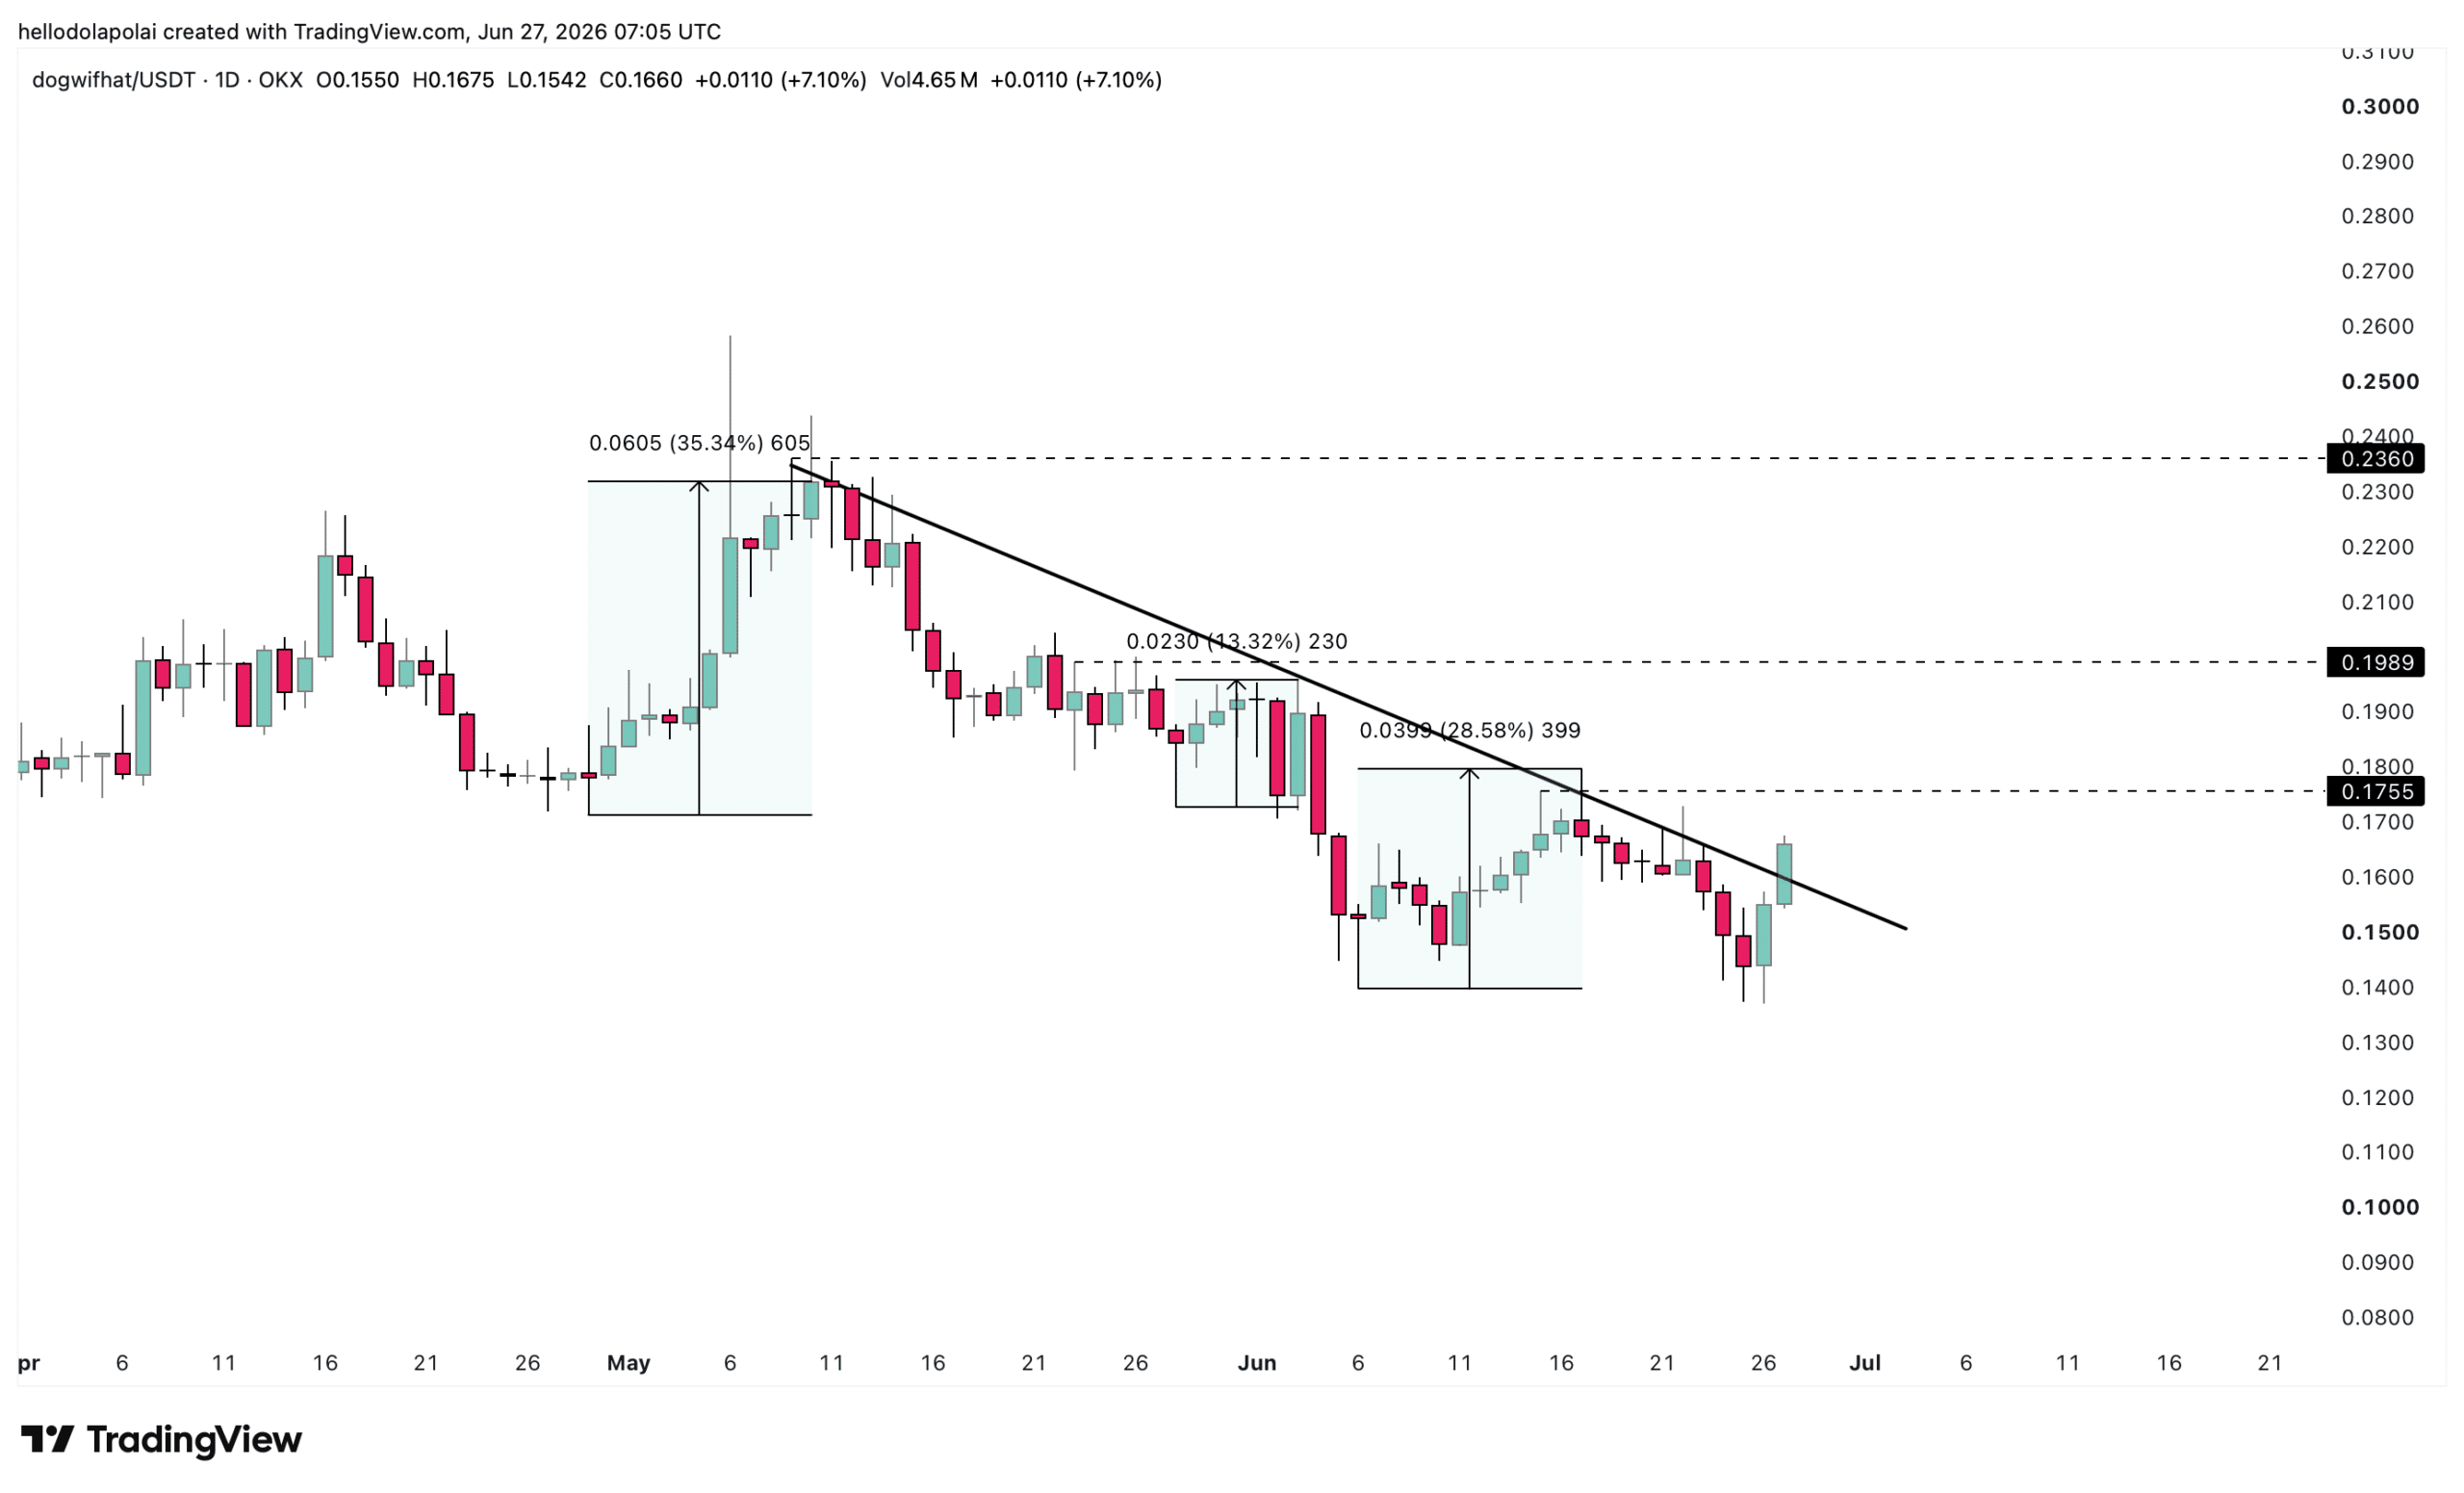
The major obstacle standing between WIF and a sizeable rally remains the descending resistance line that price has only marginally crossed.

The breakout cannot be confirmed as bullish yet. WIF’s price has not closed above the descending line, nor has it continued along the bullish path it began carving out days earlier.
Source: TradingView

For context, this same resistance has repeatedly capped WIF’s advances and forced the token to trade lower thrice in a row, even though each run leading into the level delivered double-digit gains.

A failure to push higher would leave WIF trudging beneath the resistance line for an extended period, adding to the 48 days it has already spent trading below this barrier.

Capital and buying indicators back WIF

WIF stands a strong chance of a major upswing, with the key indicators that track capital flow and buying activity all pointing in the same direction.

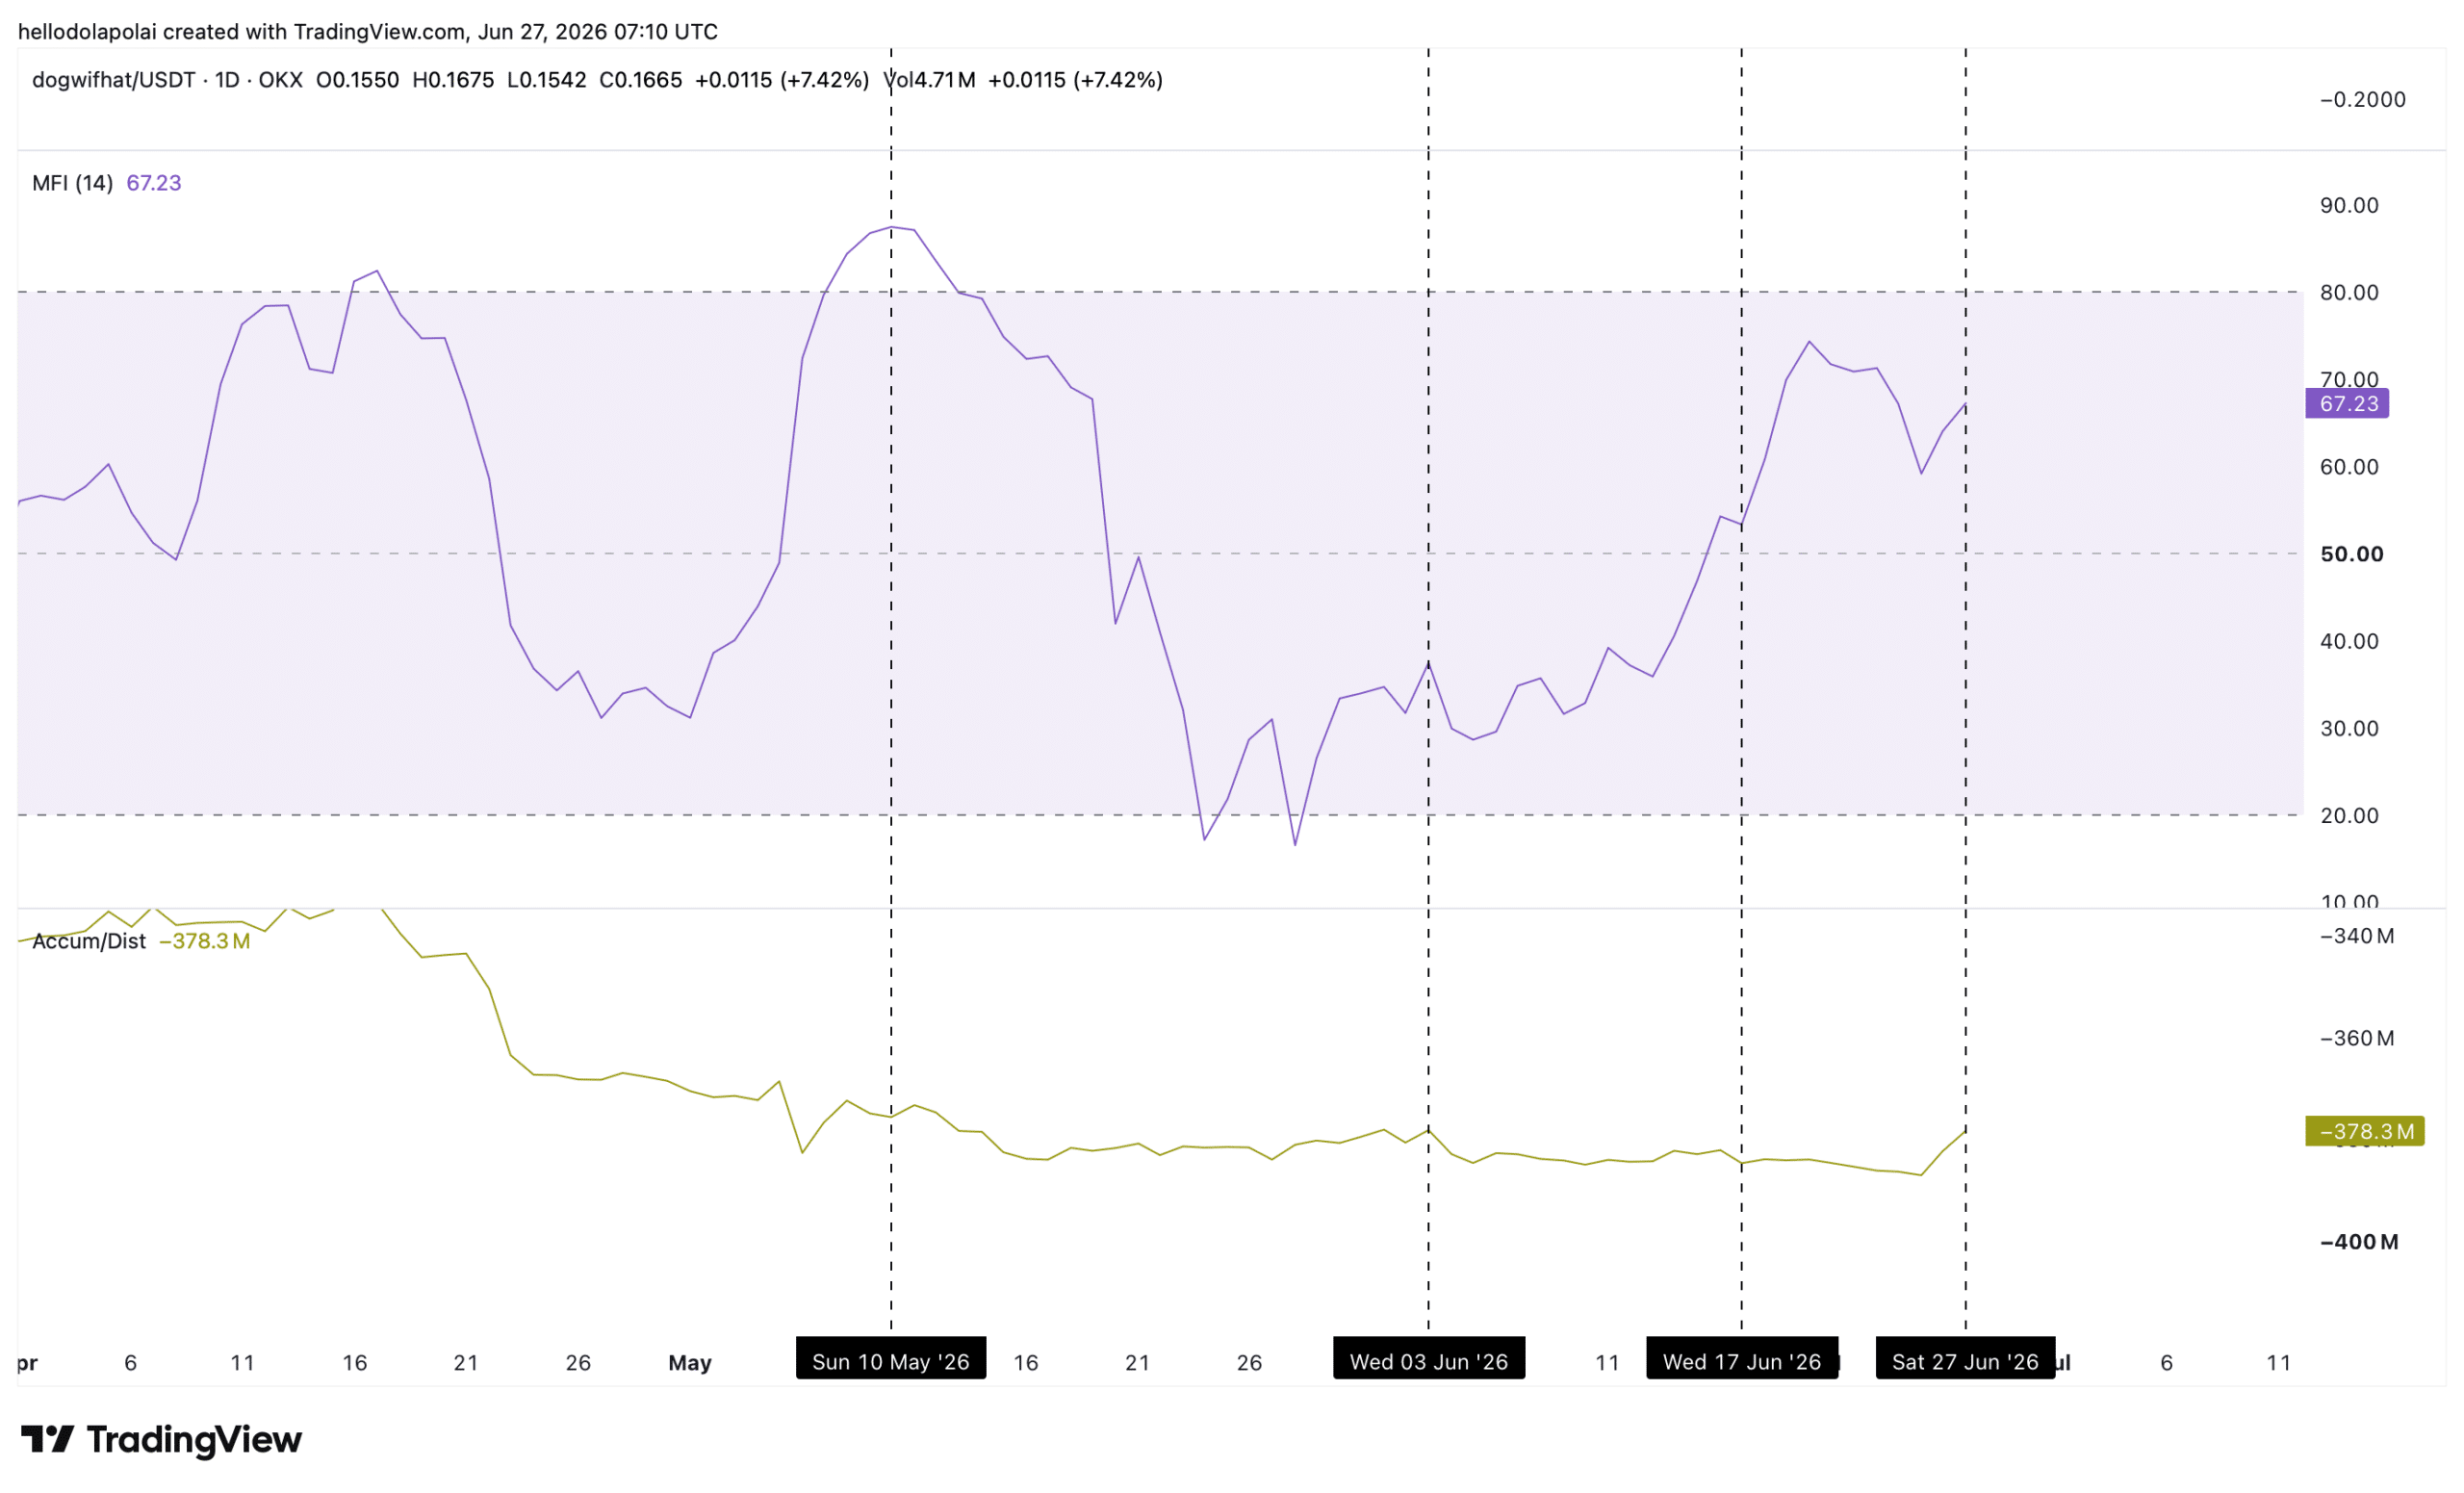
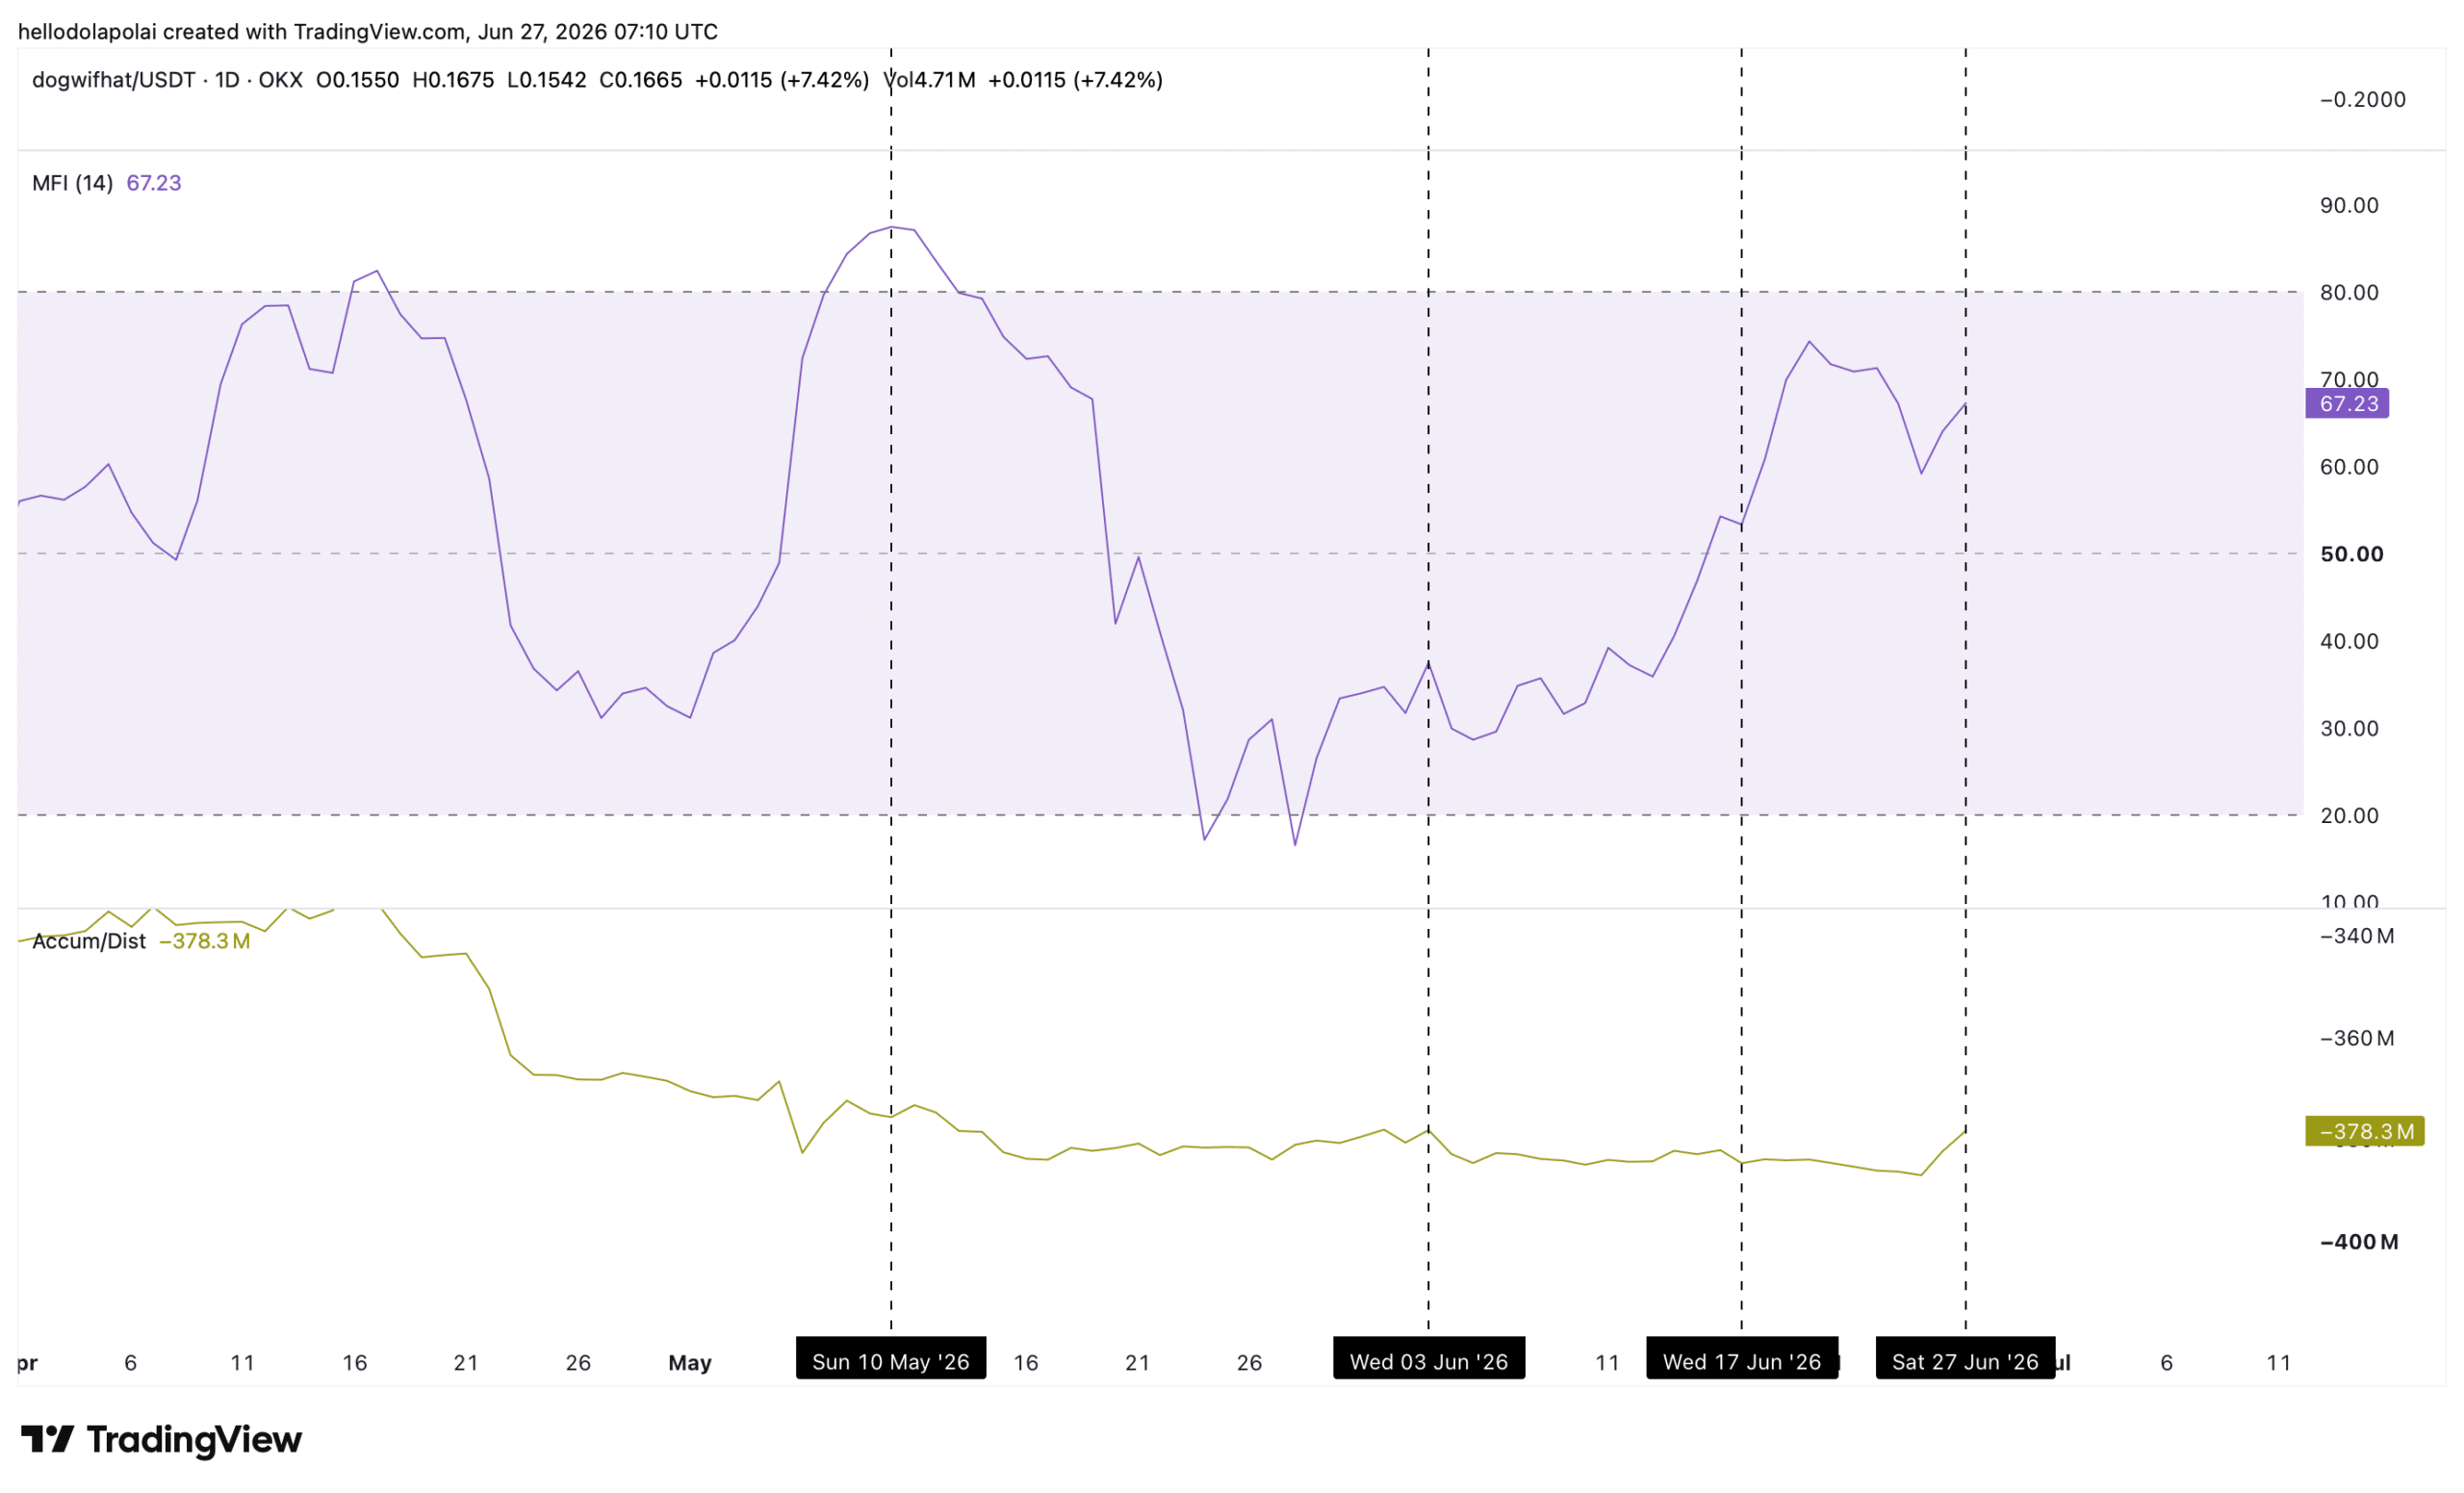
The accumulation/distribution indicator is showing a powerful upswing, which implies sustained buying, while total volume has settled at around 378 million WIF traded over the past 24-hour window.

Adding to this, the money flow index—which measures the movement of capital into and out of an asset—is surging upward at a reading of 67, signaling that more capital has flowed into WIF. More importantly, that reading sits in the bullish zone above 50, suggesting investors are actively buying.
Source: TradingView

The pattern worth noting appears at the vertical lines marking the points where price failed to breach the resistance mentioned earlier, where both indicators rallied into the level together—unlike previous instances in which one indicator rose while the other lagged, or one sat in overvalued territory.

A continued upward move would meaningfully reshape the outlook for WIF, since it would confirm a close above the resistance and establish a sustained bullish pattern.

Liquidation clusters limit WIF’s upside

The liquidation chart shows that WIF’s possible upside is limited, based on the arrangement of its clusters, which mark the levels where unfilled orders sit.

The downside below the current price level extends even further, suggesting WIF could still fall well beneath its present position despite the bullish momentum on display.

An important caveat applies here, as the liquidation heatmap offers only a glimpse rather than an extended view across a broader price spectrum. That leaves it unknown whether more buy orders sit beyond what the chart currently displays.


Final Summary

  • WIF has bounced 16% in a day after a rough year down 38%, and the signals that track buying activity suggest investors are stepping back in.
  • The rally isn’t safe yet, as WIF still needs to firmly clear a price ceiling that has rejected it three times before, and there’s room for it to slip lower first.

Related Questions

QWhat is the current short-term performance of the dogwifhat (WIF) token mentioned in the article?

AAccording to the article, dogwifhat (WIF) has jumped 16% over the past day.

QWhat is identified as the major obstacle preventing WIF from a stronger rally?

AA descending resistance line is identified as the major obstacle. The price has not confirmed a bullish breakout as it hasn't closed above this line, which has rejected price advances three times before.

QWhat do the Accumulation/Distribution indicator and Money Flow Index suggest about buying activity for WIF?

AThe Accumulation/Distribution indicator shows a powerful upswing, implying sustained buying. The Money Flow Index is surging at a reading of 67, which is above 50, signaling that more capital is flowing into WIF and investors are actively buying.

QAccording to the article, what does the liquidation heatmap suggest about WIF's potential price movement?

AThe liquidation heatmap suggests that WIF's possible upside is limited by the arrangement of liquidation clusters. It also indicates that the downside below the current price level extends further, meaning WIF could still fall well beneath its present position despite the current bullish momentum.

QWhat two key points are summarized at the end of the article regarding WIF's outlook?

AFirst, WIF has bounced 16% with buying indicators suggesting investor interest is returning. Second, the rally isn't safe yet as WIF needs to firmly clear a key price resistance level that has rejected it three times, and there is room for the price to slip lower first.

Related Reads

Upbit is Anxious: A Hasty Counterattack Aimed at Regaining Stablecoin Market Share

Title: Upbit's Rushed Counterattack to Reclaim Stablecoin Market Share Facing a dramatic shift in South Korea's stablecoin market, leading exchange Upbit launched a promotional campaign from July 26 to August 9, waiving the 0.05% trading fee for stablecoins paired with the Korean Won (KRW) and rapidly listing new stablecoins like RLUSD and USDG. This move is a direct response to its plummeting market share in this sector. Historically a duopoly with Bithumb, the market has been reshaped since October 2025 when Coinone permanently removed fees for USDC trading. By June 2026, Coinone led with 34.8% of stablecoin volume, followed by Bithumb (31.1%) and Upbit (30.1%). This contrasts sharply with the overall crypto market, where Upbit commands 60%. The data shows stablecoin demand is highly sensitive to fees, as users primarily buy them to transfer capital overseas for derivatives trading or forex arbitrage. South Korean exchanges have seen a net outflow of stablecoins for 18 consecutive months, totaling approximately 14.9 trillion KRW, underscoring their role as a cross-border capital conduit. Upbit's limited-time promotion initially boosted its daily stablecoin volume by 162%, but the surge was almost entirely in USDT (98.1% of volume). The newly listed stablecoins saw negligible, fleeting interest. Furthermore, the promotional effect quickly waned in the second week, with volume dropping 33% on weekdays. A concurrent weakening of the KRW also contributed to the trading spike, independent of the fee waiver. The analysis suggests that once the promotion ends, Upbit is unlikely to retain its temporary gains unless it matches Coinone's permanent zero-fee policy, forcing a choice between market share and fee revenue. Upbit's strategic push may be less about immediate profit and more about preparing for future regulatory shifts. With South Korea's *Digital Asset Basic Act* on the horizon, which will regulate KRW-backed stablecoins, and following Dunamu's (Upbit's parent) integration into Naver Financial to build a payment ecosystem, securing a dominant position in the dollar stablecoin distribution channel holds long-term strategic value. However, potential regulatory conflicts could prevent Upbit from listing a future Naver-issued KRW stablecoin, making the current fight for dollar stablecoin flow even more critical.

marsbit1h ago

Upbit is Anxious: A Hasty Counterattack Aimed at Regaining Stablecoin Market Share

marsbit1h ago

Michael Saylor Compares Bitcoin and Gold!

Michael Saylor, founder of MicroStrategy, argues that Bitcoin fundamentally changes how wealth is stored and transferred by transforming digital scarcity into economic value. He describes Bitcoin as the first digital monetary network, combining computers, digital networks, and cryptography. It digitizes monetary assets, allowing their supply to be controlled by public protocols rather than institutions, thus converting economic value into information transmissible over global networks. Comparing Bitcoin to gold, Saylor states that while increasing Bitcoin's supply is harder, its integration with software and transfer is easier. He highlights Bitcoin's proof-of-work mechanism, which ties it to the physical world by consuming real energy to secure the ledger, making past transactions immutable. This creates a shared security system involving miners, energy companies, and investors. Saylor suggests "digital monetary energy" is a more accurate term than "digital gold." He emphasizes that the Bitcoin network is an adaptive ecosystem of miners, nodes, developers, and users. Its core design is intentionally simple, focused on maintaining a secure ledger for scarce digital assets, with complex functionalities built in higher-layer applications. This architecture allows Bitcoin to serve as a foundation for transmitting value and fostering innovation in payments and financial services. Saylor notes Bitcoin's deeper impact lies in creating digital sovereignty, where private keys give individuals permissionless control over their economic power, with ownership verified mathematically, not by institutions. He concludes that while gold's physical scarcity makes it money, Bitcoin's digital scarcity does the same, characterizing Bitcoin as the monetary energy of the digital age.

cryptonews.ru2h ago

Michael Saylor Compares Bitcoin and Gold!

cryptonews.ru2h ago

Trading

Spot
活动图片