Monad eyes all-time high: Accumulation surges as MON bulls test key resistance

ambcryptoPublished on 2026-04-09Last updated on 2026-04-09

Abstract

Monad (MON) has surged 13% in 24 hours, emerging as a top market performer. The rally is supported by strong accumulation, with the Accumulation/Distribution indicator and Money Flow Index (MFI) both trending upward, indicating sustained buying pressure and capital inflows. However, the price faces a key resistance zone, and the Bollinger Bands suggest MON is overbought, signaling potential for a short-term pullback. Breaking this resistance is crucial for a sustained upward move toward its all-time high, which would require a 56% increase and an additional $851 million in market capitalization. This depends on continued bullish sentiment across spot and futures markets, as well as broader crypto market stability.

Monad [MON] could rank among the market’s top gainers if bullish strength persists, especially as the asset posts a 13% gain over the past day, placing it among the leading performers in the crypto market over the last 24 hours.

However, the rally still faces a major obstacle, as price trades within a resistance block expected to cap further upside. The key question is whether Monad can break above this level and open a path toward its all-time high.

Monad rallies on the back of accumulation

The recent surge in accumulation has supported MON’s upward momentum, and current indicators suggest that this trend may not slow down soon.

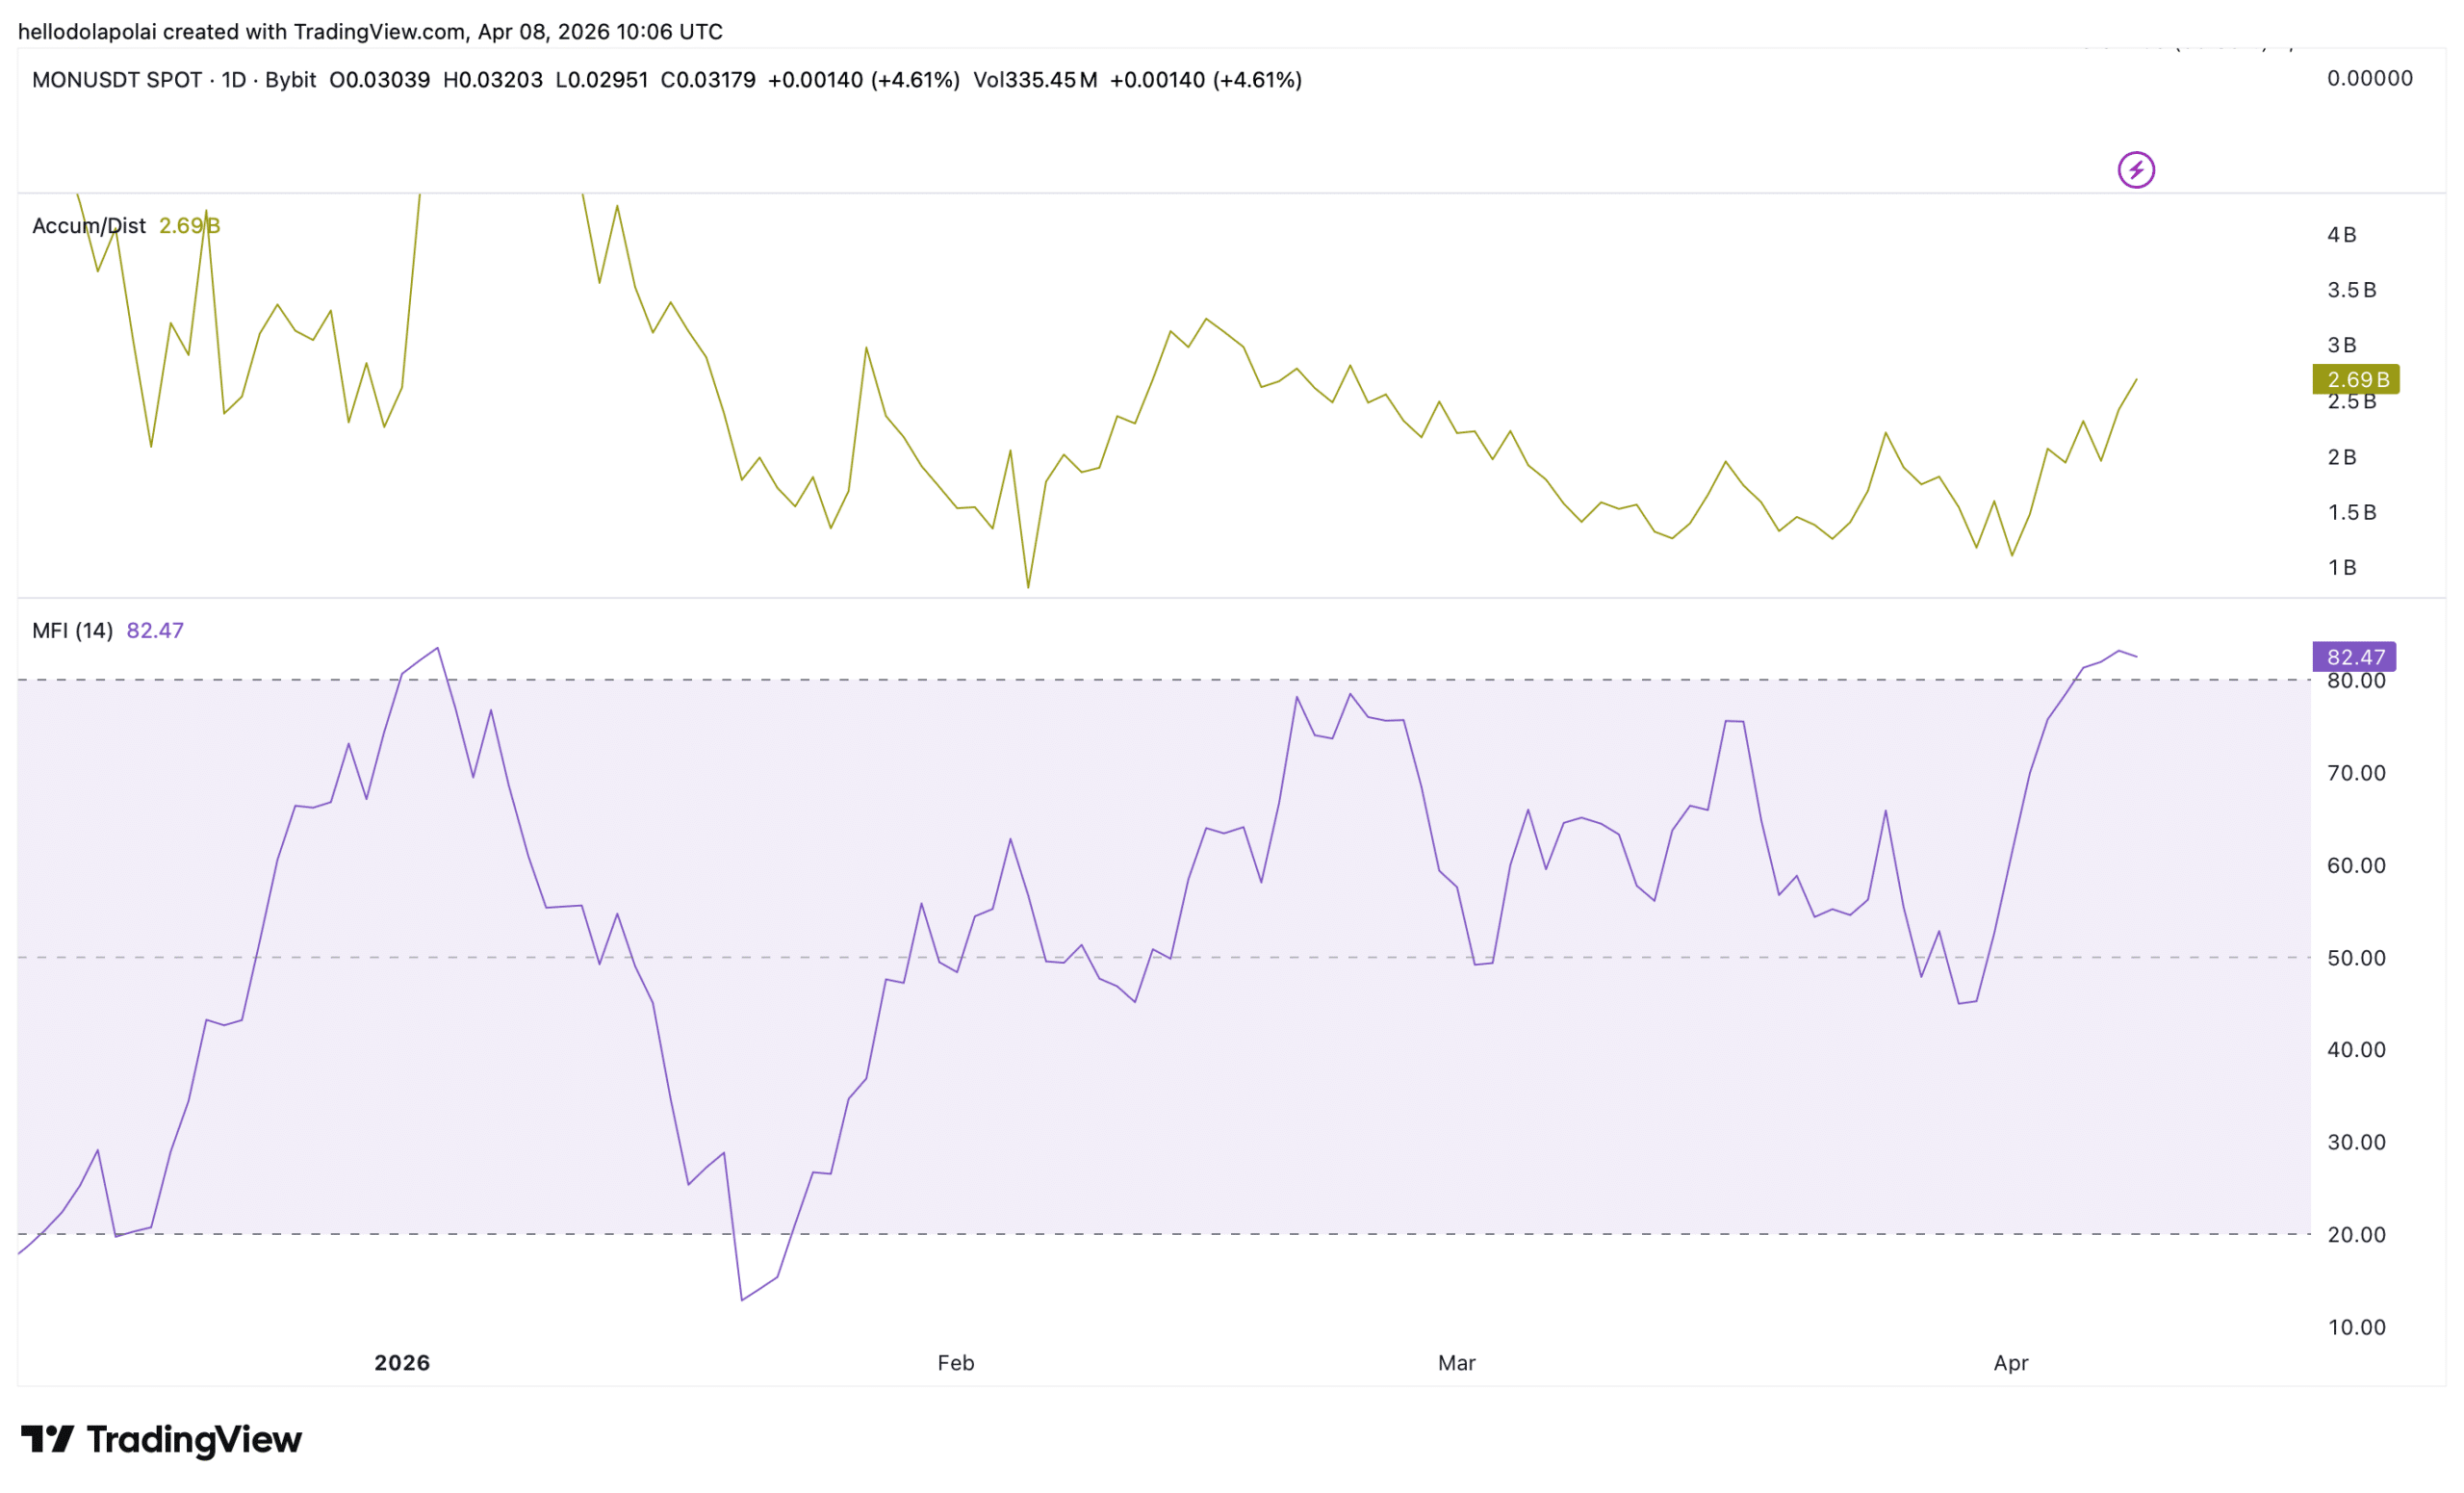
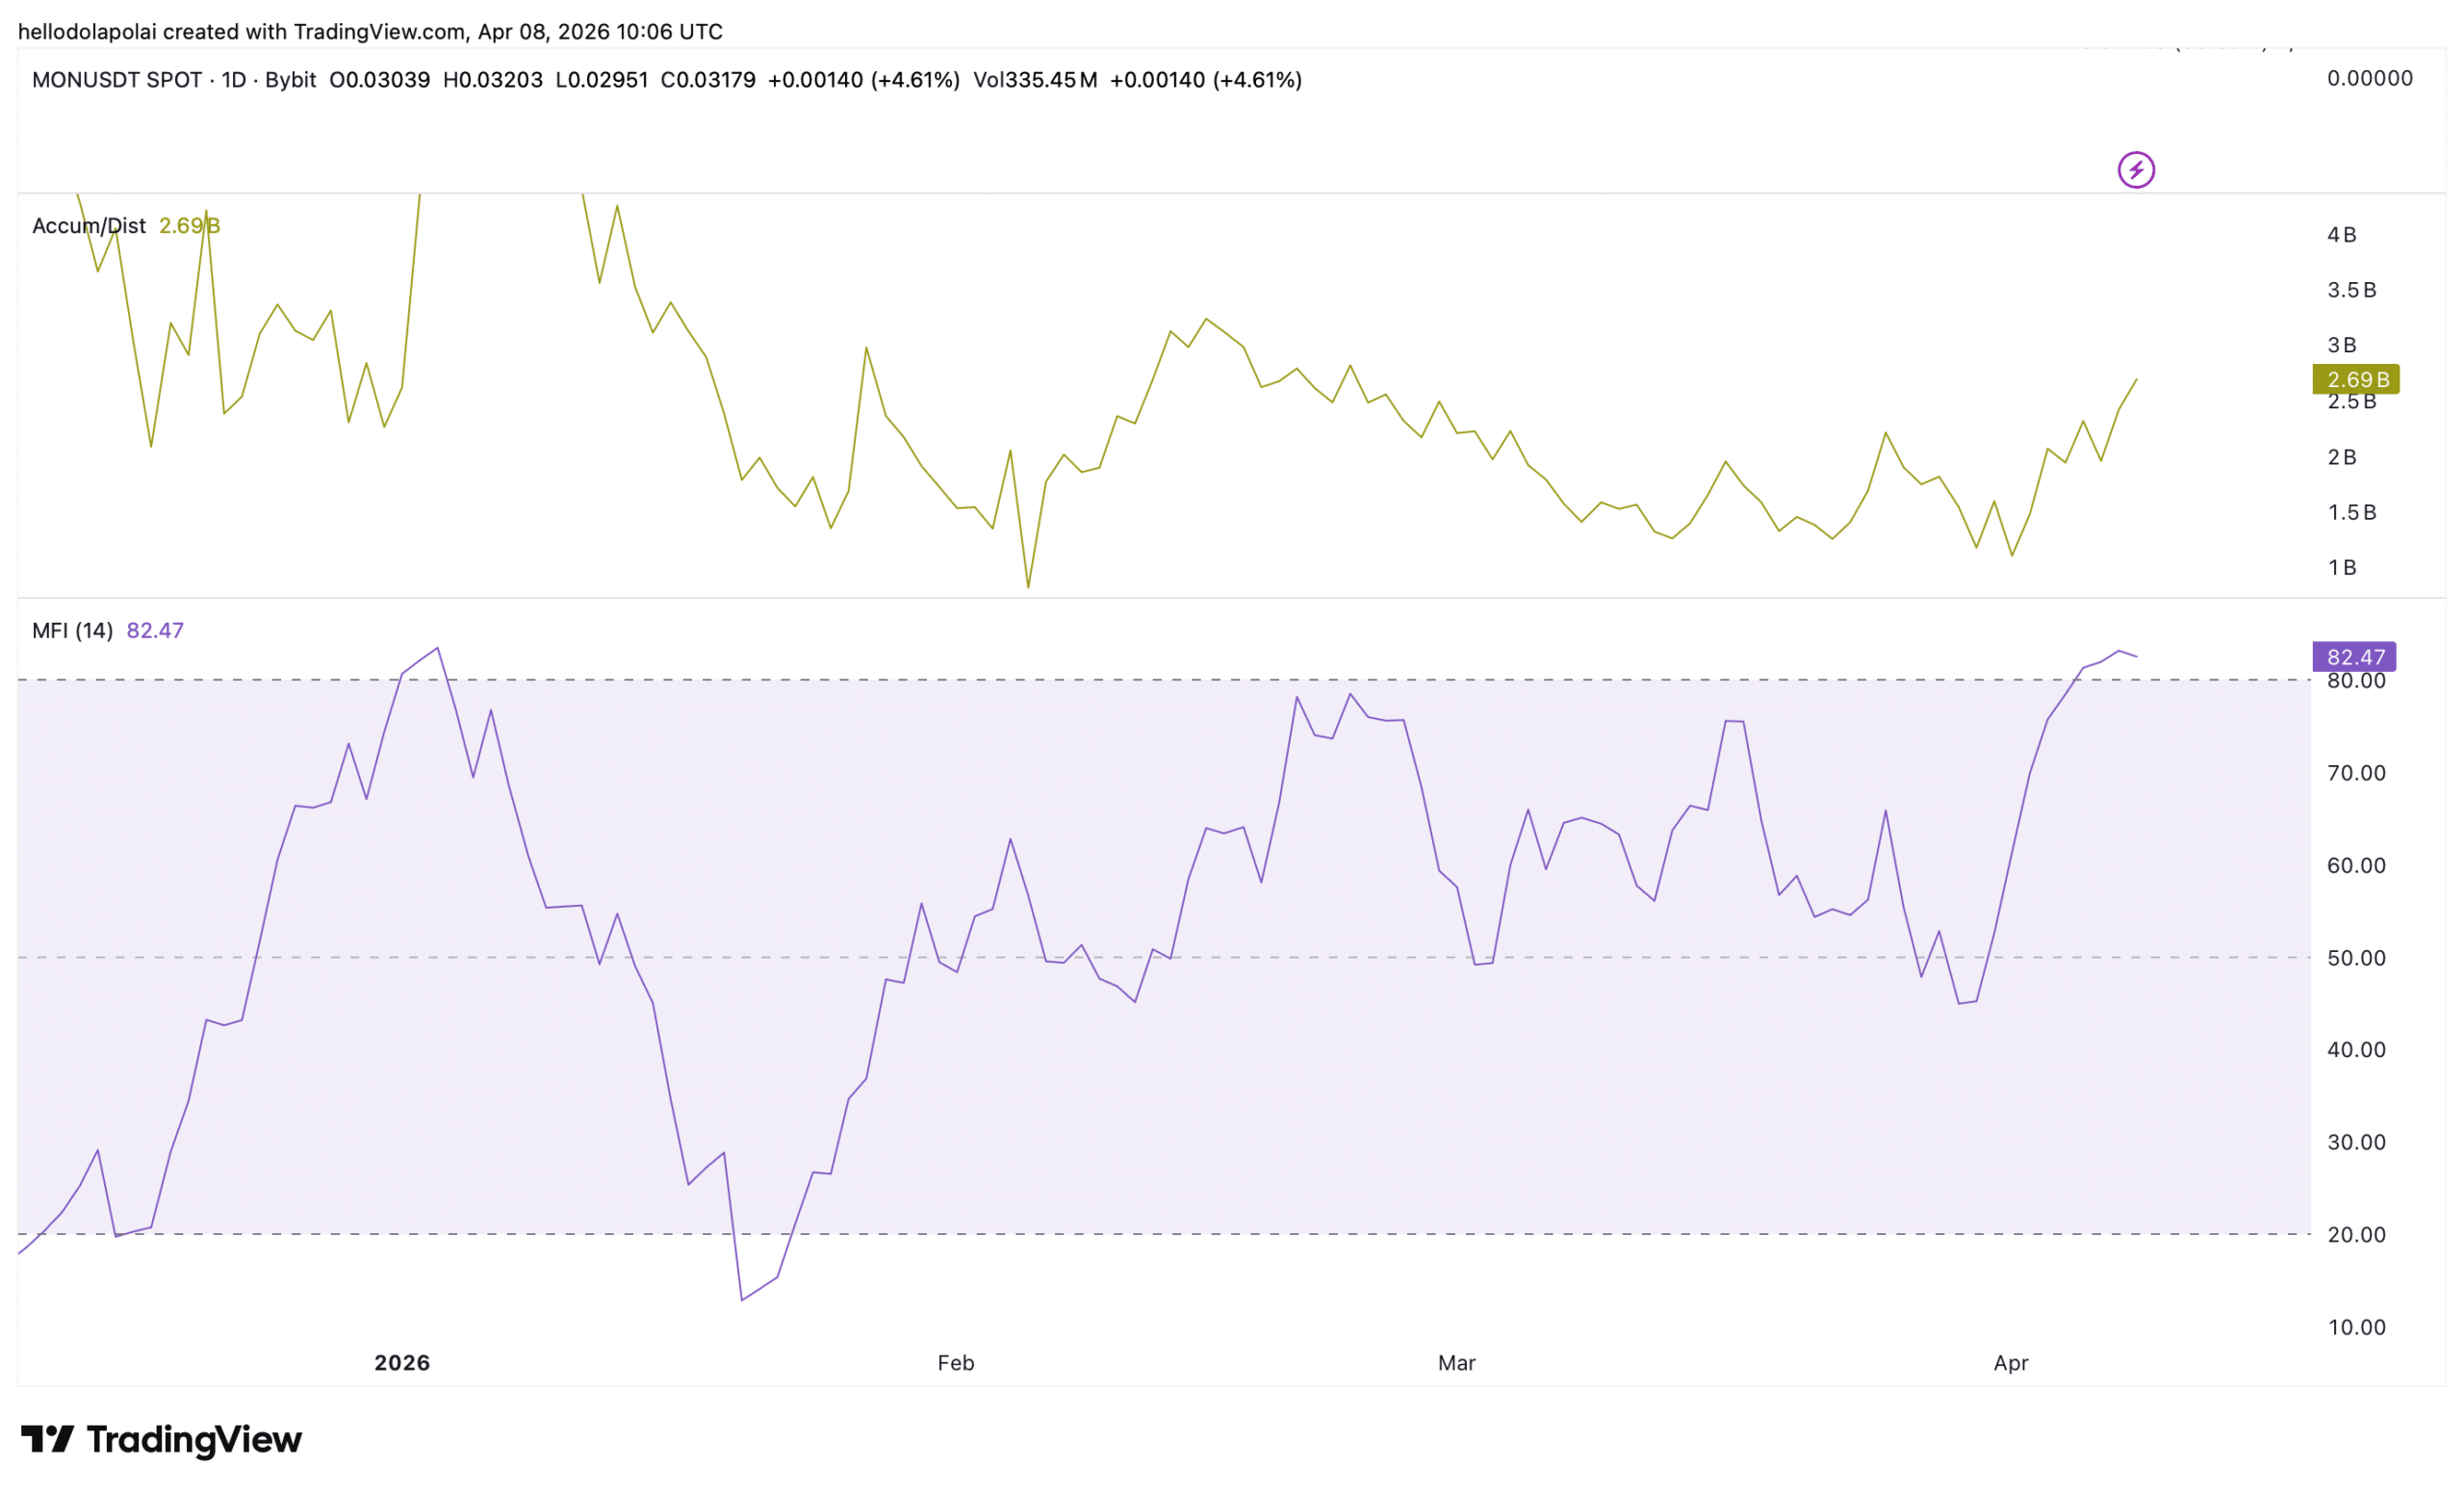
The Accumulation/Distribution indicator continues to trend higher, showing that as price increases, investors keep buying. Trading volume has also strengthened, exceeding 2.69 billion over the past day.

Accumulation tells only part of the story. The Money Flow Index (MFI), which tracks capital inflow and outflow, also indicates stronger inflows over the same period.
Source: TradingView

The MFI remains slightly above the 80 level and trends upward, suggesting that investors are positioning for further upside gains.

While this outlook remains bullish, market volatility requires close attention, as sentiment can shift quickly, particularly with the broader market still in a bearish phase.

Warning signs emerge

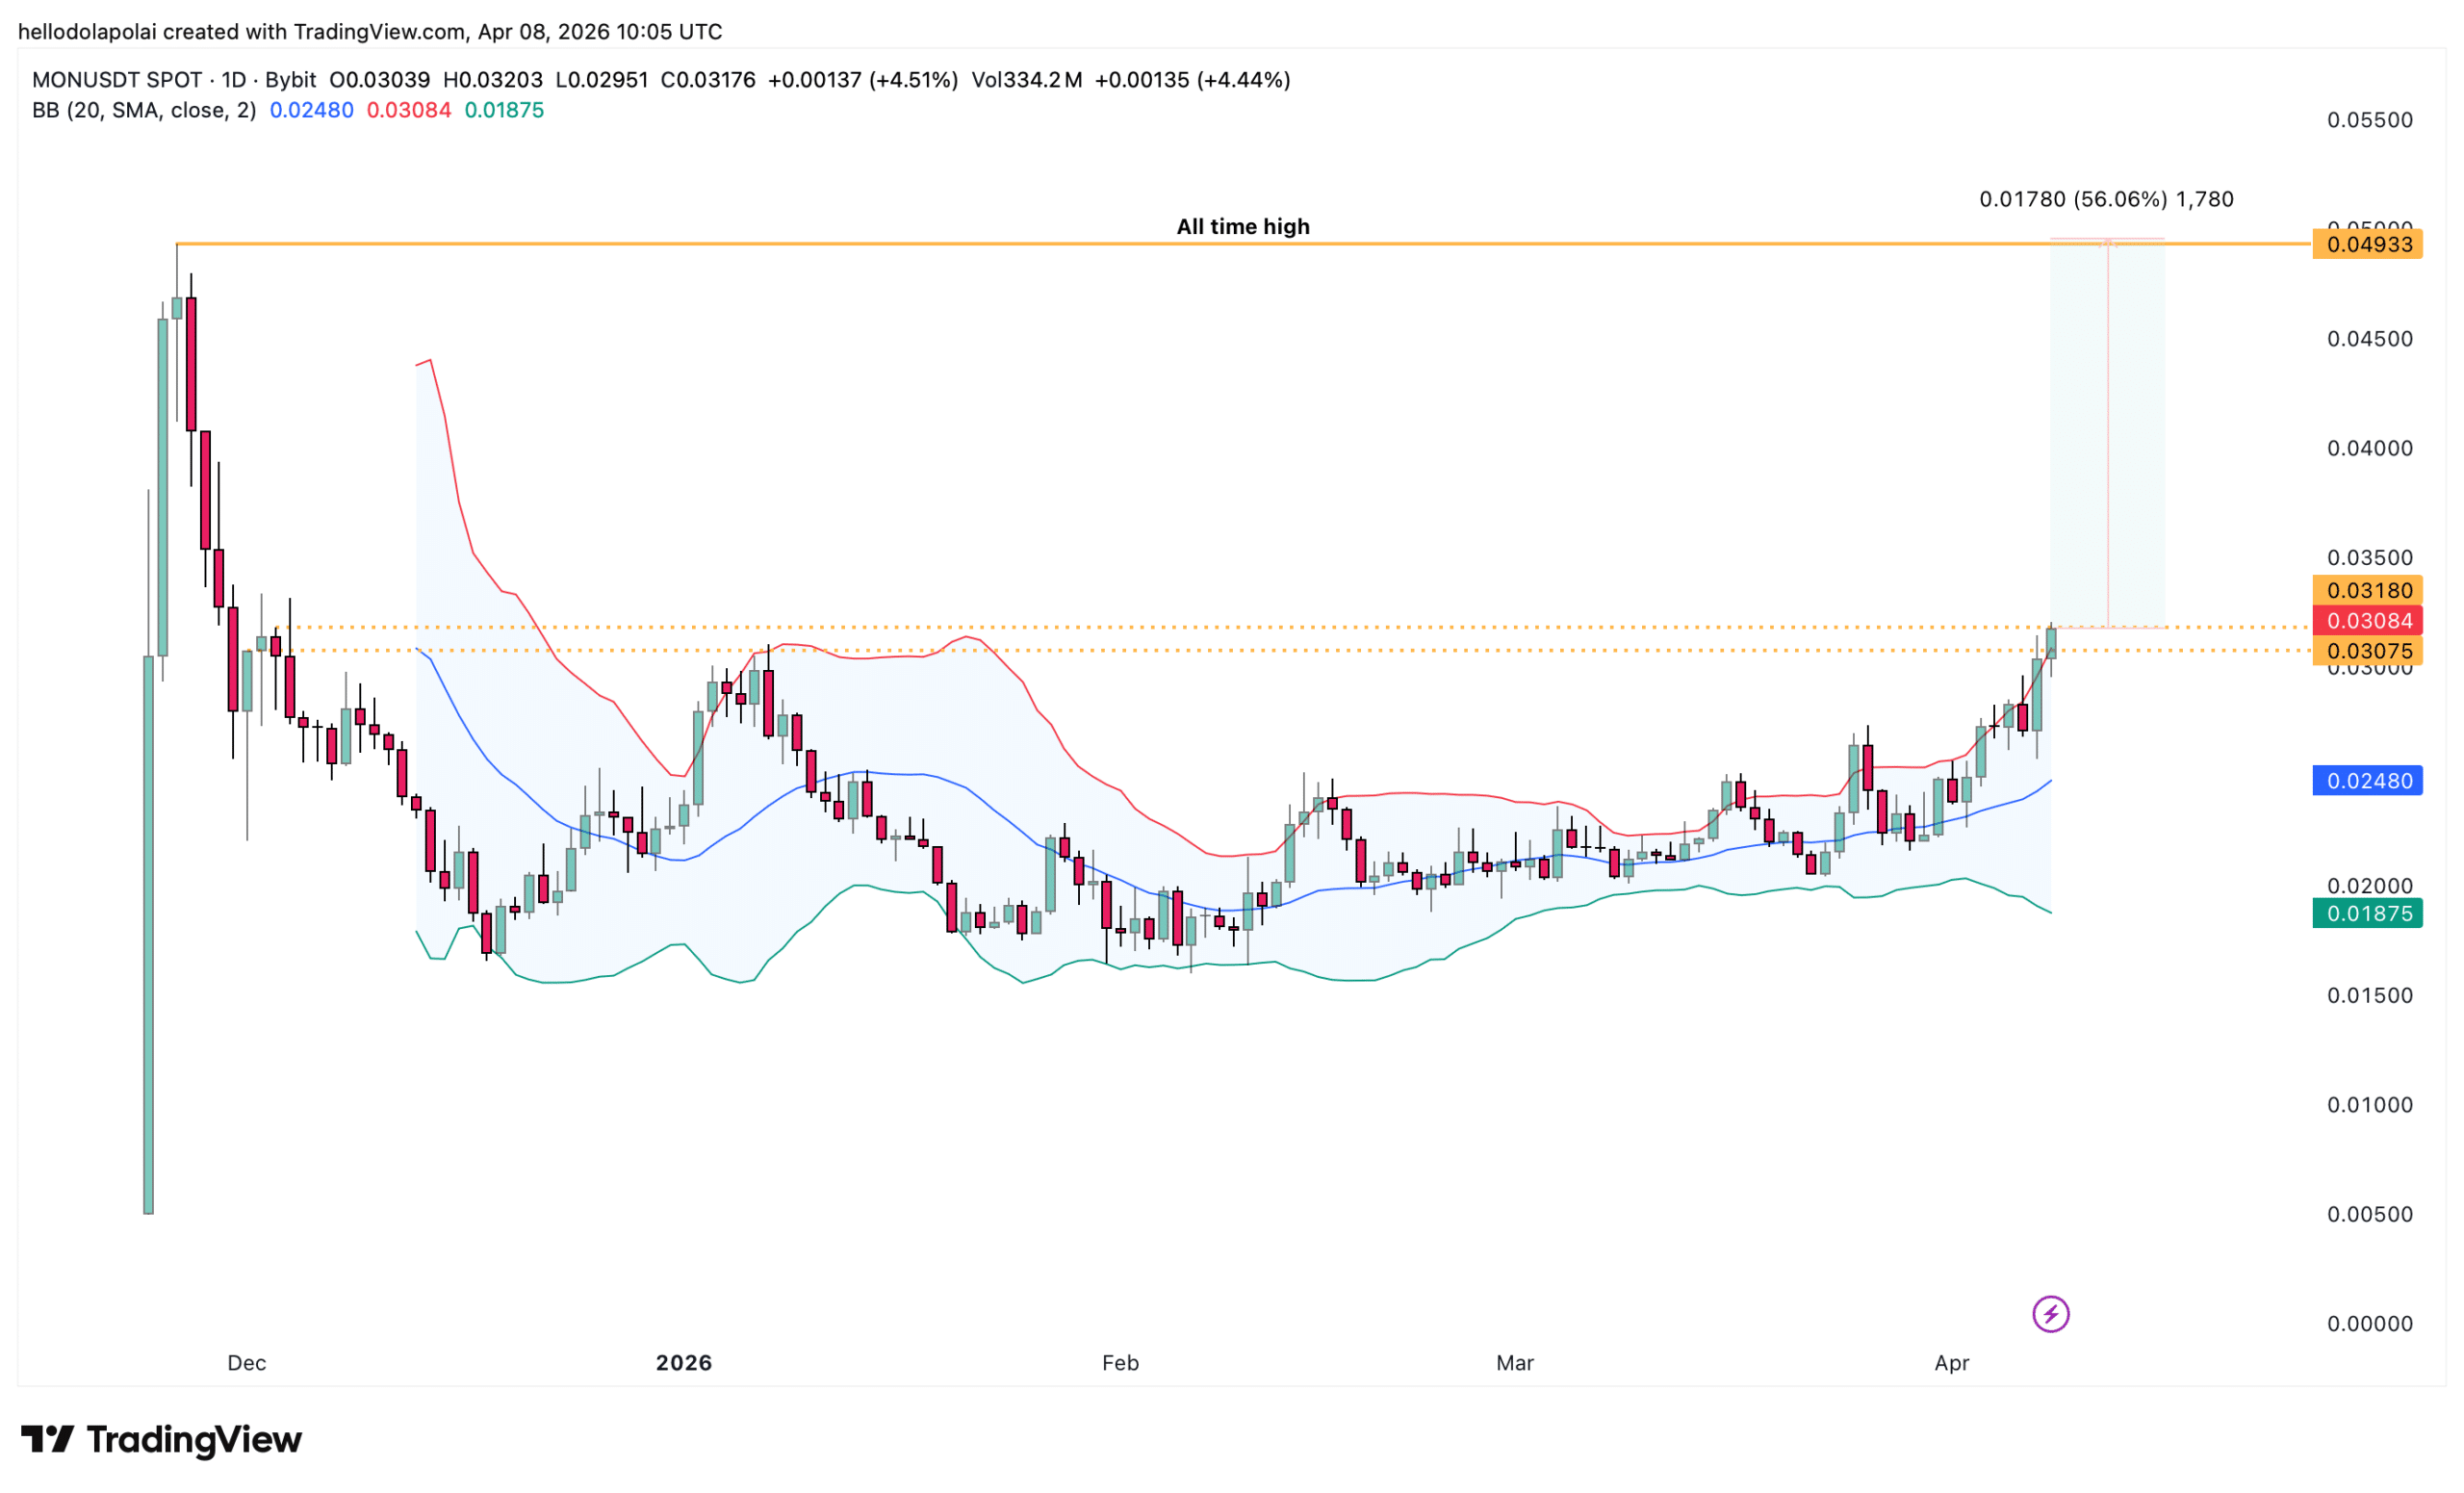
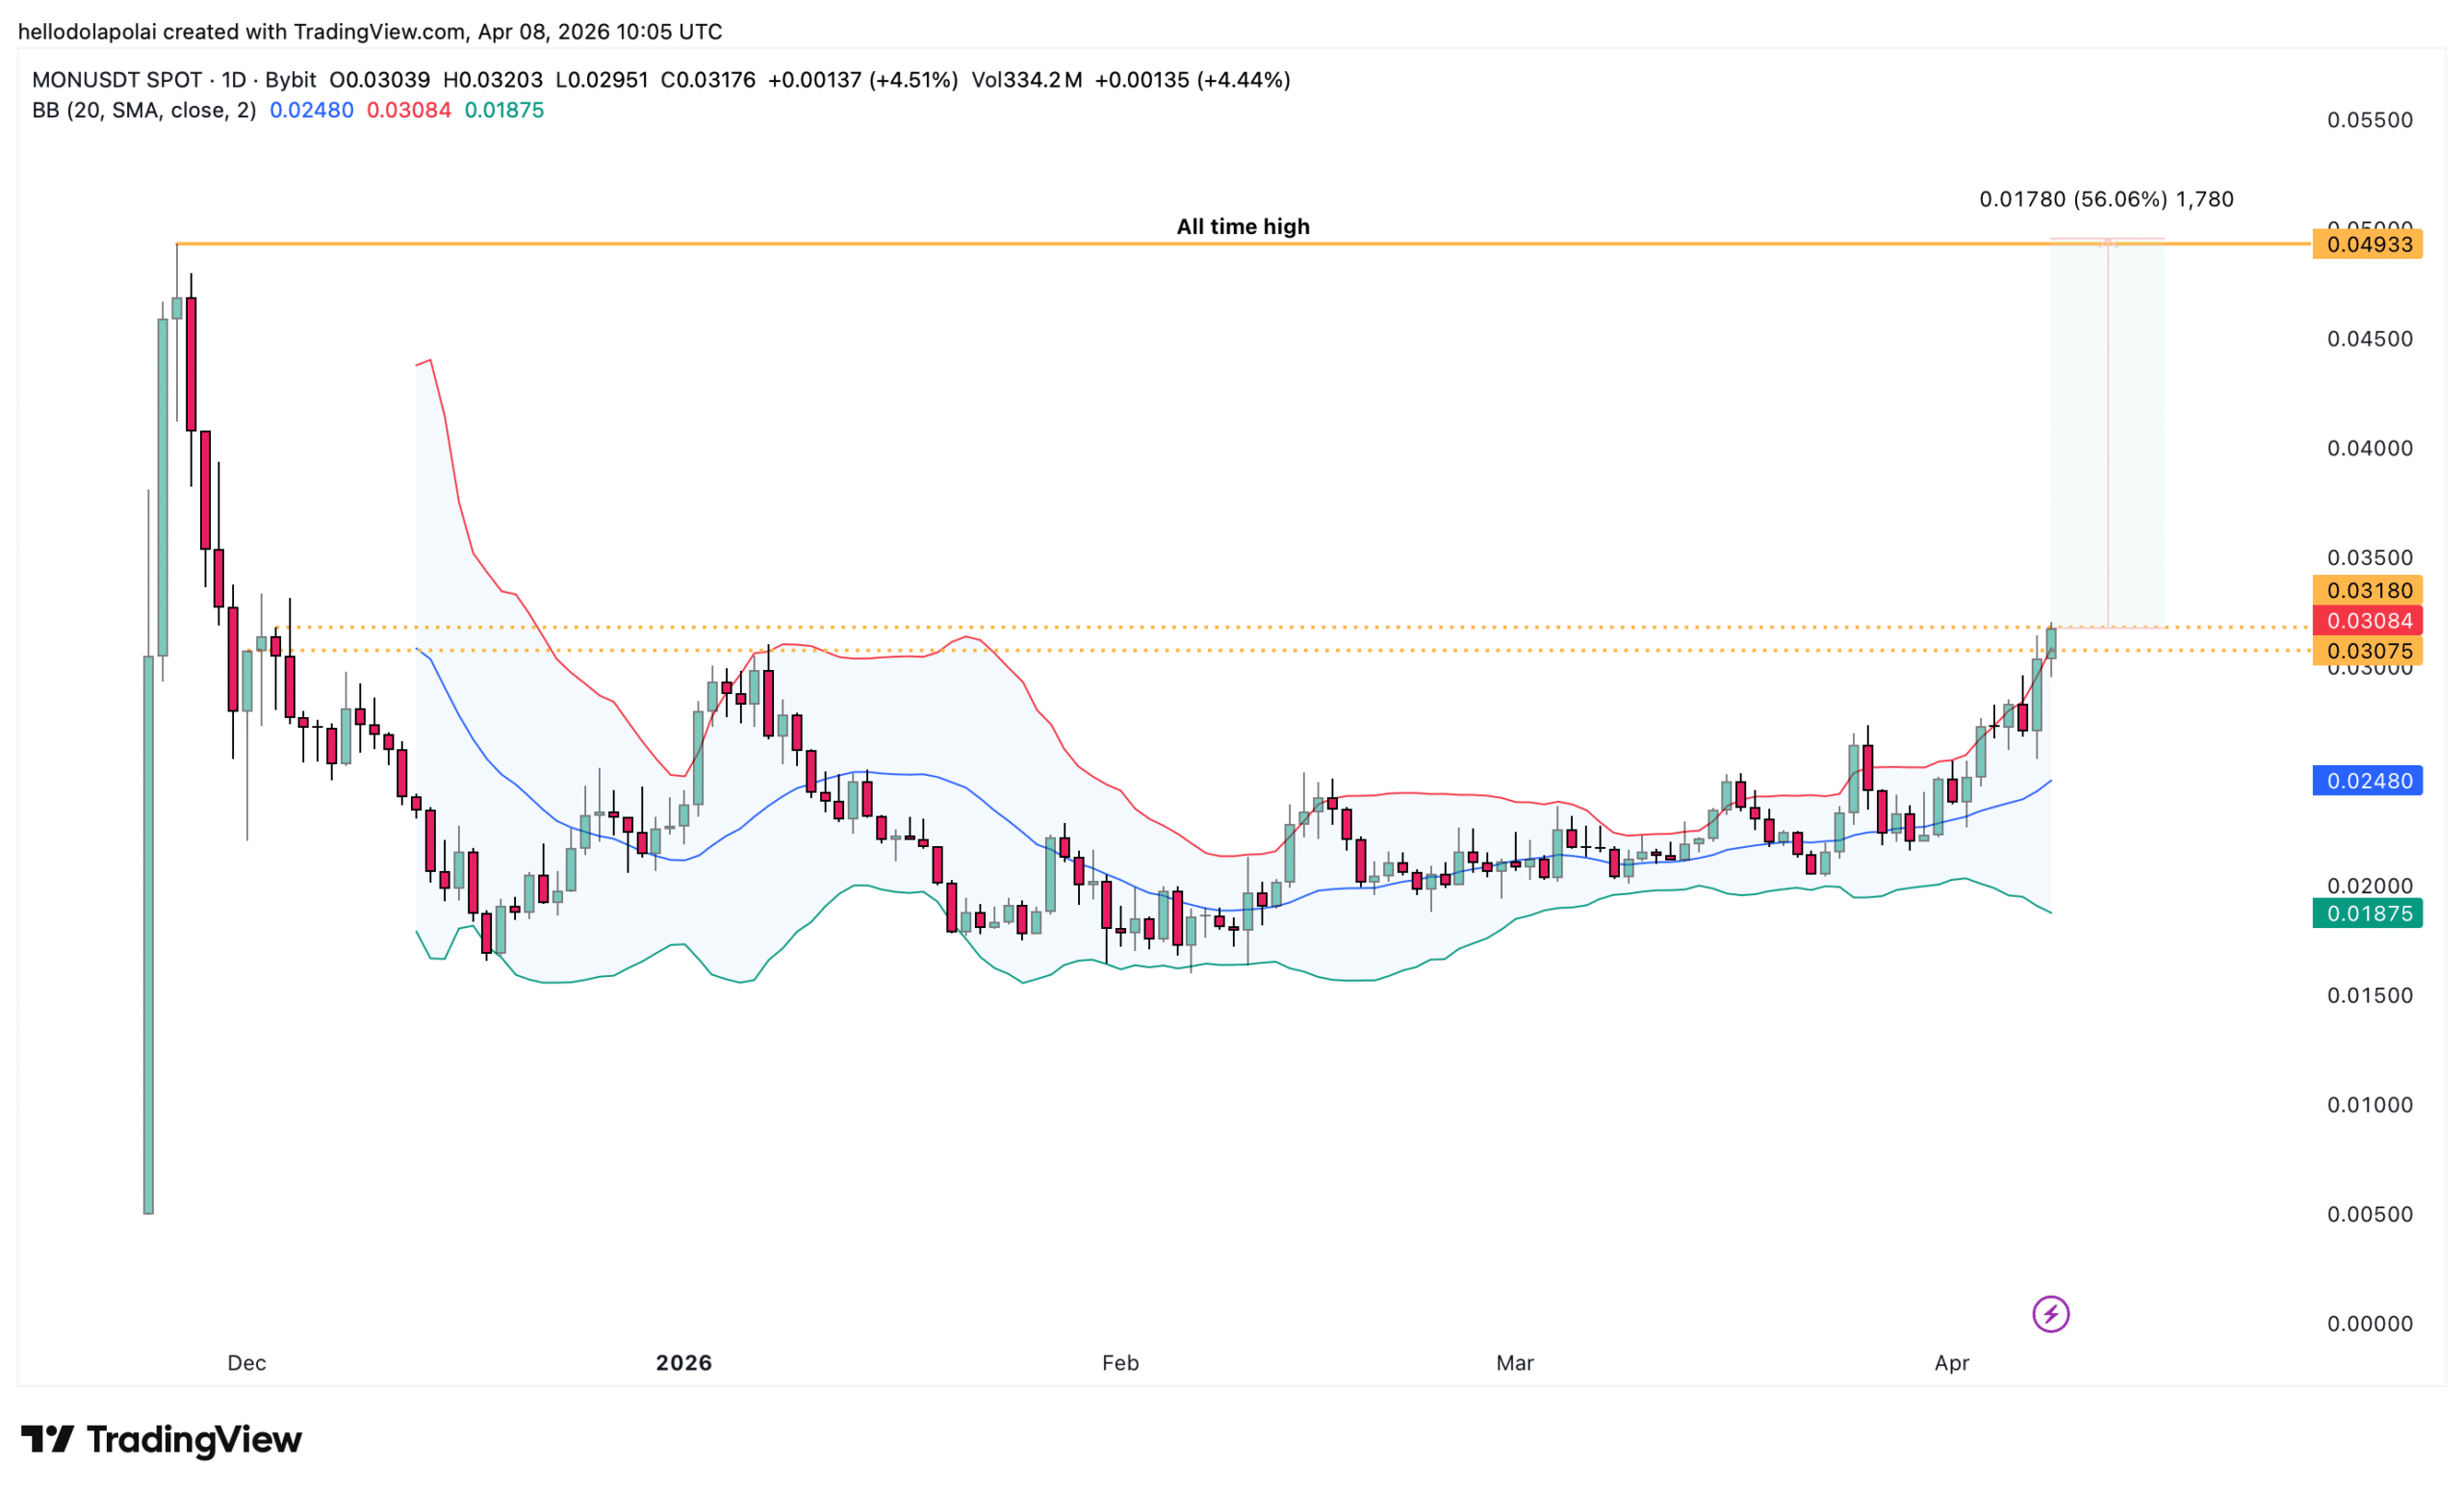
Bullish positioning comes with caution. The Bollinger Bands indicator, which measures whether an asset is overbought or oversold, shows that MON has entered the overbought region.

This level, marked by the upper band, suggests that buying pressure could weaken, potentially leading to a pullback toward lower levels, though not necessarily an immediate reversal.
Source: TradingView

This aligns with the resistance zone on the chart, which could act as a strong barrier and push prices lower. In that scenario, MON could form lower lows or continue to range, with the latter more likely if accumulation continues to build.

On the other hand, a breakout would significantly strengthen MON’s structure. Price would face less resistance on the path higher, as fewer supply zones remain overhead.

Is an all-time high likely?

A move toward a new all-time high depends on several factors, with capital inflow remaining the most critical.

A rally from the current level to the all-time high represents roughly a 56% increase. With a market capitalization of $1.52 billion, this would require an additional $851 million, pushing total valuation toward $2.37 billion.

For this to materialize, bullish sentiment must align across multiple fronts. Spot market accumulation must remain strong, perpetual Futures should continue to support long positioning, and broader crypto market sentiment must either turn bullish or stabilize.

At present, short-term data from both perpetual and Spot markets suggests that bulls remain in control. Over the past 10 days, MON’s perpetual flows reached $12.88 million, while Spot market inflows held at $7.31 million over the past five days, according to CoinGlass.


Final Summary

  • MON extends its run as accumulation surges again, while capital inflow into the market continues to rise.
  • A key resistance obstacle remains the critical level to watch in determining whether MON can sustain a major price rally.


Related Questions

QWhat is the main obstacle Monad (MON) faces in its current rally according to the article?

AThe main obstacle is a key resistance block that is expected to cap further upside and could potentially push prices lower if not broken.

QWhich two indicators are highlighted as showing strong investor accumulation and capital inflow for MON?

AThe Accumulation/Distribution indicator and the Money Flow Index (MFI) both indicate strong accumulation and capital inflows.

QWhat does the Bollinger Bands indicator suggest about MON's current price level?

AThe Bollinger Bands indicator shows that the asset has entered the overbought region, suggesting buying pressure could weaken and a pullback is possible.

QHow much of a price increase is required for MON to reach a new all-time high from its current level?

AA rally from the current level to the all-time high would represent roughly a 56% increase.

QWhat are the three factors that must align for MON to achieve a new all-time high?

ASpot market accumulation must remain strong, perpetual Futures should continue to support long positioning, and broader crypto market sentiment must either turn bullish or stabilize.

Related Reads

The Robinhood Stock Tokens You Bought Are Just Debts from Jersey Island

The Robinhood stock tokens you buy are essentially debt securities issued by a shell company in Jersey, not real equity. These tokens merely track stock prices like NVIDIA or Apple but grant no shareholder rights like voting or dividends. If the underlying company fails, you have no claim on its assets. Instead, you hold a debt instrument from Robinhood Assets (Jersey) Limited, which promises returns based on stock performance. If this Jersey entity goes bankrupt, you become an unsecured creditor. This complex structure stems from Robinhood's past crisis during the 2021 GameStop short squeeze, where T+2 settlement caused liquidity issues. The blockchain-based tokens enable instant settlement, theoretically preventing such trading halts. The product is classified by the SEC as a "linked security" or structured note, carrying counterparty risk not borne by actual shareholders. It is available globally but excluded from the US, UK, and other major markets, while Robinhood offers a fully compliant, asset-backed token model in Europe under MiFID II. The system relies on oracles for pricing, which poses risks like manipulation and faulty liquidations seen in DeFi exploits. Robinhood profits from spreads and aims to become a full-chain settlement layer. Meanwhile, competitors like Ondo have launched SEC-registered, fully compliant equity tokens in the US with actual voting rights and dividends. Robinhood’s Jersey debt model appears as a transitional, regulatory-arbitrage product, aiming to capture market share ahead of future regulatory clarity.

Foresight News32m ago

The Robinhood Stock Tokens You Bought Are Just Debts from Jersey Island

Foresight News32m ago

Trading

Spot
活动图片