Средний прирост биткоина в ноябре основан на искаженных цифрах

cryptonews.ruPublished on 2025-04-19Last updated on 2025-11-20

Аналитики усомнились в том, заслуживает ли ноябрь своей репутации исторически «самого сильного месяца» для биткоина, после того как криптовалюта упала на 10% за последние семь дней и ненадолго опустилась ниже $90 000.

«Исторические средние показатели указывают на силу, но эти цифры искажены, а текущий фон далек от нормы», — сказал Джеймс Харрис, генеральный директор провайдера криптовалютной доходности Tesseract.

Харрис заявил, что, хотя падение ниже долгосрочного среднего значения заслуживает внимания, это «не полная картина».

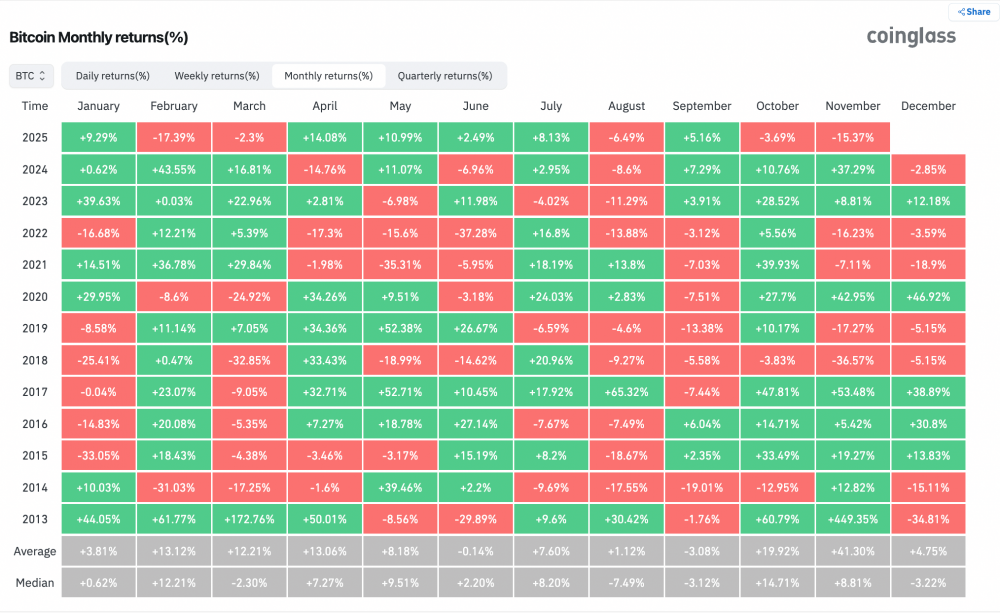
По данным CoinMarketCap, Биткоин в октябре упал на 3,69%. Источник: CoinGlass.

С начала месяца цена биткоина снизилась на 15,37% и приближается к худшему ноябрю с 2019 года, когда он закрыл месяц со снижением на 17,27%. По данным CoinGlass, за последний день биткоин торгуется на 1% дороже, до $93 290, поднявшись с минимума ниже $89 400.

Харрис заявил, что сравнение текущей рыночной ситуации с предыдущими годами «не является стопроцентным», и отметил, что из-за приостановки работы правительства США ключевые экономические данные были отложены на шесть недель.

«Когда они вновь появились, накопившаяся информация заставила инвесторов практически в одночасье пересмотреть ожидания по инфляции и тарифам», — сказал он.

По данным инструмента CME FedWatch, уверенность участников рынка в снижении ставки Федеральной резервной системы в декабре также упала до 41%.

Новый максимум биткоина к концу года возможен, но маловероятен

Харрис отметил, что биткоин все еще может восстановить обороты и достичь новых исторических максимумов до конца года, однако он не делает на это ставки.

«Это возможно, но мы этого не прогнозируем», — сказал он.

Последний раз биткоин достигал исторического максимума в $125 100 в начале октября, что побудило трейдеров ожидать продолжения ралли в ноябре — исторически самом сильном месяце.

С 2013 года средняя доходность биткоина в ноябре составила 41,35%. Этот показатель был завышен из-за скачка на 449% в 2013 году, что примерно на 277% выше, чем в марте, втором по величине месяце роста в том году.

Биткоин демонстрирует «первые признаки стабилизации»

Аналитики Bitfinex полагают, что худший период падения биткоина, возможно, подходит к концу.

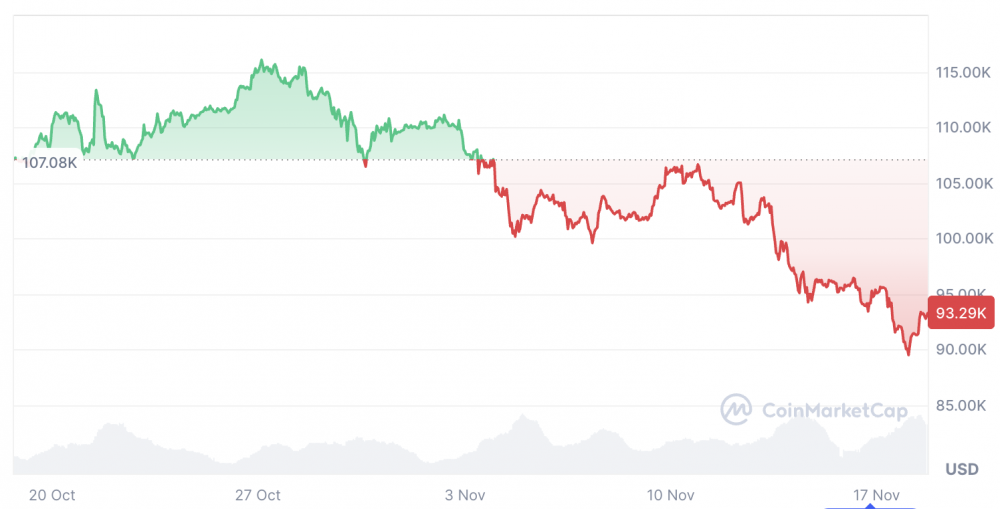
На момент публикации цена биткоина составляла $93 290. Источник: CoinMarketCap.

«Похоже, что пришло время для установления локального дна довольно скоро, — заявили аналитики в комментариях. — На протяжении многих исторических циклов устойчивые минимумы формировались только после того, как держатели краткосрочных активов шли в убыток, а не до этого».

Однако ноябрьский рост, на который надеются трейдеры, может перенестись и на декабрь. Команда Bitfinex заявила, что давление продавцов начинает ослабевать, появились «первые признаки стабилизации после одной из самых резких коррекций цикла».

Аналитики компании криптовалютных платежей B2BINPAY сошлись во мнении, что «устойчивое восстановление может произойти столь же быстро».

«Первое значимое сопротивление находится на уровне 97 000–100 000 долларов, — заявили они. — Пока BTC не попытается его отыграть, настроения, скорее всего, останутся оборонительными».

Related Reads

After Missing the 20x, I've Found a 'Dumb' Method for AI Investing

**Missing the 20x Opportunity: A Simple 'Dumb' Approach to AI Investing** The AI boom, driving NVIDIA's revenue from $60B to $216B in two years, creates immense investment pressure. However, like the internet bubble of 2000, the largest AI opportunities likely lie ahead, perhaps after a correction. Instead of rushing in now or waiting paralyzed for a crash, the author proposes a third way: building a "knowledge warehouse" by systematically mapping the AI industry to be ready when opportunities arise. The core of the strategy is understanding AI's four-layer value chain: 1. **Compute Infrastructure (The "Engine"):** This foundational layer, where all money eventually flows, includes: a) **Chip Design:** NVIDIA's dominance via its CUDA ecosystem, b) **Chip Manufacturing/Packaging/Memory:** TSMC's near-monopoly in advanced manufacturing and SK Hynix's lead in High Bandwidth Memory (HBM), c) **Optical Interconnects:** Essential for large-scale AI clusters (e.g., Lumentum, Coherent), d) **Cooling & Power:** Critical for high-density AI data centers (e.g., Vertiv), e) **Servers/Data Centers & Cloud Platforms:** The physical and virtual wholesale providers. 2. **Models & Tools (The "OS"):** The competitive layer of foundation models (OpenAI, Anthropic, Google, Meta, xAI), now generating real revenue. A key shift is the center of gravity moving from **Training** models to **Inference** (running models), which demands different chip characteristics and could challenge NVIDIA's monopoly. 3. **Middleware & Platform ("The Glue"):** Connects models and applications (e.g., Scale AI, Hugging Face). This layer could explode if applications take off. 4. **Vertical Applications ("The Cash Register"):** Where AI meets end-users (e.g., enterprise AI, coding tools, medical AI, robotics). A critical cross-cutting constraint is **Energy**, as AI's massive power consumption drives investment in nuclear and other energy infrastructure. The author identifies four key questions for further research: 1) How will the shift from Training to Inference reshape the competitive landscape? 2) With tech giants spending over $600B on capex, where is the ROI from AI applications? 3) What are the under-the-radar opportunities in the "second" and "third" circles of the value chain (e.g., cooling, specialty foundries)? 4) How will geopolitics (e.g., U.S.-China chip restrictions) bifurcate the supply chain? The conclusion is that missed opportunities stem from insufficient research, not slow timing. By methodically studying each layer—its business models, competition, and valuations—investors can build the "killer intuition" needed to act decisively when the market presents its chance.

marsbit2m ago

After Missing the 20x, I've Found a 'Dumb' Method for AI Investing

marsbit2m ago

Rented Faith: How Much of the Bitcoin ETF Inflows Is Real Money?

"Rented Conviction: How Much of Bitcoin ETF Flows Is Real Money" The weekly inflows into Bitcoin ETFs are often interpreted as a gauge of institutional belief. However, a significant portion of this activity is driven by a hidden arbitrage trade, not directional conviction. The core mechanism is a cash-and-carry arbitrage: traders buy spot Bitcoin (often via ETFs) while simultaneously shorting CME futures to lock in the price difference, or "basis." This delta-neutral trade is essentially an interest rate play. In weekly data, about half the fluctuation in ETF flows can be explained by new short positions added by leveraged funds (hedge funds), with a correlation of 0.70. Bitcoin's price movement in a given week shows no statistical power in predicting these flows. While this arbitrage trade drives weekly *volatility*, it is not the main component of the cumulative *stock*. Of the total ~$55 billion in net ETF inflows, the current net arbitrage position is only about $1 billion. The remainder is steady, directional buying averaging ~$400 million per week, which constitutes the vast majority of the accumulated "mountain" over two years. Thus, ETF flow data overstates the *volatility* of conviction, not its *level*. This arbitrage trade has been unwinding for nearly two years. Leveraged fund short positions peaked at ~$14 billion in late 2024 and have since declined to ~$4.5 billion. When the basis compresses to unprofitable levels, ETF inflows and short positions retreat together. Recent outflows should not be mistaken for a loss of faith but rather the routine unwinding of this rate trade. For Ethereum ETFs, the pattern is weaker. Accounting for staking yield makes the basis often negative, so neither strong conviction buying nor robust arbitrage supports its flows. To interpret ETF flows correctly, monitor the CME basis versus T-bill rates and leveraged fund net shorts. They reveal how much of the next "demand" headline is real. The real, patient buy-and-hold demand is what constitutes the enduring bulk of ETF assets.

marsbit49m ago

Rented Faith: How Much of the Bitcoin ETF Inflows Is Real Money?

marsbit49m ago

Soaring Over Tenfold Within the Year: The Frenzy Over SK Hynix Leveraged Products

South China Morning Post The leveraged ETF tracking SK Hynix has surged over tenfold year-to-date, fueled by intense market speculation on the memory chip sector. By June 22, the value of the 'South Korea 2x Long SK Hynix ETF' listed in Hong Kong had skyrocketed by more than 1,061% since the start of the year, while its asset size exploded over twenty times from the end of last year. The rally is driven by AI-driven demand for high-bandwidth memory (HBM), with SK Hynix recently sampling its next-generation HBM4E product. However, industry professionals warn of significant risks. Leveraged ETFs magnify both gains and losses. During a recent market correction, while the underlying SK Hynix stock fell 19.1%, its double-leveraged ETF dropped nearly 38%. Korean regulators noted that such products could theoretically lose 60% in a single day. Additionally, these ETFs face risks like time decay in volatile markets, liquidity spirals during mass redemptions, and extreme price dislocations from market-making failures, as seen in early June when an ETF moved opposite to its underlying stock. The trading is predominantly driven by retail investors, with institutional capital largely absent due to the products' high volatility. Analysts caution that with the semiconductor sector at elevated valuations and facing geopolitical and supply chain uncertainties, leveraged ETFs pose a substantial threat of amplified losses for uninformed investors.

marsbit1h ago

Soaring Over Tenfold Within the Year: The Frenzy Over SK Hynix Leveraged Products

marsbit1h ago

Trading

Spot
Futures
活动图片