Chainalysis 2025 加密采用指数:印度和美国领先,全球采用加速

marsbitPublished on 2025-09-02Last updated on 2025-09-03

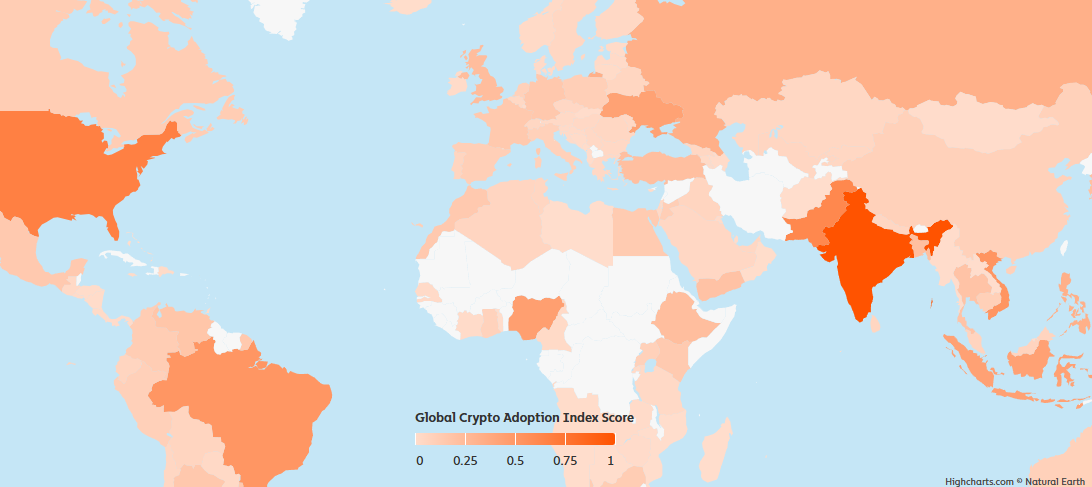
我们很高兴分享 2025 年度 Chainalysis 全球加密货币采用指数。在每年的报告中,我们都会查看链上和链下的数据,以确定哪些国家在加密货币的基层采用方面领先世界。我们的研究突出了那些独特的加密货币用例正在扎根的国家,并探讨了为什么世界各国的人们都在接受加密货币。
Chainalysis


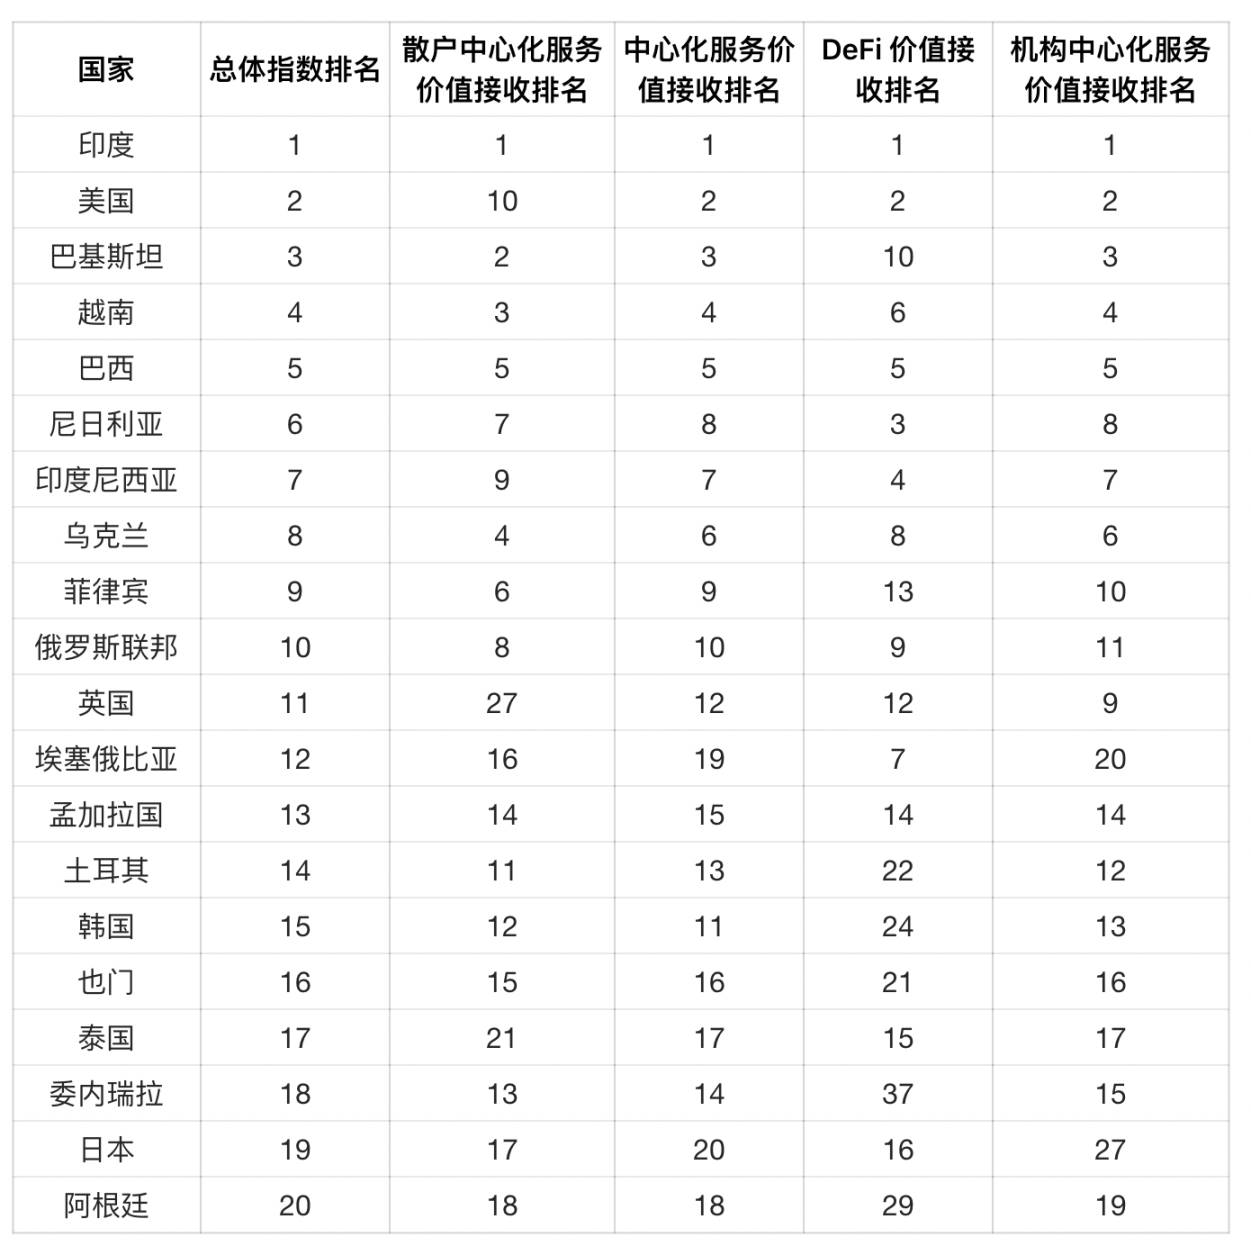
2025 年全球加密货币采用指数前 20 名

2025 年,亚太地区进一步巩固了其作为全球草根加密货币活动中心的地位,其中印度、巴基斯坦和越南领衔,这些国家的人口推动了中心化和去中心化服务的广泛采用。与此同时,由于监管势头的推动,包括现货比特币 ETF 的批准和更清晰的机构框架,北美地区攀升至区域排名的第二位,这有助于使加密货币在传统金融渠道中的参与合法化并加速其发展。
Chainalysis


亚太地区是增长最快的地区

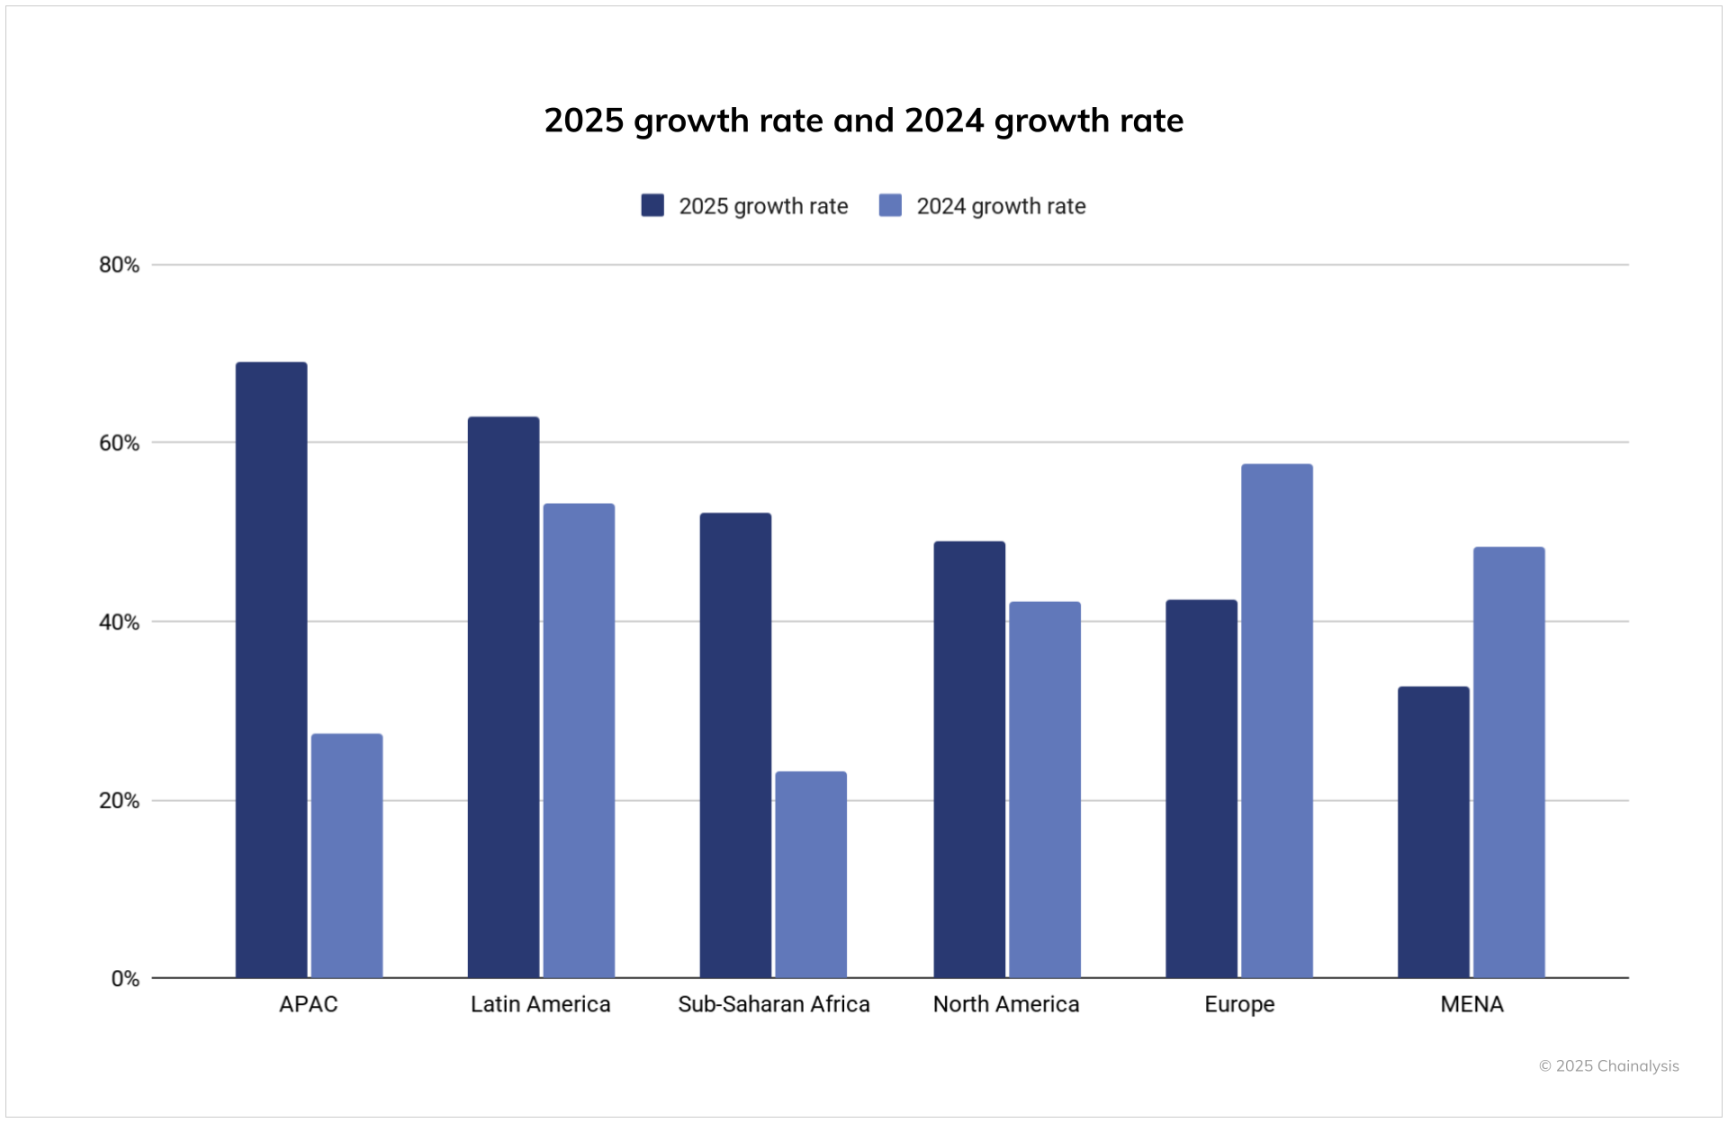
在截至 2025 年 6 月的 12 个月里,亚太地区成为链上加密货币活动增长最快的地区,价值接收同比增长 69%。亚太地区的加密货币交易总量从 1.4 万亿美元增长到 2.36 万亿美元,这是由印度、越南和巴基斯坦等主要市场的强劲参与度推动的。

紧随其后的是拉丁美洲,其加密货币采用率增长了 63%,反映出散户和机构层面的采用率都在上升。相比之下,撒哈拉以南非洲地区的采用率增长了 52%,表明该地区继续依赖加密货币进行汇款和日常支付。这些数字突显了加密货币发展势头向全球南方的广泛转移,在那里,实际应用日益推动着加密货币的采用。
Chainalysis

与此同时,从绝对数量来看,北美和欧洲仍然占据主导地位,在过去一年中分别收到超过 2.2 万亿美元和 2.6 万亿美元。北美的 49% 的增长反映了机构对加密货币重新产生兴趣的一年,这得益于现货比特币 ETF 的推出和监管清晰度的提高。欧洲 42% 的增长,虽然低于其他地区,但鉴于其已经很高的基数,仍然是一个大幅增长,突显了该大陆持续的机构活动和不断扩大的用户基础。与此同时,中东和北非地区的增长较为温和,为 33%,这表明与其他新兴市场相比,其采用速度较慢,不过总交易量仍然超过 5000 亿美元。

与前一年相比,这一周期中几乎每个地区都出现了加速增长,尤其是亚太地区和拉丁美洲的增长尤为明显。去年,亚太地区的增长率仅为 27%,但在最近一个时期,这一数字增加了一倍多,达到 69%。同样,拉丁美洲的同比增长率从 53% 跃升至 63%,巩固了该地区作为加密货币增长最快的中心之一的地位。欧洲、中东和北非以及撒哈拉以南非洲地区也出现了快速增长,这表明全球范围内的广泛扩张。有趣的是,北美的增长率也从 42% 提高到 49%,进一步表明 2025 年的监管清晰度和机构资金流入开始在交易层面的数据中显现出来。


按人口调整后的新图景:东欧占主导

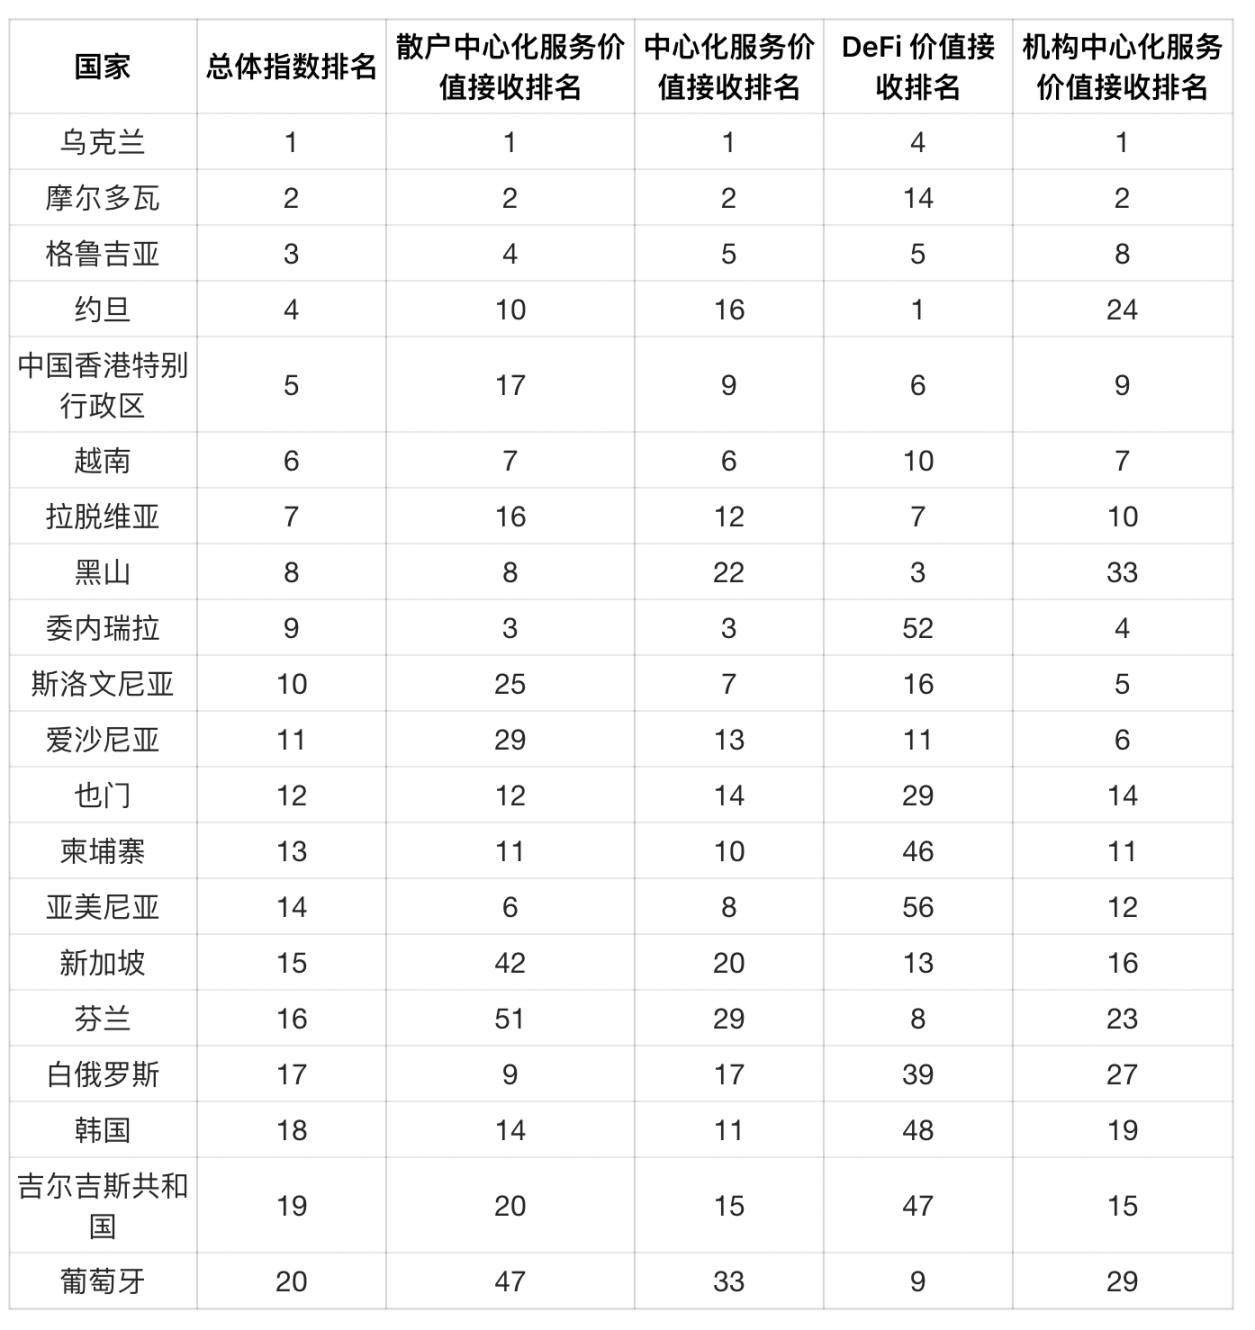
我们的指数传统上侧重于根据人均国内生产总值调整后的活动,当加密货币是小众且集中在高交易量用户中时,这种方法效果最佳。但随着采用范围的扩大,按人口调整后的指标能更清楚地显示加密货币在哪里获得真正的基层吸引力。

当我们按人口调整我们的指数时,我们发现了一组非常不同的领先国家。包括乌克兰、摩尔多瓦和格鲁吉亚在内的东欧国家名列前茅,这反映出相对于其人口规模而言,这些国家的加密货币活动水平很高。经济不确定性、对传统金融机构的不信任以及该地区较强的技术素养,这些因素可能推动了东欧地区对加密货币的采用。这些因素使加密货币成为财富保值和跨境交易的有吸引力的替代方案,特别是在面临通货膨胀、战争或银行限制的国家。
Chainalysis


稳定币在全球激增

在过去 12 个月里,稳定币的监管格局发生了重大变化。虽然美国的《天才法案》尚未生效,但其通过已经引发了强烈的机构兴趣,而在欧盟,《加密资产市场监管条例》(MiCA)为像 EURC 这样的有执照的欧元挂钩稳定币的推出铺平了道路。

然而,当我们查看链上数据时,稳定币的交易量仍然由 USDT 和 USDC 主导,它们在规模上一直超过其他稳定币。在 2024 年 6 月至 2025 年 6 月期间,USDT 每月处理的交易量超过 1 万亿美元,在 2025 年 1 月达到峰值 1.14 万亿美元。与此同时,USDC 的月交易量在 1.24 万亿至 3.29 万亿美元之间,在 2024 年 10 月的活动尤其高。这些交易量突显了 Tether 和 USDC 在加密货币市场基础设施中的持续核心地位,特别是在跨境支付和机构活动方面。
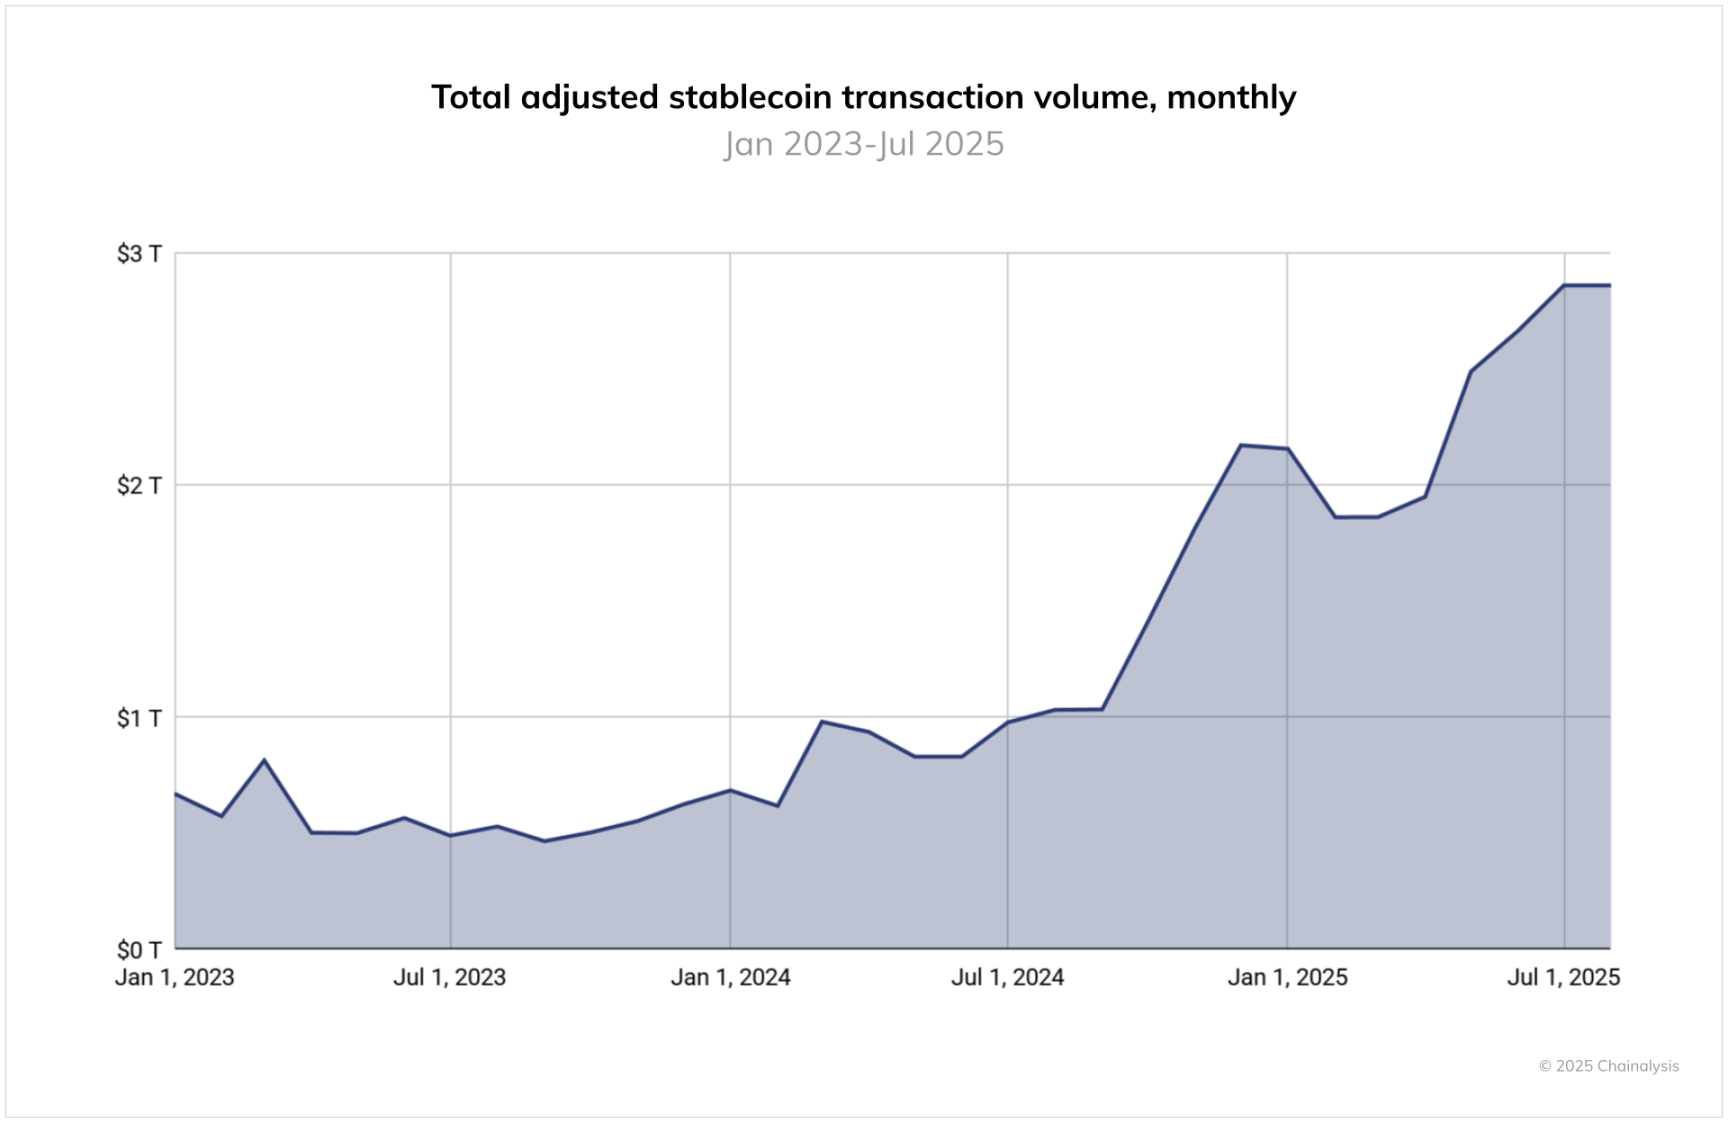
Chainalysis

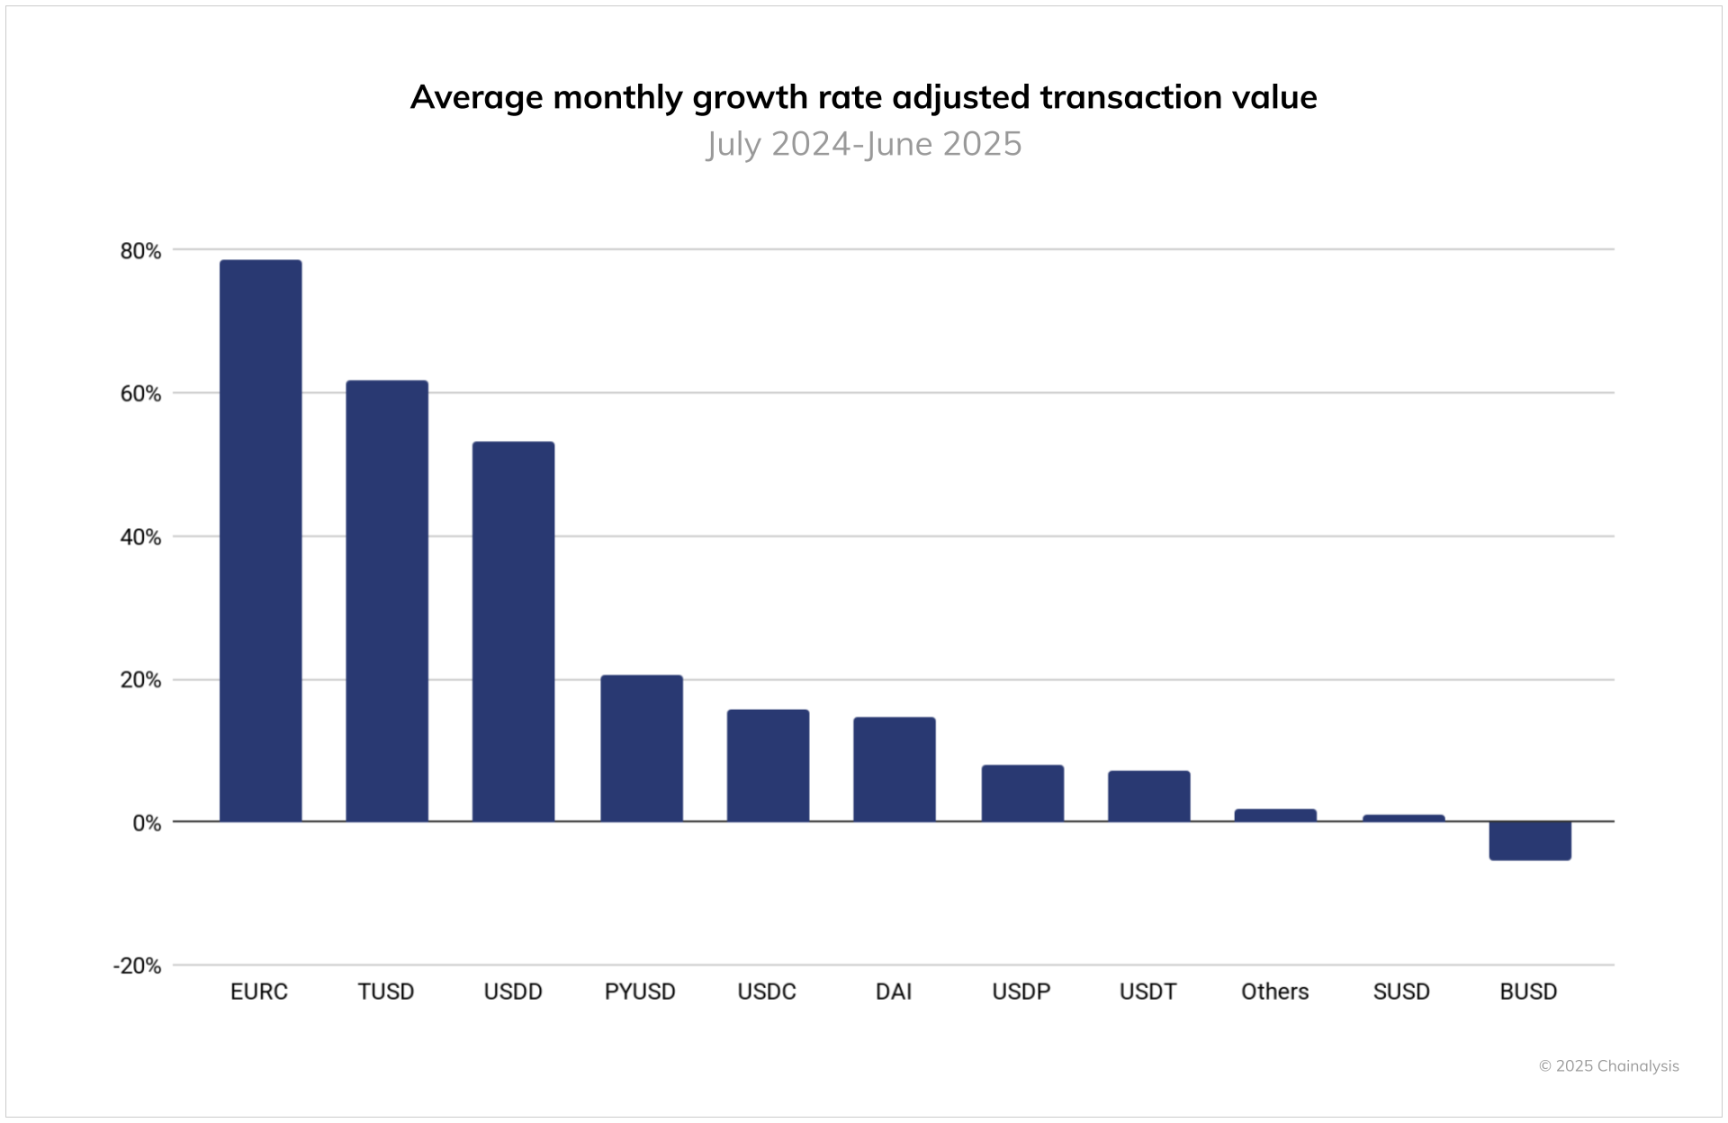
然而,观察增长趋势却揭示出不同的动态。虽然 Tether 和 USDC 出现了一些波动,但 EURC、PYUSD 和 DAI 等规模较小的稳定币却经历了快速增长。例如,EURC 平均月环比增长近 89%,月交易量从 2024 年 6 月的约 4700 万美元增长到 2025 年 6 月的 75 亿美元以上。PYUSD 也呈现持续加速增长,同期从约 7.83 亿美元增长至 39.5 亿美元。

这些变化与围绕稳定币的机构活动增加相吻合。Stripe、万事达卡和 Visa 都推出了产品,使用户能够通过传统渠道使用稳定币进行消费,而 MetaMask、Kraken 和 Crypto.com 等平台则推出了与银行卡关联的稳定币支付功能。在商家方面,Circle、Paxos 与 Nuvei 等公司的合作旨在简化稳定币的结算。与此同时,花旗银行和美国银行等传统金融机构已经宣布他们打算探索扩大其产品范围,甚至暗示可能推出自己的稳定币。
Chainalysis

从地区来看,这种差异可能预示着稳定币的使用方式正在发生变化。USDC 的增长似乎与美国的机构渠道和受监管的走廊密切相关,而 EURC 的崛起表明人们对以欧元计价的数字资产的兴趣日益浓厚,这可能是由符合 MiCA 标准的平台和欧洲金融科技的采用所驱动的。PYUSD 的增长可能表明在零售和支付环境中,人们对其他高度监管的稳定币有更广泛的需求。这些发展表明,稳定币的格局正在分化但也在扩大,当地的用例越来越影响全球的交易量。


法币入场:比特币仍然是主要入口

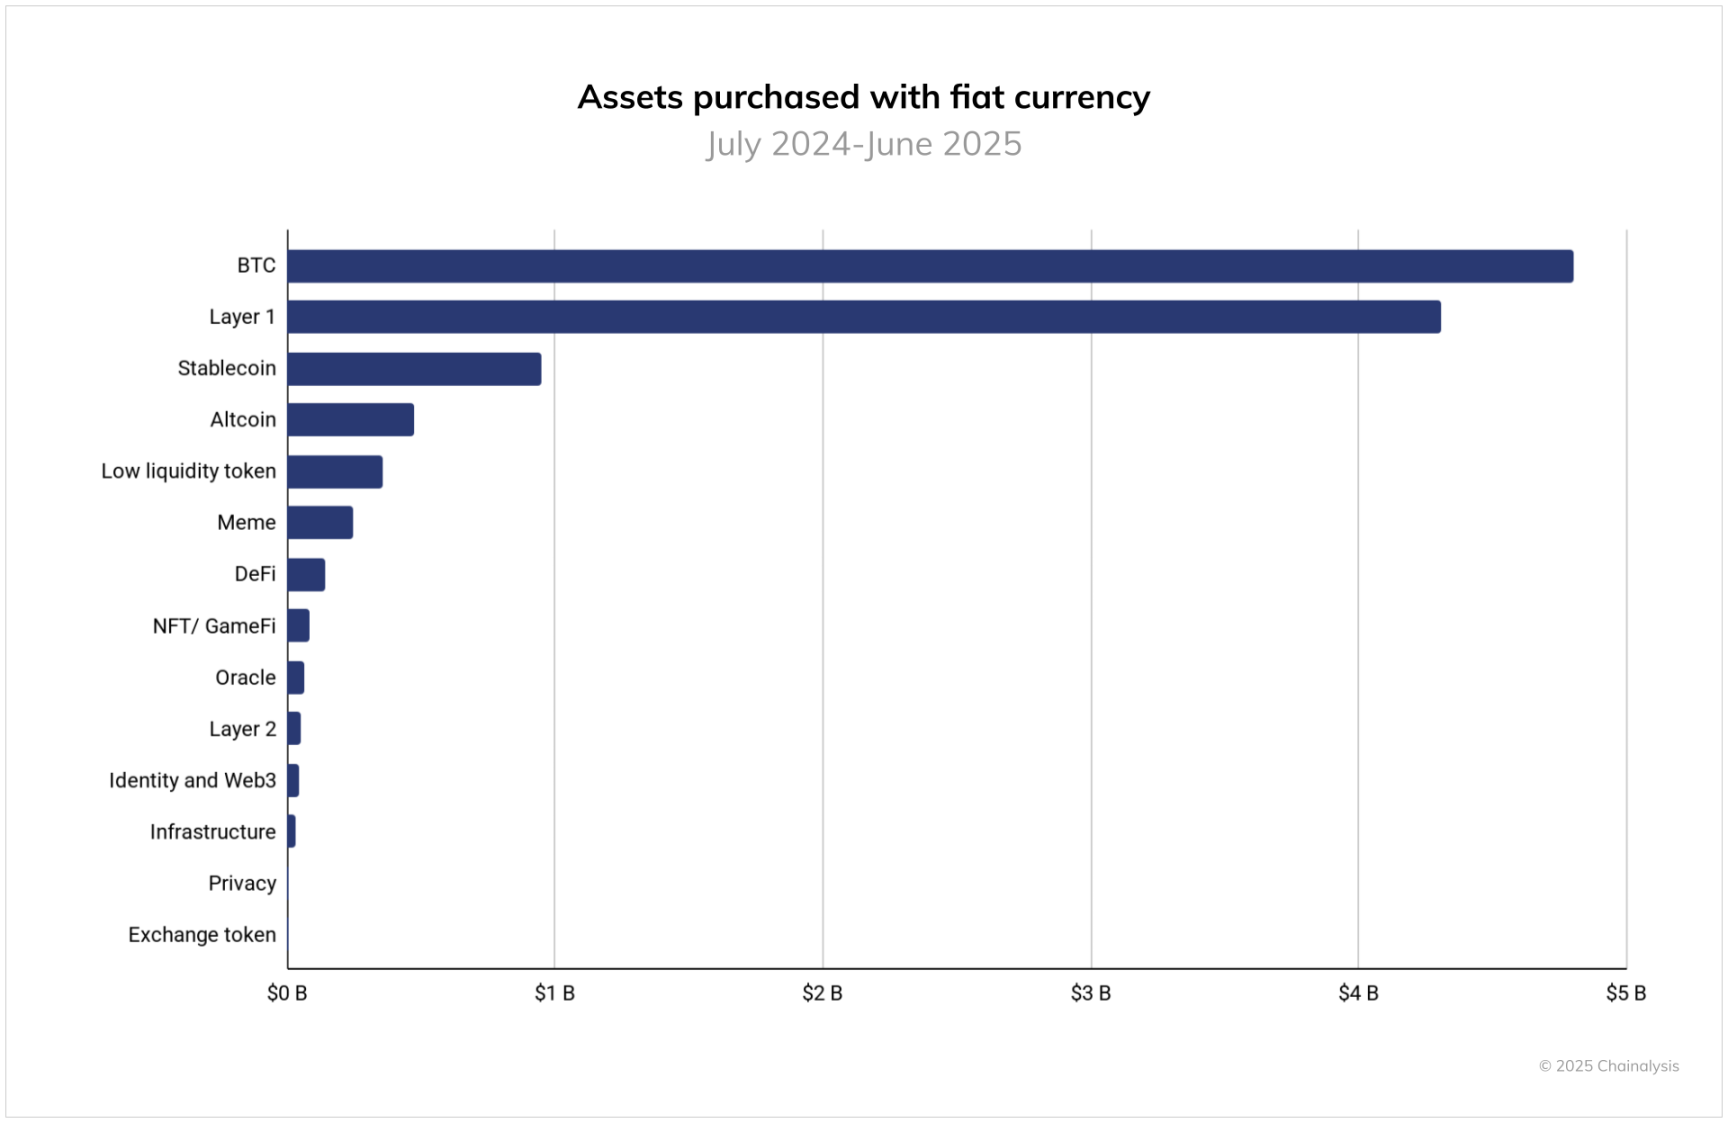
为了评估法币入场行为,我们检查了 2024 年 7 月至 2025 年 6 月期间在中心化交易所进行的购买情况,在这些交易所中,用户使用法币交易对购买加密货币。每笔交易都根据购买资产的高级分类进行分类,使我们能够评估哪些类型的代币是进入加密货币的主要入口。

比特币以巨大的优势领先,在此期间占法币流入量超过 4.6 万亿美元。这比排名第二的 Layer 1 代币(不包括 BTC 和 ETH)的两倍多,后者的流入量约为 3.8 万亿美元。稳定币排名第三,为 1.3 万亿美元,而山寨币紧随其后,约为 5400 亿美元。其他类别,包括低流动性代币、Meme 币和 DeFi,每个类别的法币流入量都不到 3000 亿美元。
Chainalysis

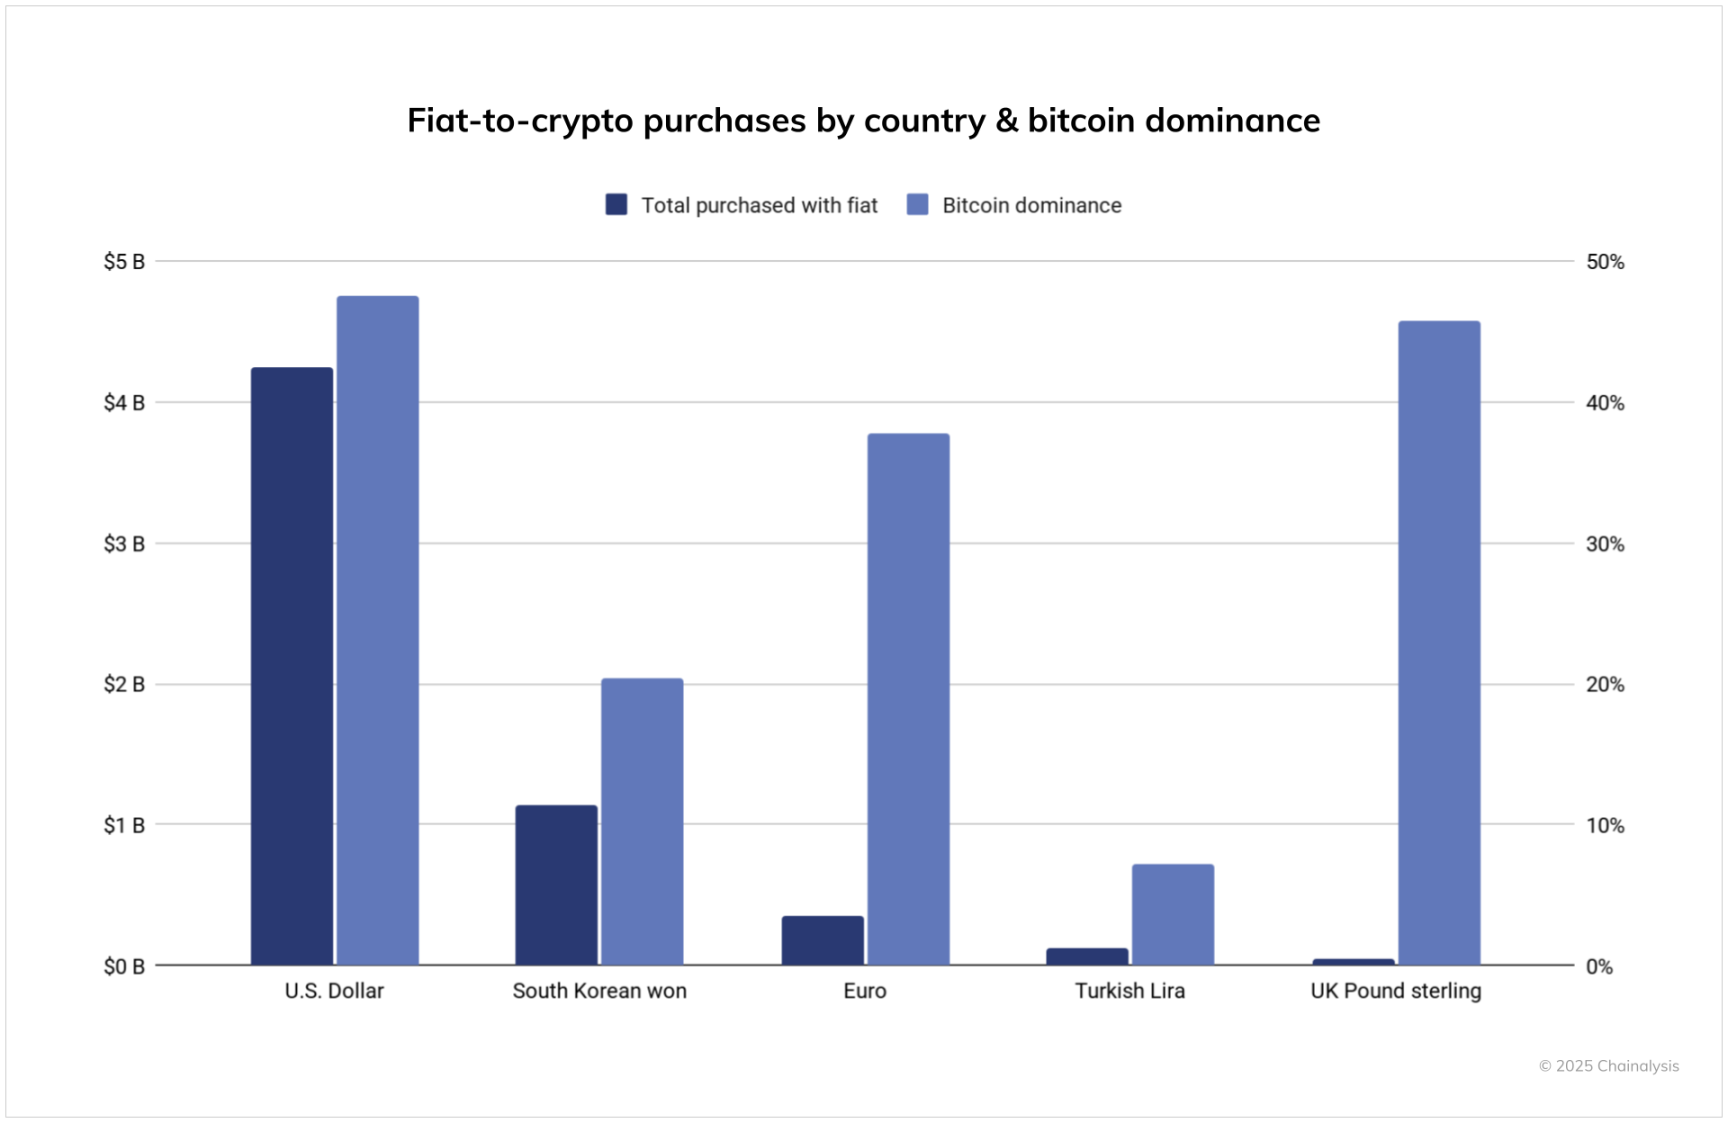
从地域上看,美国仍然是全球最大的法币入口,总交易量超过 4.2 万亿美元 ,是第二大国家的四倍多。韩国以超过 1 万亿美元的交易量紧随其后,而欧盟的交易量略低于 5000 亿美元。比特币的主导地位(即法币购买总量中分配给 BTC 的百分比)在英国和欧盟特别高,分别约为 47% 和 45%。相比之下,韩国的入场情况更为多样化,比特币在交易量中所占的份额较低。
Chainalysis

需要注意的是,这一分析仅包括在跟踪的中心化交易所的法币入场情况,并未涵盖通过场外交易柜台、像哈瓦拉这样的非正式市场或基于现金的加密货币商店的活动。

采用情况几乎覆盖所有收入阶层

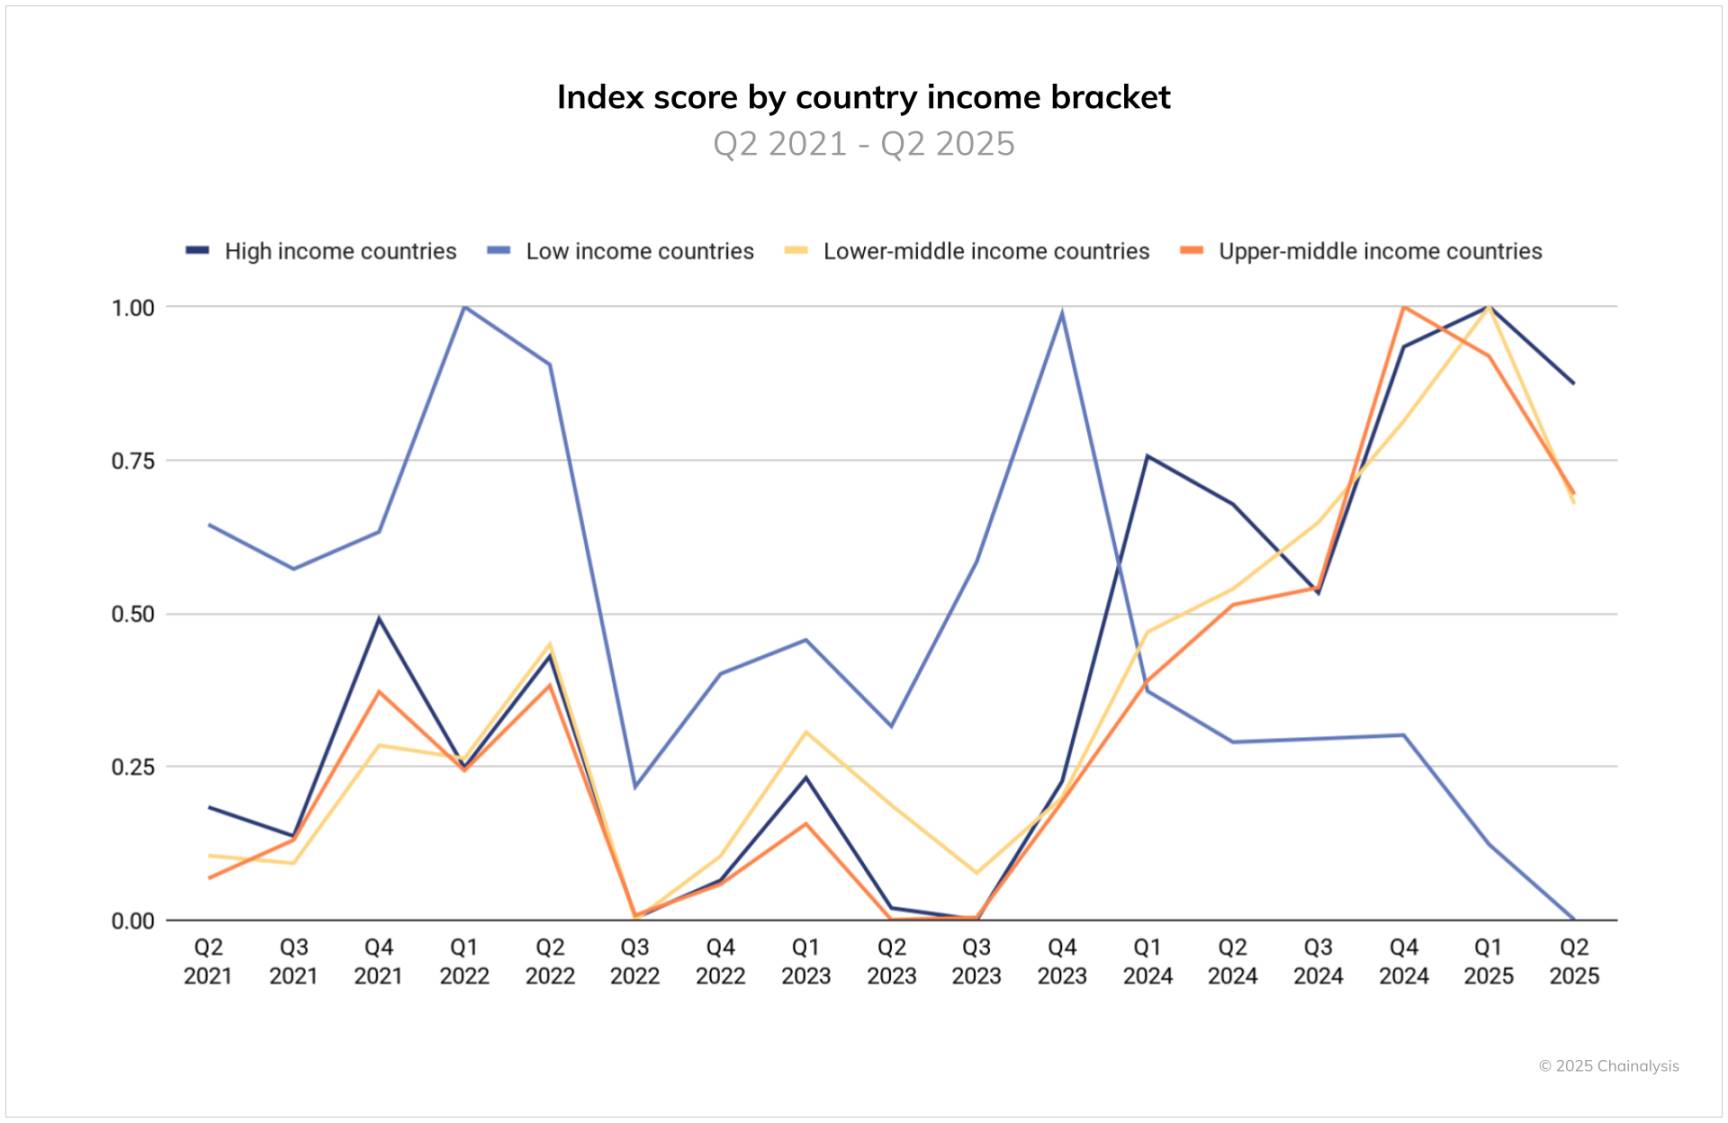
如果我们将全球采用指数分解为季度时间序列,并按世界银行的收入阶层进行细分,一个清晰的画面就会浮现出来:高收入、中高收入和中低收入阶层在本报告中同时达到高峰。这种同步性表明,当前的加密货币采用浪潮是广泛的,而不是孤立的,既有利于拥有更清晰规则和制度框架的成熟市场,也有利于汇款、通过稳定币获取美元以及移动优先金融等持续加速采用的新兴市场。换句话说,加密货币的采用是真正全球性的。
Chainalysis

在低收入国家群体中存在一个重要的警告。这个群体包括几个你通常不会期望持续大量使用加密货币的国家,而这种构成会产生更多的波动性:短暂的激增后紧接着回落。这是由政策冲击、流动性限制以及与冲突相关的干扰等因素驱动的。例如,阿富汗是一个低收入国家,Chainalysis 发现,在 2021 年美国撤军后,该国暂时失去了所有的加密货币活动。全球峰值信号是真实的,但低收入国家的趋势更加脆弱且不稳定性;那里的持久增长将取决于改善入口、监管透明度以及基本的金融和数字基础设施。

Related Reads

UBS Research Report Analysis: Murata's MLCC Factory Opens to the Public for the First Time in 20 Years, 20% Production Increase Potential from Optimization of Existing Assets

On August 18, UBS analysts visited Murata's Fukui Takefu factory, its first public opening in about 20 years. As the global MLCC leader with ~35% market share, this plant serves as the mother factory for advanced MLCCs used in AI servers and premium smartphones. UBS confirmed key findings: deep technical barriers remain, existing equipment holds ~20% latent production capacity, and physical expansion is nearing its limits. Murata's competitive edge lies in a closed-loop system encompassing proprietary ceramic material uniformity control, capacitance-maximizing self-developed technology, and self-built production equipment—a "black box" model difficult to replicate. Its flexible segmented production system efficiently manages over 50,000 product types. With new facility construction constrained and equipment lead times lengthening, optimizing existing lines becomes a crucial, lower-cost path to increase output. Murata's strategy involves shifting generic production to overseas sites like Thailand while focusing Japanese facilities on advanced, high-margin products. UBS projects significant operating margin expansion from 15.4% in FY2026 to 37.6% in FY2029, driven by this product mix upgrade toward high-capacitance, small-size MLCCs for AI and smartphones. Primary risks include U.S. economic slowdown, technology diffusion in Asia, and circuit integration trends. UBS maintains a positive industry outlook, noting potential for guidance upgrades, and sets a 13,200 yen target price based on a 30x FY2029 P/E, implying ~76% upside contingent on successful MLCC product structure advancement.

marsbit29m ago

UBS Research Report Analysis: Murata's MLCC Factory Opens to the Public for the First Time in 20 Years, 20% Production Increase Potential from Optimization of Existing Assets

marsbit29m ago

Arthur Hayes: Awaiting Fed Signal, Replenishing Ammo to Position for Crypto Bull Market

Arthur Hayes, co-founder of BitMEX, argues that the yen is significantly undervalued and analyzes three potential paths for its appreciation. He dismisses the first two options—the Bank of Japan raising interest rates or Japanese institutions selling foreign assets—as politically or economically unfeasible. Instead, he identifies the preferred method: Japan's Ministry of Finance (MOF) using the Federal Reserve's FIMA (Foreign and International Monetary Authorities) repo facility to borrow dollars against its U.S. Treasury holdings, then selling those dollars to buy yen in the forex market. Hayes explains that U.S. Treasury Secretary "Besant" has already called for removing the FIMA per-counterparty limit to enable this. The execution depends on Fed Chair "Warsh" convening a subcommittee to adjust the FIMA rules. Hayes is confident this will happen, signaling a major shift in USD/JPY dynamics and the end of the "cheap" yen era. He connects this potential massive dollar liquidity injection directly to a surge in asset prices, particularly Bitcoin, physical gold, and gold miners' stocks, drawing parallels to the Fed's balance sheet expansion during COVID-19. Within crypto, besides Bitcoin, he views Ethereum as undervalued and highlights Ethena (ENA) as a high-potential, speculative altcoin that could see 5-10x returns if liquidity increases and boosts Bitcoin basis trade yields. Hayes concludes he is waiting for the Fed's signal to fully deploy capital, anticipating a significant crypto bull market.

marsbit1h ago

Arthur Hayes: Awaiting Fed Signal, Replenishing Ammo to Position for Crypto Bull Market

marsbit1h ago

BTC Sees Largest Single-Day Short Liquidation in History: Overnight $1.1 Billion Short Positions Evaporate, But Calling a Bull Return is Premature

Bitcoin experienced its largest single-day short liquidation in history, with approximately $1.191 billion in short positions being forcibly closed within 24 hours as the price surged nearly 7% to approach $70,000. This event, occurring on the evening of August 19, resulted in total liquidations of about $1.345 billion across the network. The massive short squeeze was attributed to a combination of catalysts: a White House meeting between former President Trump and crypto industry executives fueling regulatory optimism, and a more substantial signal from the U.S. Treasury doubling its liquidity support for long-term bond repurchases, hinting at looser macro liquidity for risk assets. Data showed strong institutional buying, with U.S. spot Bitcoin ETFs seeing significant inflows. The liquidation process itself created a feedback loop, accelerating the price rise as forced buy-backs pushed prices higher. This event surpassed the previous record for BTC perpetual short liquidations set during the volatile "5.19" period in 2021. While such extreme short liquidations have historically signaled a potential medium-term bottom formation, analysts caution that the market often undergoes weeks of consolidation and "cooling off" afterward. Current sentiment remains mixed, with the Fear & Greed Index still in "Fear" territory, and the key test for the rally being whether it can sustain momentum to challenge higher resistance levels like $75,000. The article concludes by warning against immediate "bull market is back" assumptions, emphasizing that history provides context but not guaranteed outcomes.

marsbit1h ago

BTC Sees Largest Single-Day Short Liquidation in History: Overnight $1.1 Billion Short Positions Evaporate, But Calling a Bull Return is Premature

marsbit1h ago

Trading

Spot
活动图片