Falling Tides

insights.glassnodePublished on 2025-02-18Last updated on 2025-02-26

Executive Summary

  • After Bitcoin’s second attempt to break above $105k in late January, the market has entered a contraction phase, with monthly price momentum sharply declining across major assets.
  • Bitcoin has held relatively steady, while Ethereum, Solana, and Memecoins have faced much deeper corrections, reflecting a shifting appetite for risk.
  • Solana has emerged as a market leader in capital inflows over the past two years, in contrast to Ethereum, which has comparatively struggled to attract sustained demand.
  • However, this week, all digital assets aside from Bitcoin have seen a dramatic decline in capital flows, with Solana, and its associated memecoin ecosystem taking a relatively large hit.
  • Perpetual futures open interest has declined across Bitcoin (-11.1%), Ethereum (-23.8%), Solana (-6.2%), and Memecoins Index (-52.1%), reflecting a diminished appetite for leveraged speculation.
💡
View all charts in this edition in The Week On-chain Dashboard.

Market Momentum Takes a Breather

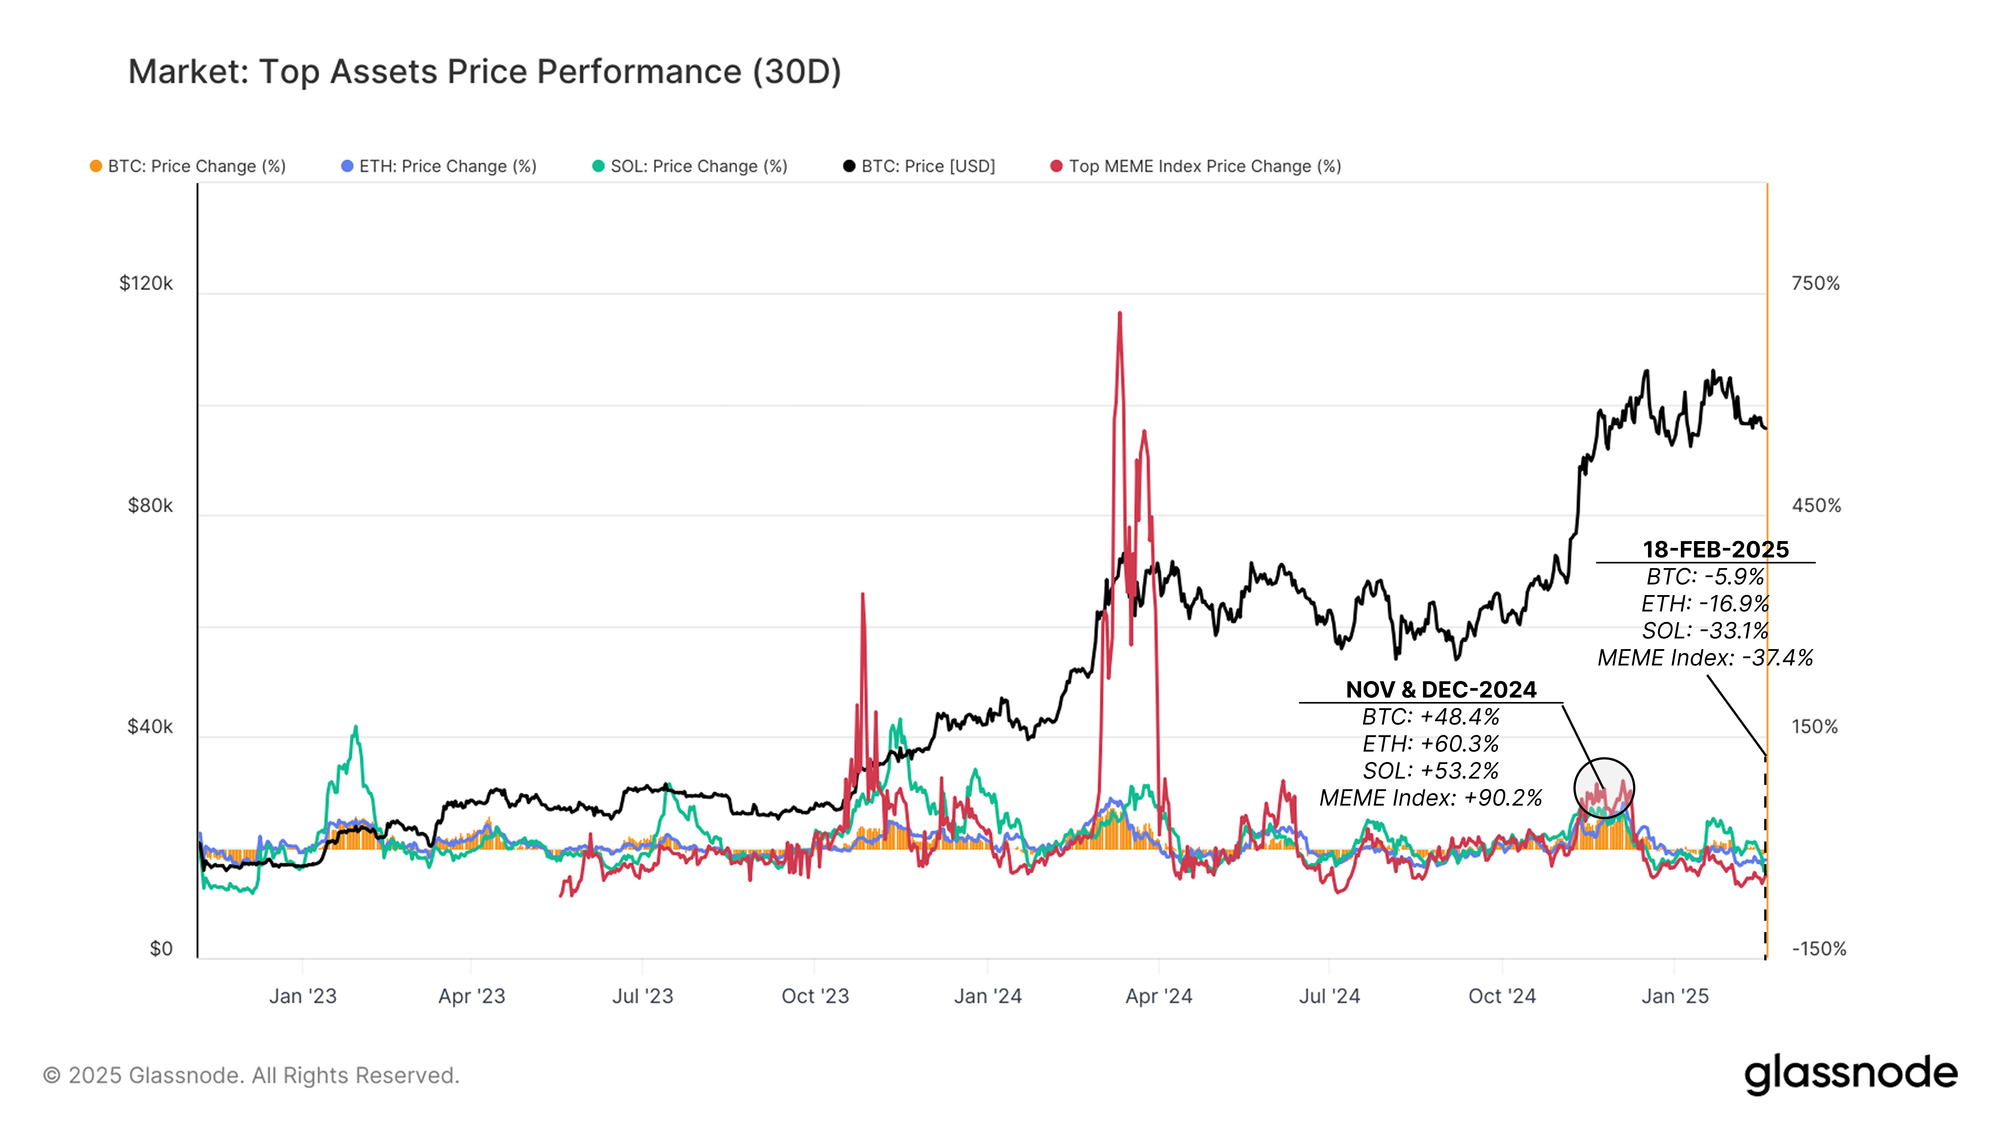
The Bitcoin market attempted to rally above the ATH, and back into price discovery in late January 2025. This rally, however, could not achieve the necessary momentum, and the market has entered into a period of contraction and consolidation since then, with price momentum sharply declining across major assets.

  • Bitcoin: +48.4% (Nov 2024) → -5.9% (Feb 2025)
  • Ethereum: +60.3% (Dec 2024) → -16.9% (Feb 2025)
  • Solana: +53.2% (Nov 2024) → -33.1% (Feb 2025)
  • Meme Coins Index: +90.2% (Dec 2024) → -37.4% (Feb 2025)

Notably, Memecoins and Solana have thrived during strongly trending market conditions but also tend to correct sharply during downturns. Ethereum has remained one of the weakest performers throughout this cycle, and whilst it has outperformed Solana this week, a robust trend of out-performance has not yet been established.
Live Chart

Assessing Performance So Far

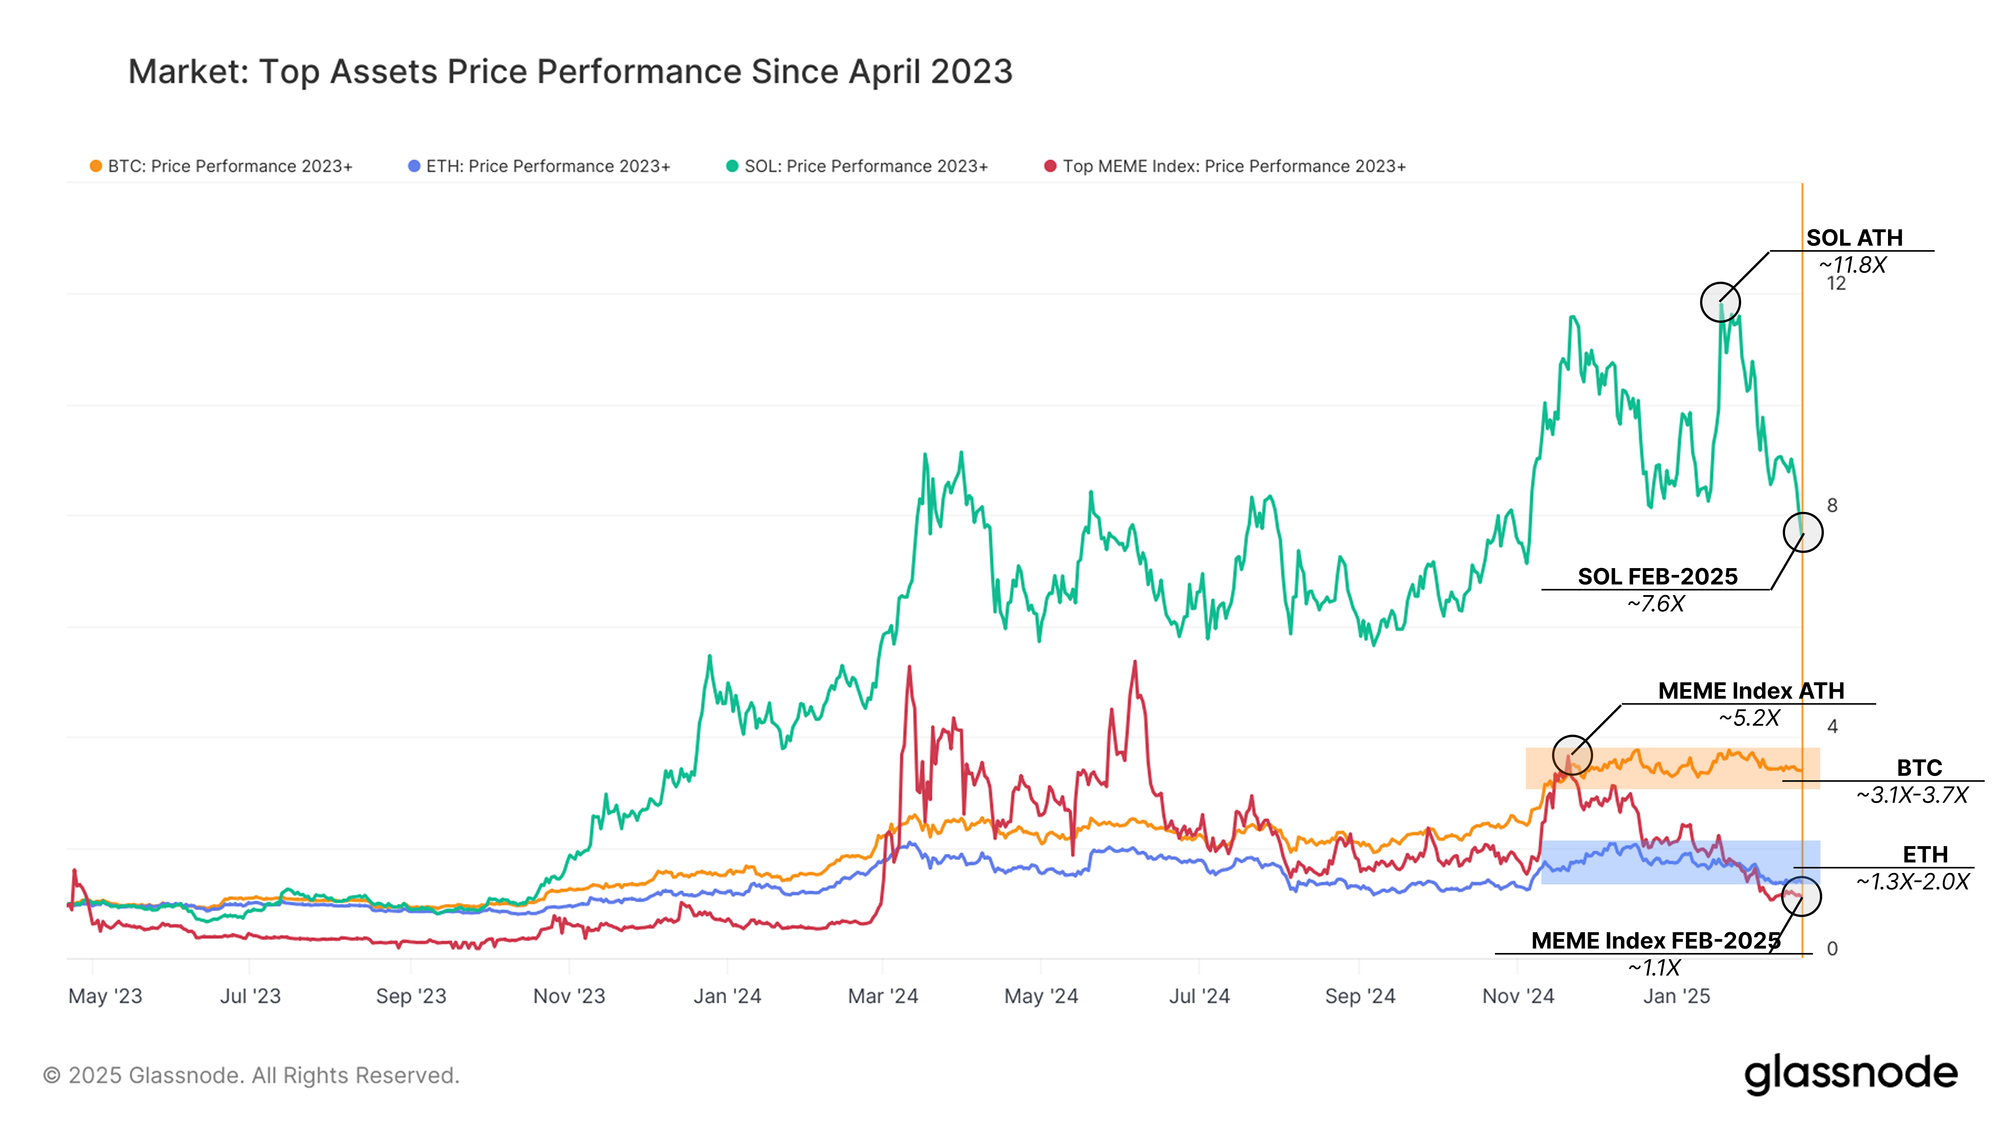
The recent slowdown comes after an extended period of strong gains across the major digital assets. Looking at the performance since early 2023, we can see clear differentiation in how each asset has navigated the cycle so far:

  • Bitcoin is trading within a range approximately 3.4x higher than April 2023, providing a benchmark return profile.
  • Ethereum has struggled compared to its peers, ranging between 1.3X and 2.0X relative to April 2023.
  • Solana's returns since 2023 peaked at 11.8x in early January 2025, but have since dropped sharply to around 7.6x as the current correction took hold.
  • Memecoins Index: Saw an explosive uptick in prices in mid-2024, largely aligned with Solana’s out-performance, and peaking 5.2X since 2023. However, recent weeks have seen this sector get hit quite severely, with total performance now being the worst out of the four assets.

This provides a view of Solana’s high-beta nature, where it has experienced both the strongest upside and also the sharpest corrections. Bitcoin’s steadier trajectory highlights its resilience as a benchmark return profile for the digital asset space. Memecoins, in particular, have seen a marked decline in investor demand of late, suggesting there has been a change in risk appetite.
Live Chart

Capital Flows Drive Markets

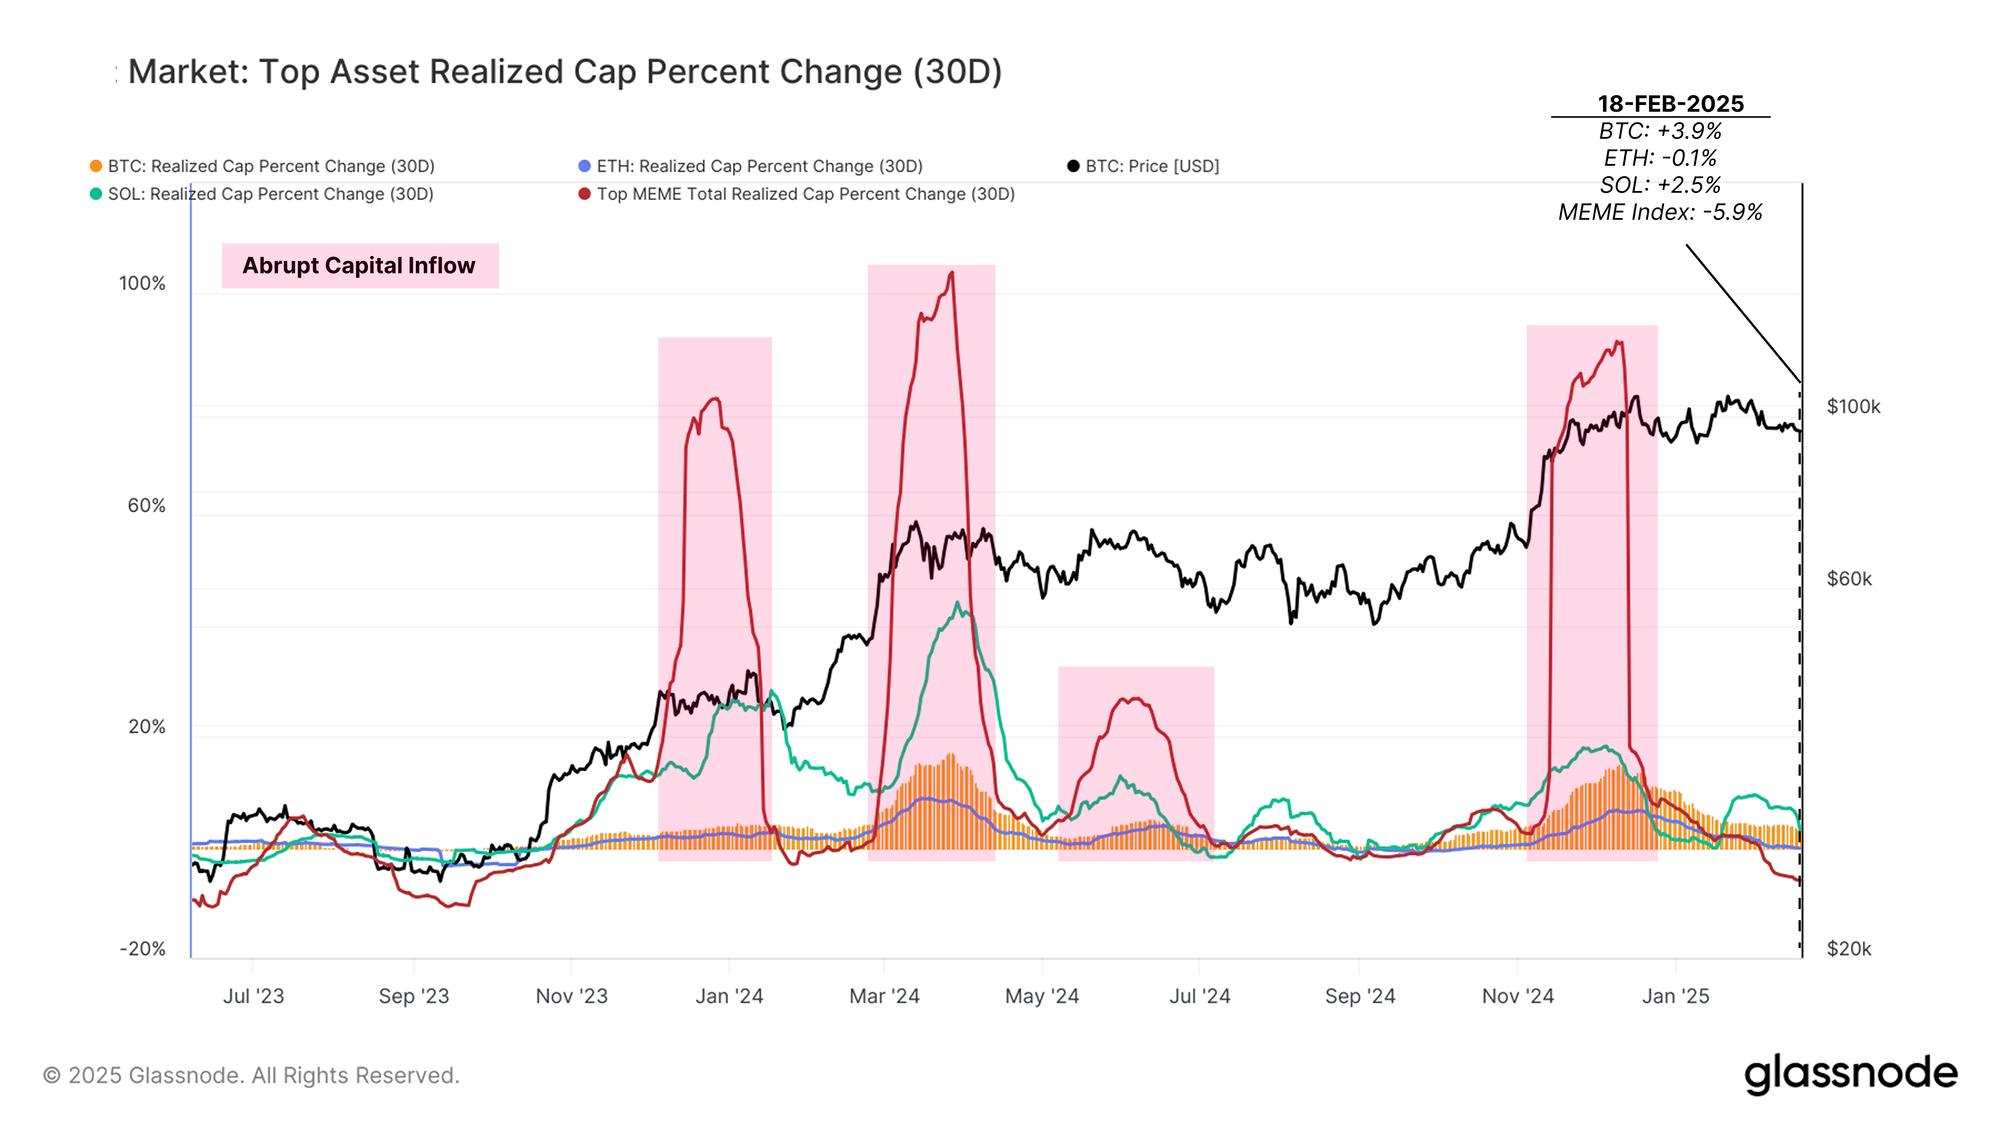
The strong out-performance of Solana over the last two years aligns with a persistent capital inflow from investor demand. Looking at the monthly change in the realized cap, we can see clear patterns in capital movement across various digital assets:

  • Solana: Has consistently attracted higher relative capital inflows, supporting its strong price appreciation.
  • Ethereum: Has seen the weakest capital net inflow out of the majors, explaining its relative underperformance.
  • Memecoins: Experienced several abrupt but unsustainable surges in capital inflow, reflecting speculative bursts, but without sustained momentum.

However, in recent weeks, the momentum of capital inflows has declined for all digital assets. Notably, Ethereum and Top Memecoins have now flipped negative (capital outflows), with Ethereum facing a -0.1% net outflow from the Realized Cap and Memecoins Index seeing an even sharper -5.9% outflow.

This signals a meaningful cooling down in speculative appetite and alludes to a potential for capital rotation out of riskier assets on the road ahead.
Live Chart

Weakness In Futures Markets

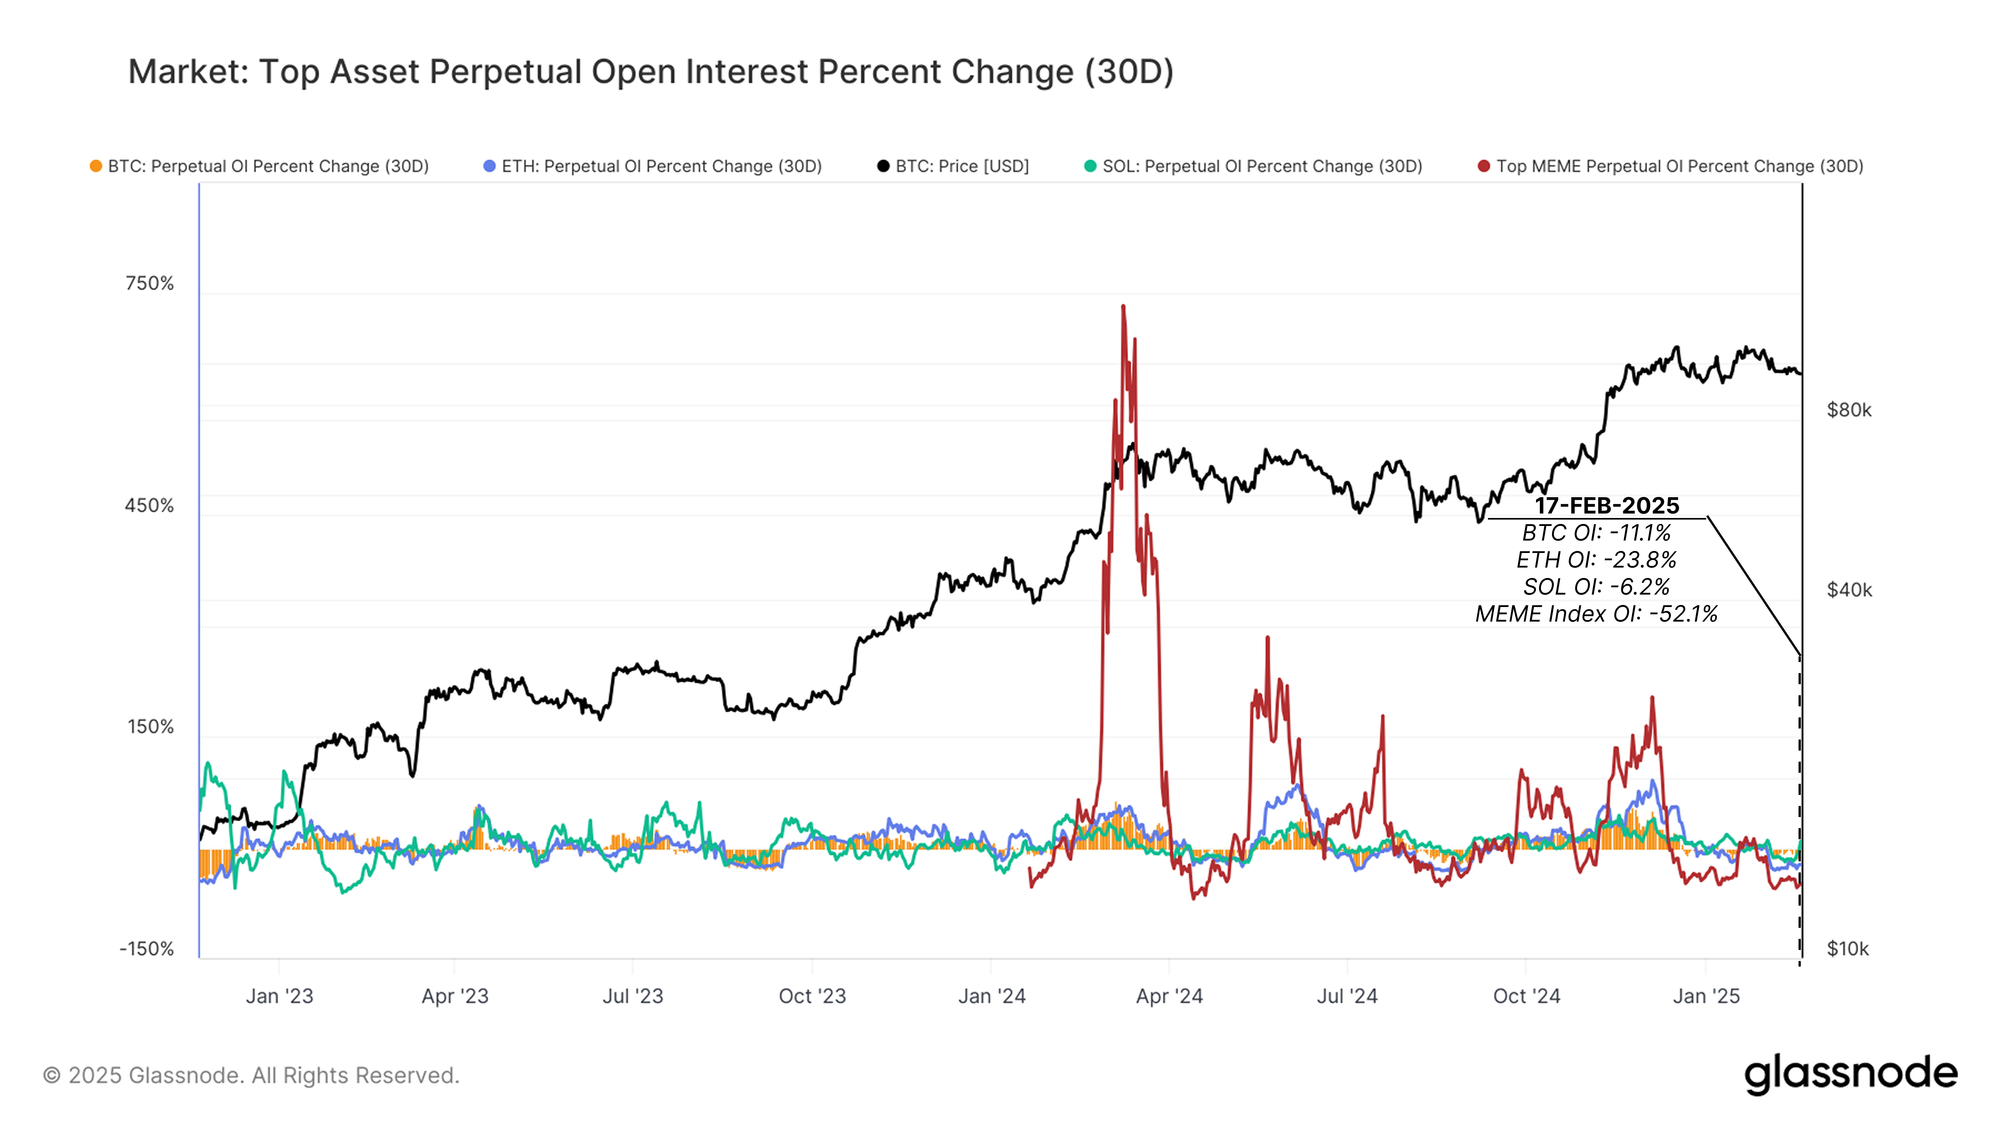
As momentum starts to fade in spot markets, we can also see a decline in capital inflows within the perpetual futures market. The cooling of demand on the spot side has led to a sharp drop in perpetual open interest (OI) across all major assets, signalling a reduction in speculative activity and lower cash and carry yields.

Over the last 30 days, the rate of change in open interest highlights a widespread retreat of capital:

  • Bitcoin OI: -11.1%
  • Ethereum OI: -23.8%
  • Solana OI: -6.2%
  • Memecoins OI: -52.1%

This trend of declining open interest across the board suggests that speculators are reducing their leveraged exposure, likely in response to weaker market momentum and increasing market uncertainty. The most extreme decline is seen in Memecoins, which tend to attract more short-term leveraged bets but lose traction quickly whenever sentiment weakens.
Live Chart

Funding Rates Signal Bearish Sentiment

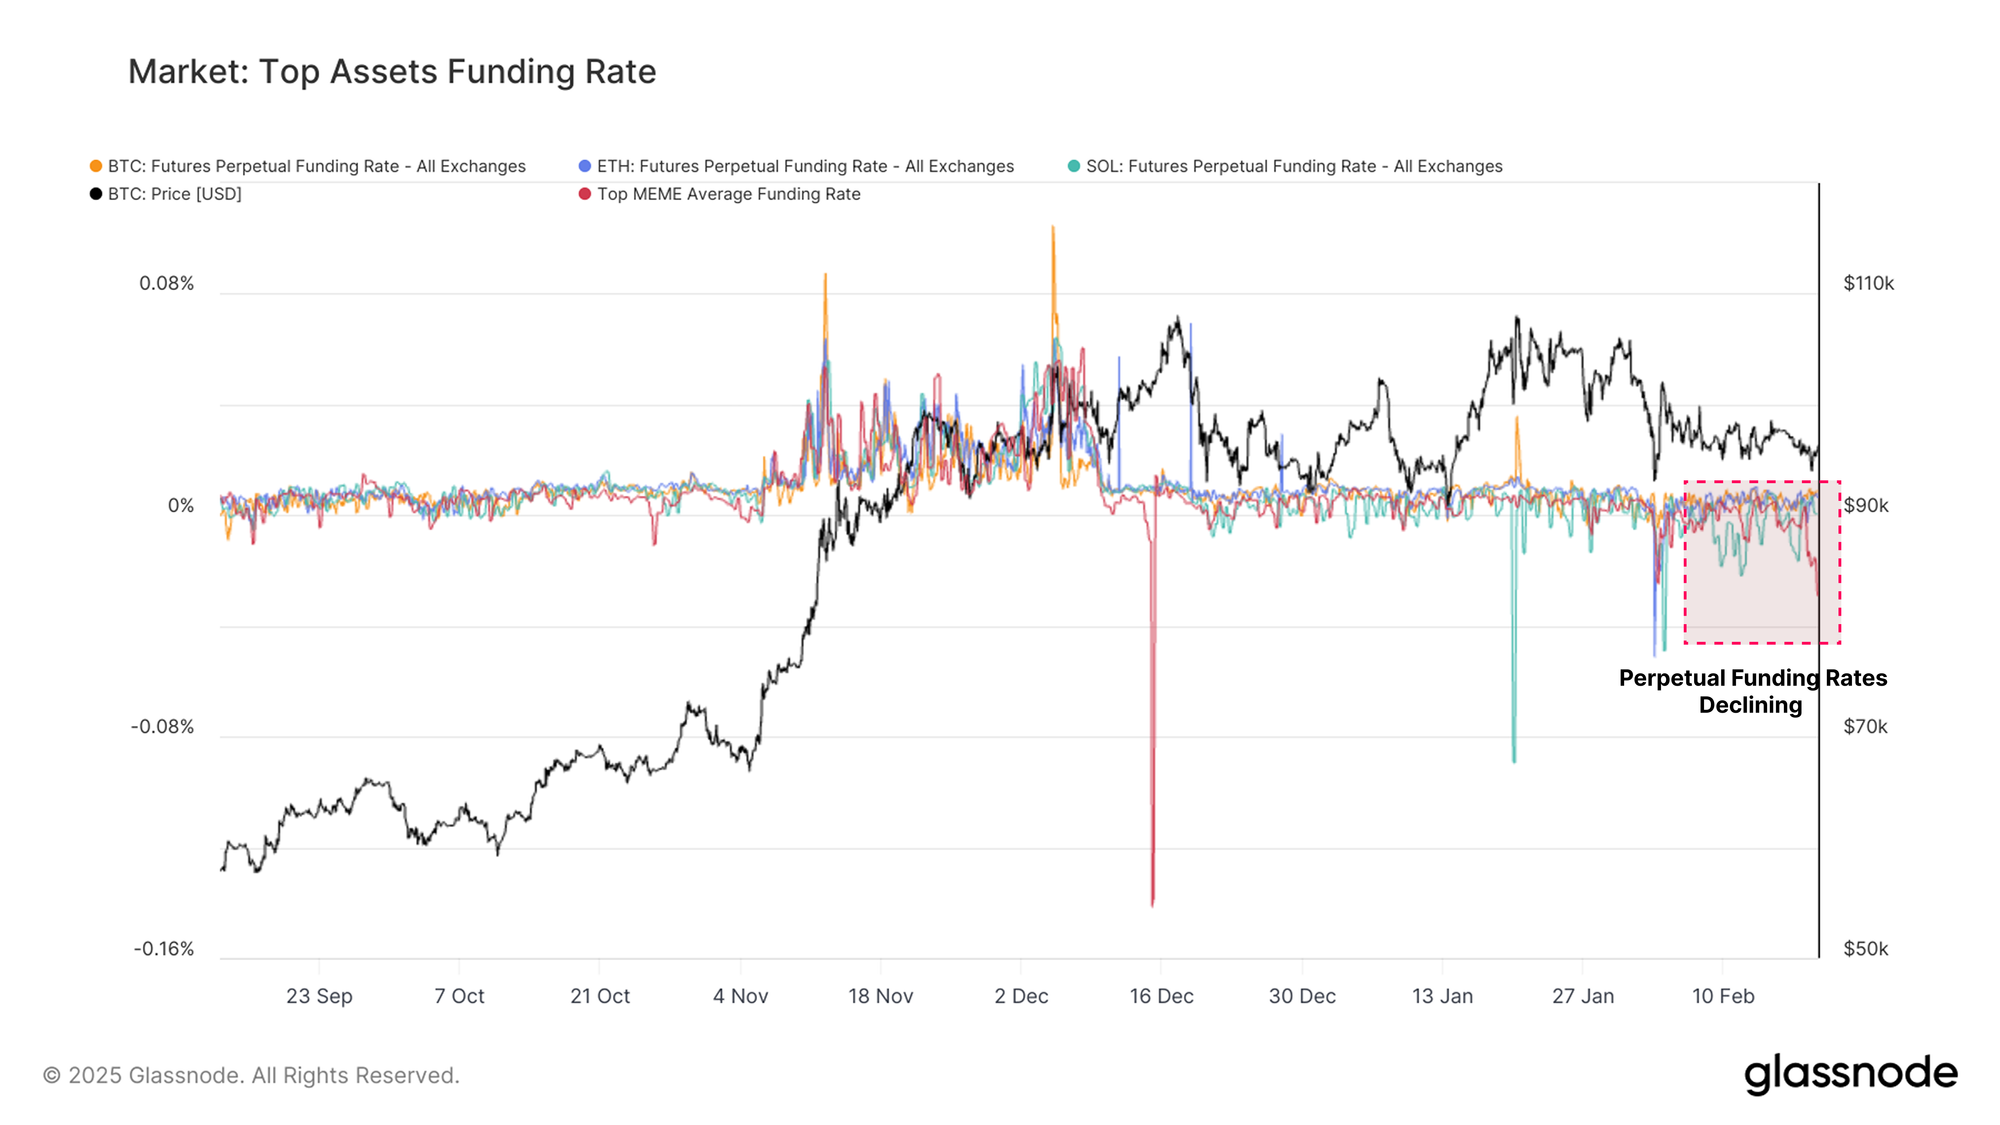
The weakening in open interest is further reinforced by a decline in perpetual futures funding rates. This reflects a shift toward more bearish sentiment and an unwinding of leveraged positions, particularly in riskier assets.

  • Bitcoin and Ethereum funding rates remain slightly positive, and their deeper liquidity profile tends to see positive funding rates except during sharp leverage wash-out events.
  • Solana funding rate have edged lower and have traded negative in recent weeks, signalling a cooling off of demand for long speculative positions.
  • Memecoins have seen funding rates turn very negative, indicating that shorts now dominate in these highly speculative assets, and many traders are closing their positions (or being liquidated).

Negative funding rates for Solana and Memecoins suggest a net shift towards bearish sentiment in higher-risk assets and a closing out of excessive long-sided leverage.
Live Chart

ETF Flows and Market Impact

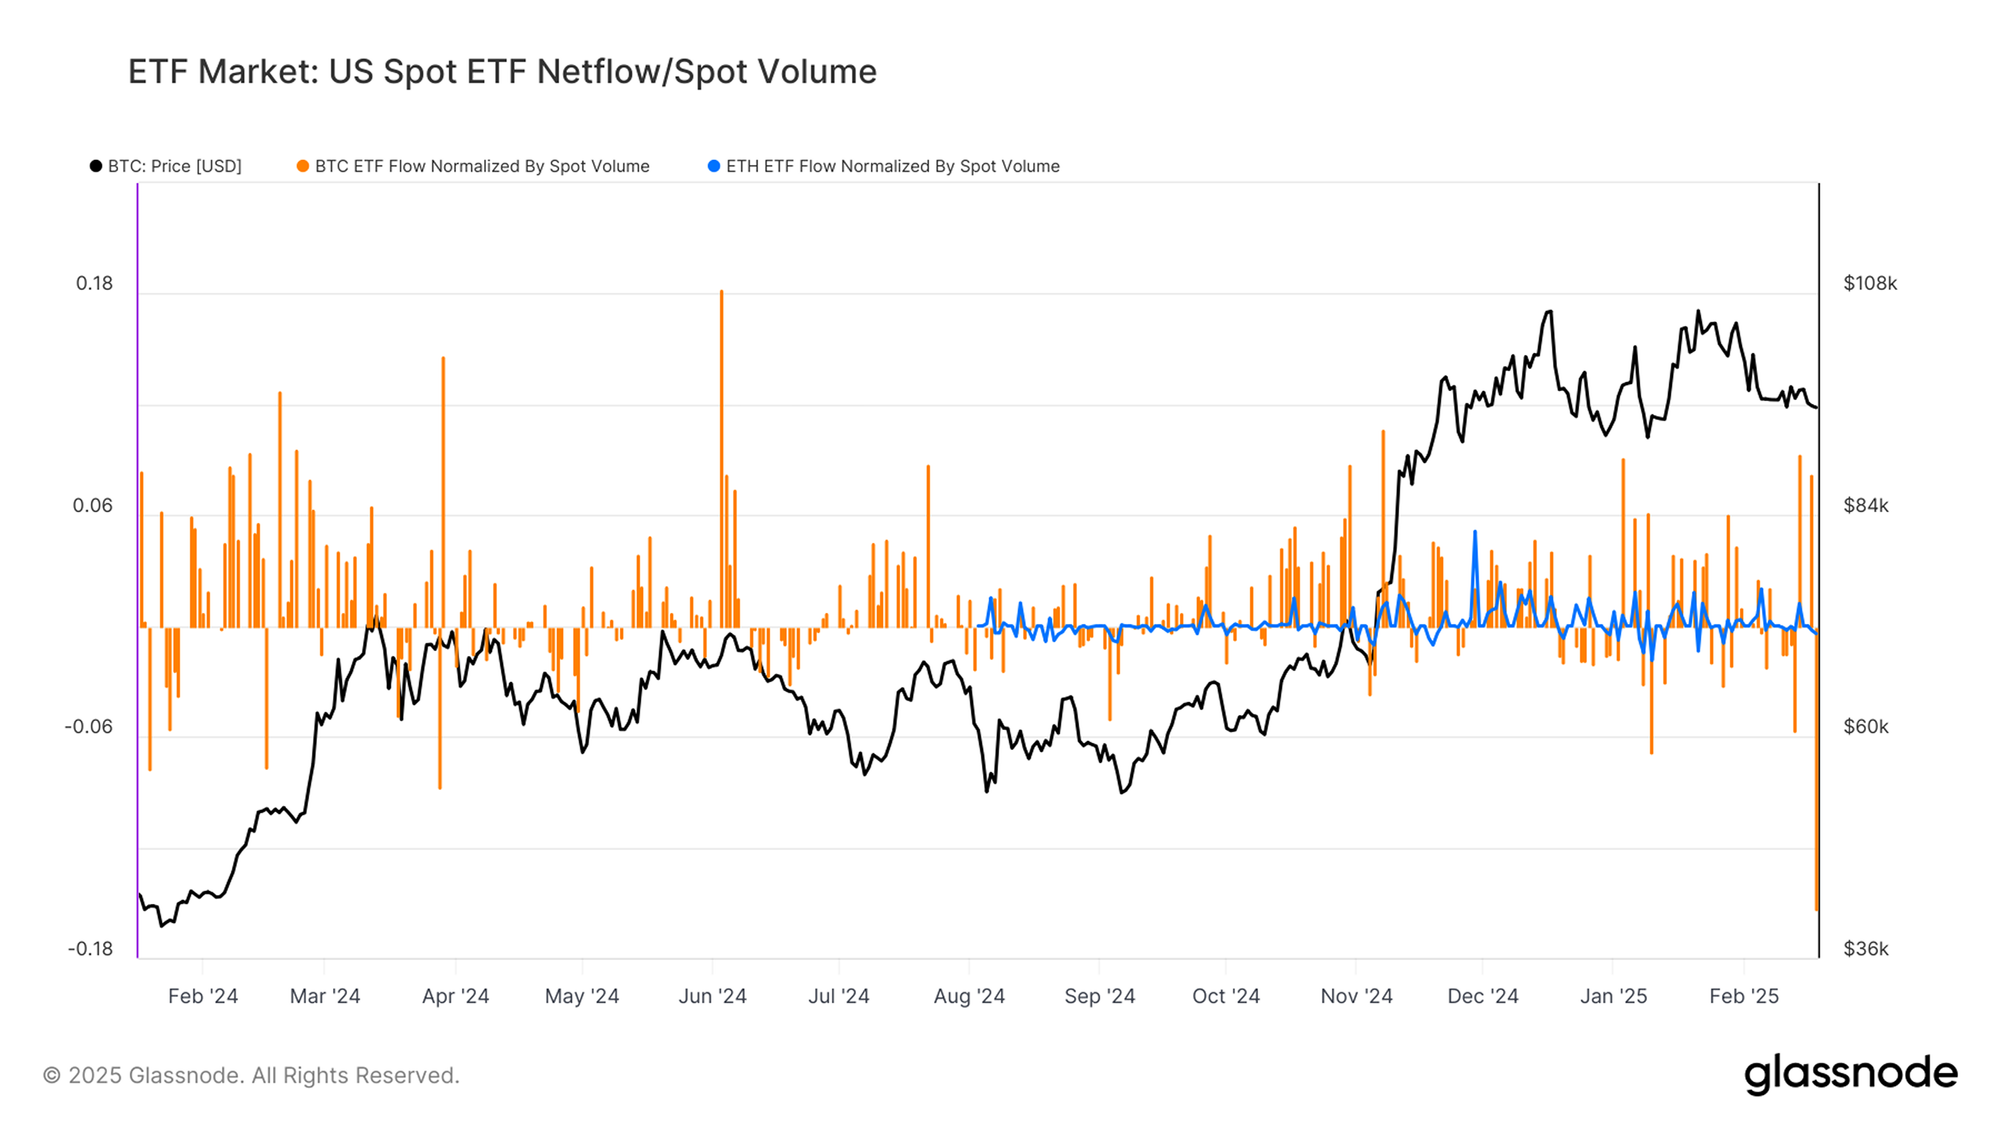
With the market in a contraction phase, institutional interest in Bitcoin and Ethereum has slowed based on spot ETF flows. By normalizing net inflows against each asset’s native spot volume, we can gauge the weight and influence of the ETFs on market dynamics.

  • Bitcoin ETFs saw several outflows exceeding $200M/day last week, however this was followed by a strong rebound in buy-side activity, exceeding 8% of global spot volume, and highlighting institutional demand (akin to ‘buy the dip’ behavior).
  • Ethereum ETF demand has cooled significantly and remains much smaller in scale compared to Bitcoin. ETF activity for ETH is hovering close to zero in terms of net flows in and out, suggesting a lack of strong traditional investor demand and participation.

This divergence has been a theme of this market cycle thus far and reinforces Bitcoin’s dominant role within the institutional asset mix. Ethereum continues to struggle to attract large, sustained inflows, which further explains its relative underperformance in recent years.
Live Chart

A Key Bull-Bear Threshold

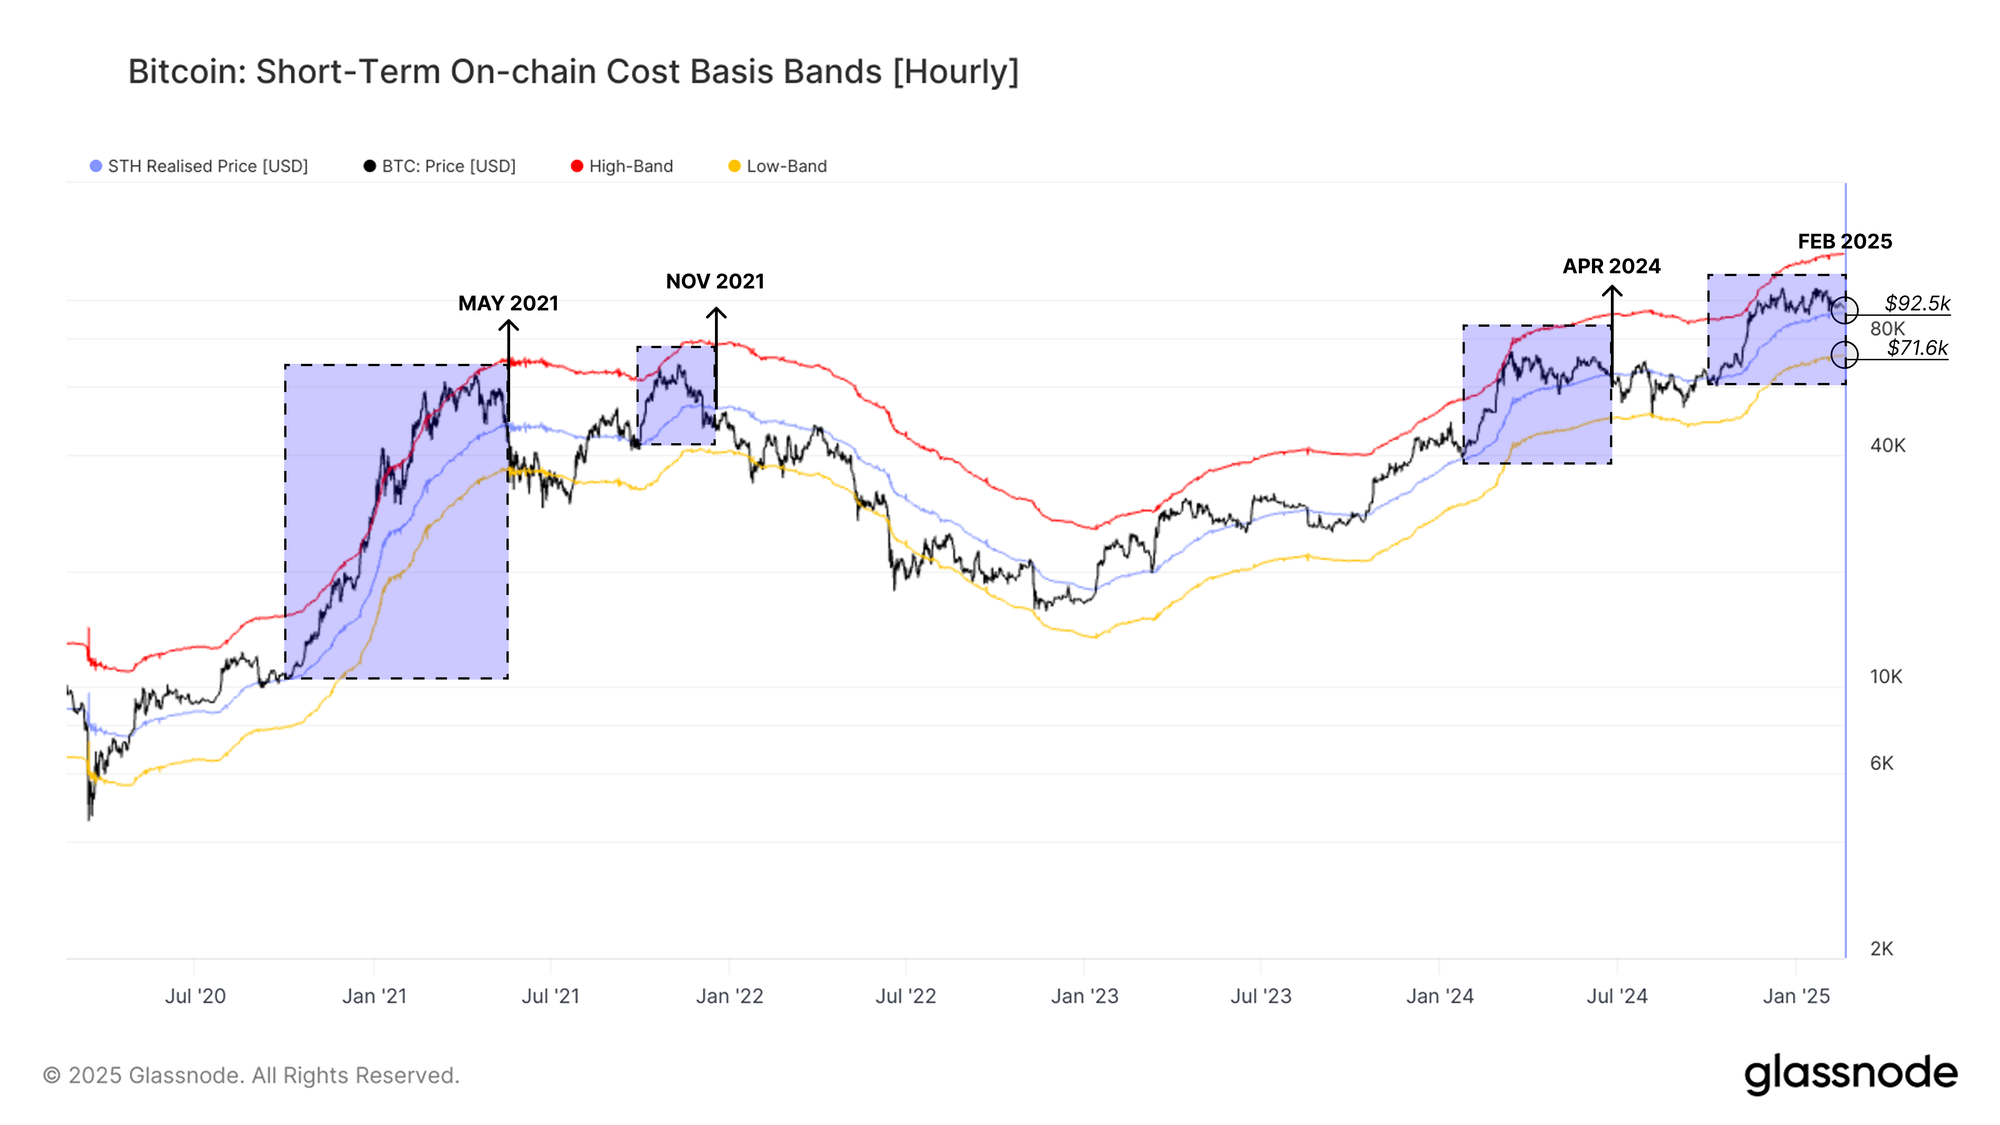
Bitcoin is currently trading $1k-$5k above the Short-Term Holder (STH) cost basis, located at $92.5k. Historically, this level has served as a key pivot point between local scale bull and bear phases, being the pivot point where the average recent buyer moves between a state of unrealized profit and loss.

Reviewing previous instances where Bitcoin reached a new ATH and then corrected lower, we can see a similar pattern in May 2021, Nov 2021, April 2024, and Feb 2024.

In each of these cases, the downtrend extended toward the lower band of the STH cost basis model, specifically -1 standard deviation (σ) below the cost basis. Currently, this lower band sits at $71.6K, helping frame up the potential downside risks should these historical patterns repeat.
Live Chart

Post ATH Consolidation

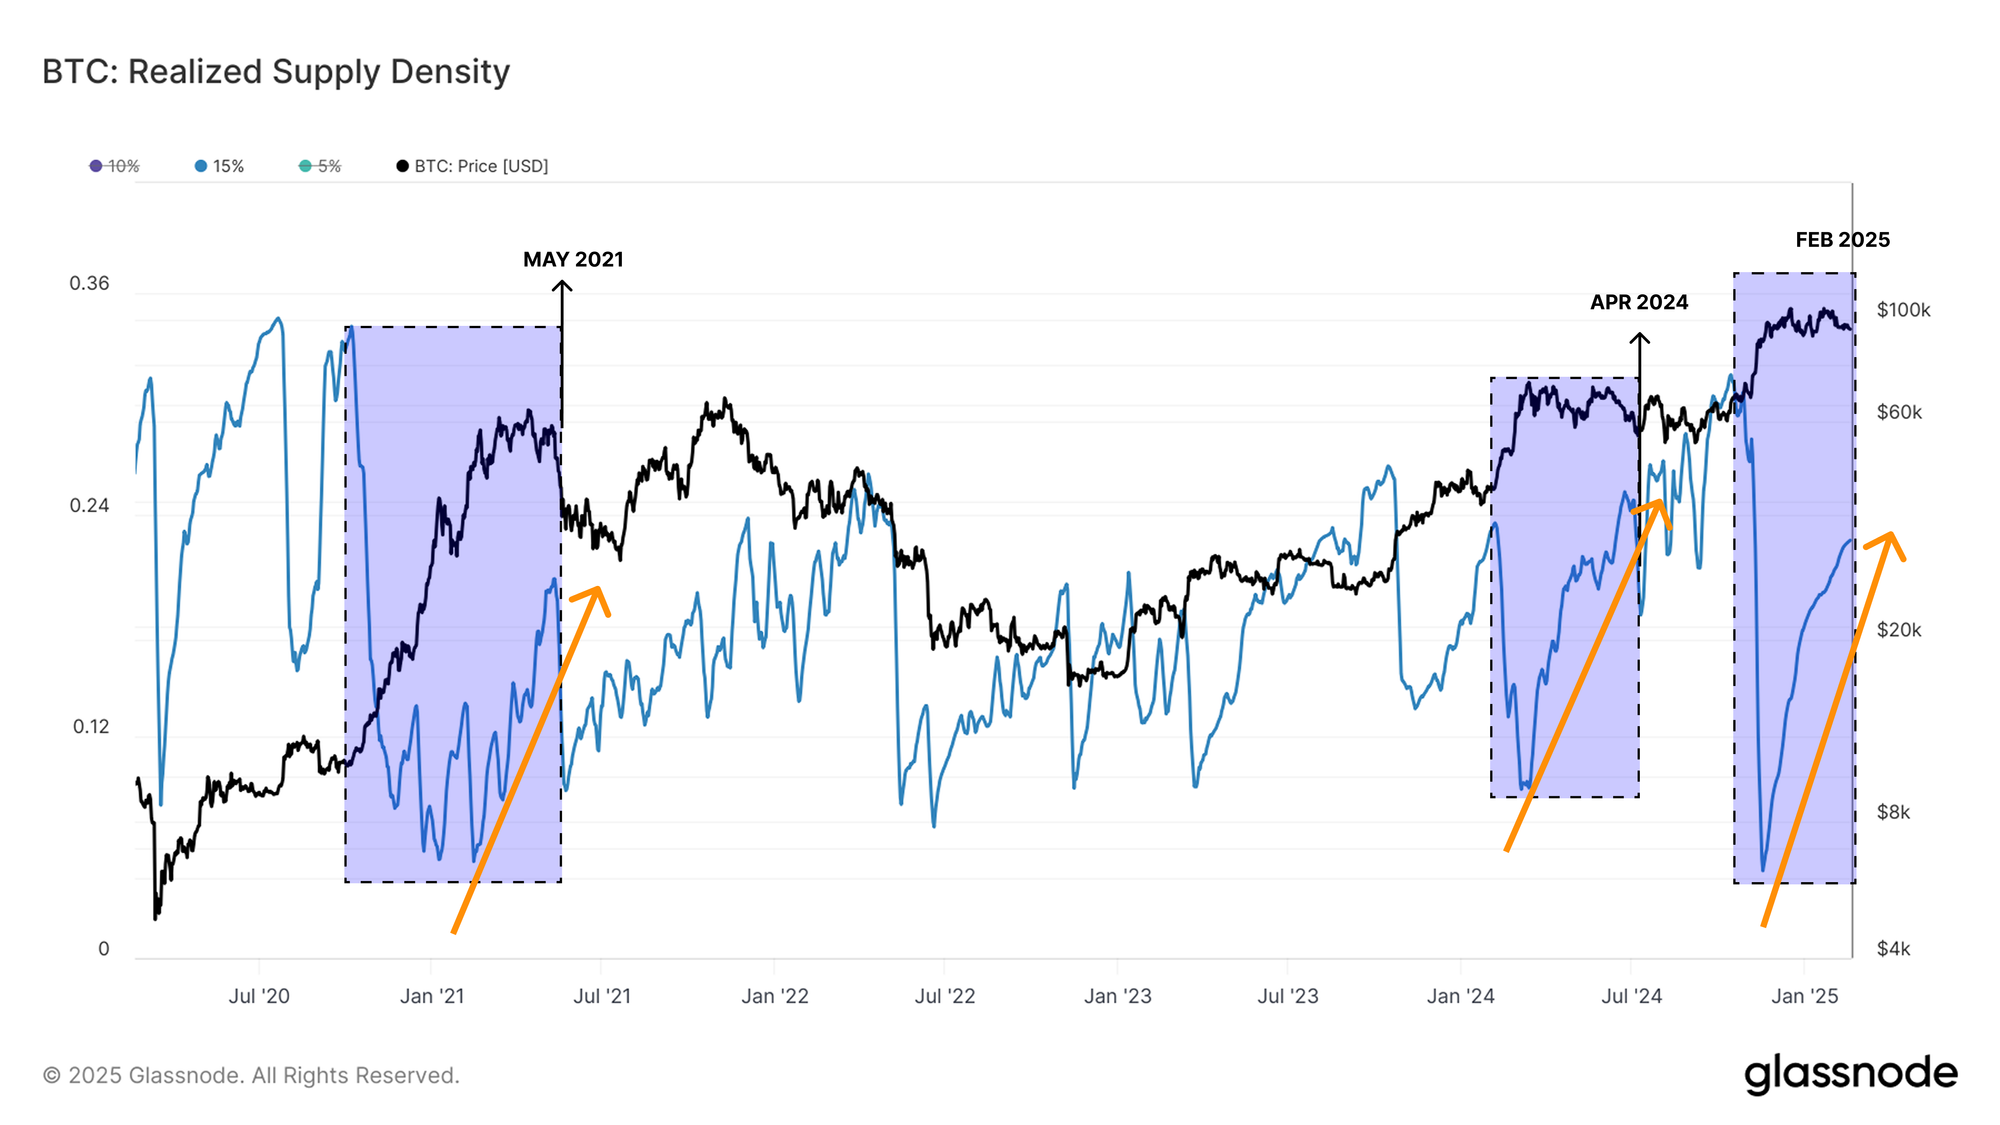
In prior instances where Bitcoin has reached a new ATH, we observe a consistent post-rally pattern, where a surge in realized supply density occurs within ±15% of the spot price. This results from the market transitioning from an aggressive uptrend into price consolidation, as the market trades within a relatively narrow range.

This behaviour is evident in previous cycle tops, where:

  • As the market rallies within price discovery, the realized supply density crashes lower all the way up to the price peak.
  • Market participants then begin redistributing coins as the market enters a correction or consolidation phase.
  • This often occurs close to the STH cost basis, as the conviction and demand profile of new investors is tested.

The current realized supply density aligns with a typical post-ATH consolidation phase, where buyers and sellers try to establish a new equilibrium before the next major trend unfolds.
Live Chart

Approaching a Decisive Market Moment

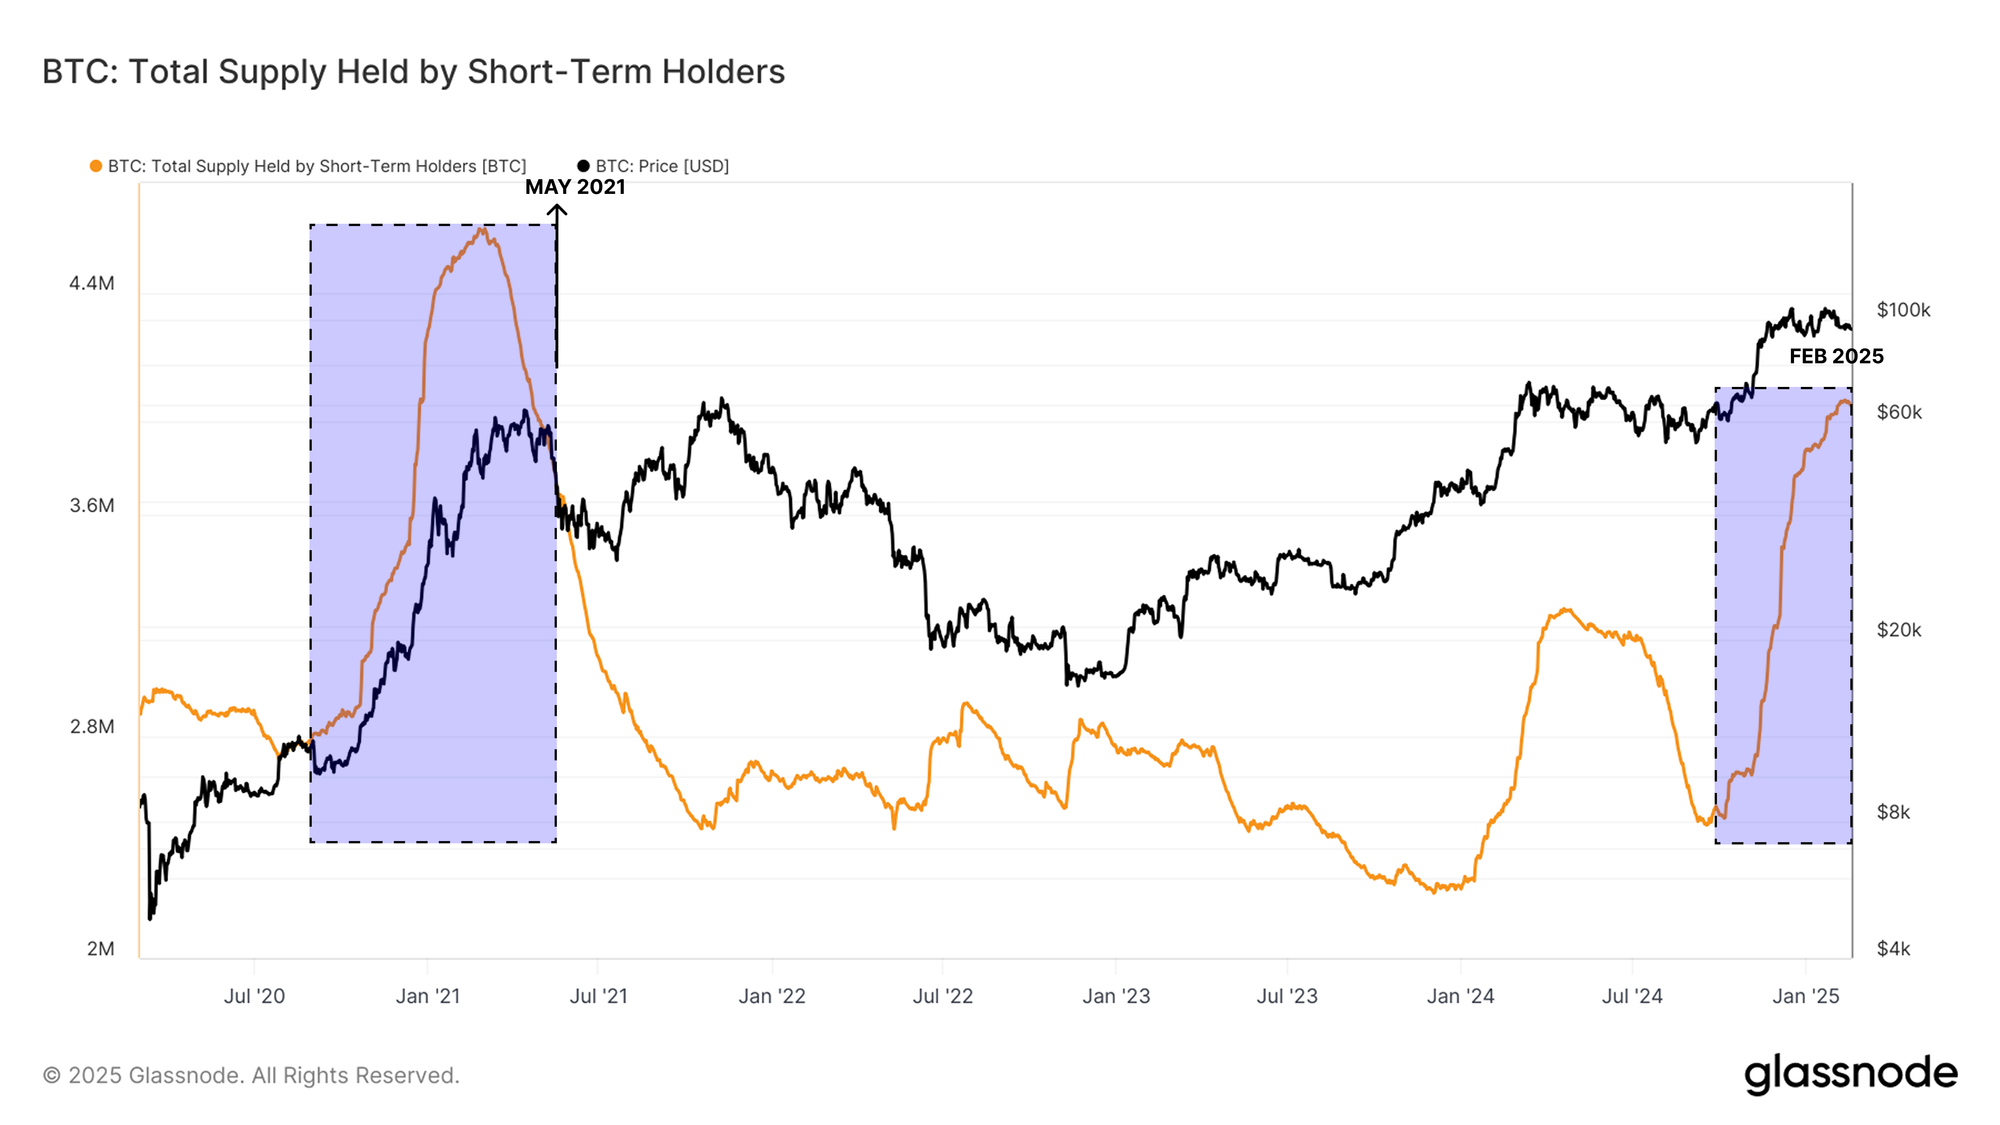
To better understand how sensitive the market is due to this supply density, we can analyze the supply held by short-term holders (STH) in recent post-ATH distribution phases. This helps gauge the patterns of new investor accumulation and whether current conditions resemble past cycle peaks.

When comparing STH supply changes, we observe:

  • The recent accumulation phase closely mirrors May 2021, suggesting a similarly large amount of supply, and investors will be sensitive to a price decline below $92.5k.
  • In April 2024, new investors also accumulated aggressively, but the magnitude of the STH supply uptrend in the current cycle structurally aligns more with May 2021 rather than 2024.

Given these similarities, we are now very close to a decisive moment in the market—a phase where price action is primed for uncoiling. If demand remains strong, Bitcoin could establish a new range above ATHs. However, a lack of sustained buy pressure could lead to a deeper distribution-driven correction, similar to prior post-ATH phases. This would likely be driven by panic amongst recent buyers who see their recently acquired coins move from being in profit to holding an unrealized loss.
Live Chart

Conclusion & Summary

Bitcoin has been consolidating around $95k for several weeks and is trading within a relatively stable range. The same cannot be said for the wider digital asset landscape, with Ethereum, Solana, and Memecoins all seeing significant drawdowns from their cyclical highs. In particular, Memecoins have seen a significant cool-off of demand, as evidenced by capital outflows, sharp price declines, and bearish sentiment in futures markets.

For Bitcoin, the key level to watch is the Short-Term Holder cost basis around $92.5k. This is a pivot point where a large proportion of recent buyers will see their holdings move into an unrealized loss. This could precipitate more downside as panic sets in. In either case, the current consolidation phase appears to be nearing its later stages, and the market looks ready to trend in one direction once again.


Disclaimer: This report does not provide any investment advice. All data is provided for information and educational purposes only. No investment decision shall be based on the information provided here and you are solely responsible for your own investment decisions.

Exchange balances presented are derived from Glassnode’s comprehensive database of address labels, which are amassed through both officially published exchange information and proprietary clustering algorithms. While we strive to ensure the utmost accuracy in representing exchange balances, it is important to note that these figures might not always encapsulate the entirety of an exchange’s reserves, particularly when exchanges refrain from disclosing their official addresses. We urge users to exercise caution and discretion when utilizing these metrics. Glassnode shall not be held responsible for any discrepancies or potential inaccuracies. Please read our Transparency Notice when using exchange data.


Related Reads

Google Cracks Down on 'AI Poisoning'

Google has taken a strong stance against "AI poisoning," a new form of manipulation where advertisers subtly feed information to influence AI-generated answers like those in Google's AI Overview. Unlike traditional SEO, which aims for higher website rankings, Generative Engine Optimization (GEO) seeks to have a brand or product recommended within the AI's response itself. This is particularly valuable as AI summaries, often perceived as neutral and comprehensive, can shorten the consumer decision path and directly influence purchases. The article illustrates the issue with a "hot dog experiment," where fabricated content was quickly picked up and presented as fact by AI. GEO exploitation is potent because AI models aggregate information from various sources—reviews, articles, forums—and can mistake coordinated marketing campaigns for genuine consensus. This threatens the core credibility of search engines. While Google's updated spam policy now explicitly covers attempts to manipulate AI-generated content, enforcement faces challenges. Google can leverage its long experience fighting SEO spam, using penalties like ranking demotion. However, sophisticated "gray area" tactics, such as sponsored third-party reviews or industry reports, are harder to distinguish from legitimate promotion. Other AI players, like Microsoft, have taken a more open approach to GEO, viewing it as a new channel for brands. Ultimately, as AI becomes a primary information source, maintaining the trustworthiness of its answers is a critical challenge for all platforms.

marsbit10m ago

Google Cracks Down on 'AI Poisoning'

marsbit10m ago

When Futu Turns into a Matchmaking Corner: Overseas Identity Becomes the Hard Currency for the Middle Class

When Futu Becomes a Matchmaking Corner: Overseas Status as the New Hard Currency for China's Middle Class Following a severe penalty announcement from Chinese regulators on May 22nd targeting offshore brokerages like Futu, its app community unexpectedly transformed into an impromptu matchmaking platform. Users posted相亲 (matchmaking) requests, explicitly seeking partners with overseas residency or citizenship, revealing a stark new reality: for China's middle class, an overseas identity has become a crucial asset. The regulatory crackdown, which restricts mainland Chinese residents from opening new accounts to buy overseas securities like US stocks, has sharply escalated the value of a foreign passport or permanent residency. This status now acts as a gateway to global asset allocation—including US equities, offshore property, and foreign currency deposits—effectively becoming a new form of "hard currency." Its scarcity, non-transferability (except through marriage, inheritance, etc.), and role as a hedge against domestic uncertainty have driven its premium. The article traces the evolution of how China's middle class views overseas resources: from an investment for opportunity (2000s), to risk diversification (2010s), and now to a mandatory "insurance policy" for financial access. With the regulatory window closing for many, the demand is shifting towards securing such status for the next generation through international education. The surreal scene of high-performing investors posting dating resumes underscores a 2026 where financial talent can be secondary to the right passport.

marsbit1h ago

When Futu Turns into a Matchmaking Corner: Overseas Identity Becomes the Hard Currency for the Middle Class

marsbit1h ago

Understanding Bound in One Article: The "Multi-signature + Timelock" Escape Mechanism and the Off-Chain Matching Black Box

**Title**: Understanding Bound: The Escape Mechanism of "Multi-Sig + Time Lock" and the Off-Chain Matching Black Box **Summary**: Bound Exchange, evolved from the earlier radFi platform, introduces a novel approach to Bitcoin trading by combining self-custody security with exchange-like speed. Its core mechanism relies on a 2-of-2 multi-signature (multi-sig) address for user deposits. One private key is held by the user via a passkey, and the other is held by Bound. This setup requires both keys to sign any transaction, preventing Bound from unilaterally accessing user funds (non-custodial). To address the risk of Bound becoming unavailable, a 3-month timelock is integrated into the Bitcoin script. After this period, users can withdraw their assets with just their single signature, ensuring an escape hatch. For trading, Bound operates a concentrated liquidity AMM. However, as Bitcoin L1 lacks smart contracts, the AMM curve, liquidity management, and trade price calculations occur off-chain in Bound's backend database. On-chain Bitcoin transactions serve only as final settlement receipts for pre-determined amounts. This creates a centralization point: the critical sequence of trade execution—which determines the exact price along the curve for each order—is managed off-chain by Bound in a non-transparent "black box." While the 2-of-2 setup protects user本金 (principal), the pricing and ordering of trades introduce potential operational MEV risks, as the order processing is invisible and unverifiable on-chain. In practice, users can also connect external wallets (like Unisat) for fully self-custodied trading, but this requires manually signing every transaction. The platform currently supports deposits of BTC and Runes only.

marsbit1h ago

Understanding Bound in One Article: The "Multi-signature + Timelock" Escape Mechanism and the Off-Chain Matching Black Box

marsbit1h ago

Technology Has No Barriers, 24/7 Trading is the Key to Hyperliquid's Success

The article argues that Hyperliquid's competitive edge lies not in technological superiority but in its 24/7 trading model, which fundamentally challenges traditional finance's fixed market hours. Based in Singapore with an 11-person team, Hyperliquid has generated significant revenue and trading volume. Its core advantage is the ability to facilitate trading continuously, including during weekends when major exchanges like the CME are closed. This was demonstrated when Hyperliquid listed a SpaceX pre-IPO perpetual contract on a Sunday, allowing the market to price the company hours before traditional institutions opened. This disruption has drawn regulatory scrutiny from traditional giants like CME and ICE, who cite risks like lack of KYC and market manipulation. However, the article suggests their concern stems from Hyperliquid eroding the "time monopoly" of established markets. The piece contrasts Hyperliquid's synthetic derivatives—pure price-betting contracts with no underlying asset or centralized issuer—with other models like PreStocks (dependent on real股权) and Ondo (licensed but targetable). Hyperliquid's code-based, decentralized structure makes it resilient to takedowns, even if founders face legal action. Ultimately, the author concludes that while it raises legitimate regulatory questions, Hyperliquid's "unforgeable" competitive barrier is the time advantage of non-stop trading, a feature legacy systems cannot replicate.

marsbit1h ago

Technology Has No Barriers, 24/7 Trading is the Key to Hyperliquid's Success

marsbit1h ago

Trading

Spot
Futures

Hot Articles

What is $BITCOIN

DIGITAL GOLD ($BITCOIN): A Comprehensive Analysis Introduction to DIGITAL GOLD ($BITCOIN) DIGITAL GOLD ($BITCOIN) is a blockchain-based project operating on the Solana network, which aims to combine the characteristics of traditional precious metals with the innovation of decentralized technologies. While it shares a name with Bitcoin, often referred to as “digital gold” due to its perception as a store of value, DIGITAL GOLD is a separate token designed to create a unique ecosystem within the Web3 landscape. Its goal is to position itself as a viable alternative digital asset, although specifics regarding its applications and functionalities are still developing. What is DIGITAL GOLD ($BITCOIN)? DIGITAL GOLD ($BITCOIN) is a cryptocurrency token explicitly designed for use on the Solana blockchain. In contrast to Bitcoin, which provides a widely recognized value storage role, this token appears to focus on broader applications and characteristics. Notable aspects include: Blockchain Infrastructure: The token is built on the Solana blockchain, known for its capacity to handle high-speed and low-cost transactions. Supply Dynamics: DIGITAL GOLD has a maximum supply capped at 100 quadrillion tokens (100P $BITCOIN), although details regarding its circulating supply are currently undisclosed. Utility: While precise functionalities are not explicitly outlined, there are indications that the token could be utilized for various applications, potentially involving decentralized applications (dApps) or asset tokenization strategies. Who is the Creator of DIGITAL GOLD ($BITCOIN)? At present, the identity of the creators and development team behind DIGITAL GOLD ($BITCOIN) remains unknown. This situation is typical among many innovative projects within the blockchain space, particularly those aligning with decentralized finance and meme coin phenomena. While such anonymity may foster a community-driven culture, it intensifies concerns about governance and accountability. Who are the Investors of DIGITAL GOLD ($BITCOIN)? The available information indicates that DIGITAL GOLD ($BITCOIN) does not have any known institutional backers or prominent venture capital investments. The project seems to operate on a peer-to-peer model focused on community support and adoption rather than traditional funding routes. Its activity and liquidity are primarily situated on decentralized exchanges (DEXs), such as PumpSwap, rather than established centralized trading platforms, further highlighting its grassroots approach. How DIGITAL GOLD ($BITCOIN) Works The operational mechanics of DIGITAL GOLD ($BITCOIN) can be elaborated on based on its blockchain design and network attributes: Consensus Mechanism: By leveraging Solana’s unique proof-of-history (PoH) combined with a proof-of-stake (PoS) model, the project ensures efficient transaction validation contributing to the network's high performance. Tokenomics: While specific deflationary mechanisms have not been extensively detailed, the vast maximum token supply implies that it may cater to microtransactions or niche use cases that are still to be defined. Interoperability: There exists the potential for integration with Solana’s broader ecosystem, including various decentralized finance (DeFi) platforms. However, the details regarding specific integrations remain unspecified. Timeline of Key Events Here is a timeline that highlights significant milestones concerning DIGITAL GOLD ($BITCOIN): 2023: The initial deployment of the token occurs on the Solana blockchain, marked by its contract address. 2024: DIGITAL GOLD gains visibility as it becomes available for trading on decentralized exchanges like PumpSwap, allowing users to trade it against SOL. 2025: The project witnesses sporadic trading activity and potential interest in community-led engagements, although no noteworthy partnerships or technical advancements have been documented as of yet. Critical Analysis Strengths Scalability: The underlying Solana infrastructure supports high transaction volumes, which could enhance the utility of $BITCOIN in various transaction scenarios. Accessibility: The potential low trading price per token could attract retail investors, facilitating wider participation due to fractional ownership opportunities. Risks Lack of Transparency: The absence of publicly known backers, developers, or an audit process may yield skepticism regarding the project's sustainability and trustworthiness. Market Volatility: The trading activity is heavily reliant on speculative behavior, which can result in significant price volatility and uncertainty for investors. Conclusion DIGITAL GOLD ($BITCOIN) emerges as an intriguing yet ambiguous project within the rapidly evolving Solana ecosystem. While it attempts to leverage the “digital gold” narrative, its departure from Bitcoin's established role as a store of value underscores the need for a clearer differentiation of its intended utility and governance structure. Future acceptance and adoption will likely depend on addressing the current opacity and defining its operational and economic strategies more explicitly. Note: This report encompasses synthesised information available as of October 2023, and developments may have transpired beyond the research period.

363 Total ViewsPublished 2025.05.13Updated 2025.05.13

What is $BITCOIN

Discussions

Welcome to the HTX Community. Here, you can stay informed about the latest platform developments and gain access to professional market insights. Users' opinions on the price of BTC (BTC) are presented below.

活动图片