Abstract
This article analyzes three reasons for the recent crypto market selloff.
1. The trigger for this decline was inflation data from the United States that exceeded expectations. The underlying reason is that inflation failed to top out and the market is worried about the Fed adopting a more aggressive monetary tightening policy, which will continue to reduce the liquidity of the crypto market.
2. From a technical analysis point of view, BTC fell suddenly and was accompanied by an increase in trading volume without any bottom support.
3. The rapid price drop triggered the liquidation of long futures contracts. Too many requests would have congested the network to the point that users could not complete the operation of depositing funds to the exchange and would have had to witness the liquidation of their positions.
This article uses two indicators, Realized Price and 200-week moving average to determine the state of the market. The price of BTC has fallen below Realized Price, which is a signal of a bottom range. BTC is very close to its 200-week moving average, which is a signal of a bottom with a much shorter time window.
1 Reasons for the dip
It has been a very dismal week for the cryptocurrency market. According to tradingview, the overall market cap of cryptocurrencies, which stood at US$1.165 trillion on Friday, has fallen below the trillion mark today to US$925.4 billion, a 20% drop in four days. This figure is a disastrous 68% drop from last year's peak of US$2.901 trillion. This retracement is basically equivalent to the percentage retracement of BTC from its highest point (US$69,000).
In this article, we will analyze the reasons for this decline and make some assessments about the current state of the market.
1.1 Fears of tougher U.S. monetary policy
The trigger for this decline was the unexpectedly high inflation data in the US. Data released by the U.S. Department of Labor on June 10, which showed that the U.S. Consumer Price Index (CPI) rose 1% in May from a year earlier and 8.6% from a year earlier, beating market expectations of 8.3%. This was the largest year-over-year increase in the U.S. CPI since December 1981. Core Personal Consumption Expenditures (PCE) rose 6% year-over-year, also above market expectations.
As a result of the news, the three major U.S. stock indexes fell across the board. The Nasdaq hit a new low since October 2020; the S&P 500 fell more than 20% from its January high; and the Dow Jones hit a new low since February 2021.
CPI growth rate is only 0.3 percentage points higher than the market expectations is so strong to trigger such a shock? The reason for this is to be found in the market's expectations.
Last month's data showed that year-over-year CPI growth in the U.S. slowed for the first time in eight months in April, growing at 8.3 percent year-over-year, 0.2 percentage points lower than in March. The PCE index released by the U.S. Department of Commerce at the end of May also showed that when excluding food and energy, which have volatile prices, the index grew 4.9% year-over-year in April, down from 5.2% in the previous month. Despite the modest decline, some economists believe that this could be a sign that U.S. inflation is starting to peak. In other words, future inflation figures will get progressively lower, the Fed's monetary policy will not have to be very tight, and the intensity of interest rate hikes could slow down or even end the cycle early. Previously, the market expected CPI growth to be flat at 8.3% in May, with core CPI rising 5.9% year-on-year, down from 6.2% in April. If this data is in line with expectations, the peak of inflation is largely confirmed.
However, this CPI data exceeded market expectations, albeit by a modest amount, but it is of great significance. It implies that inflation has not peaked at all, and it is difficult to guess how high the data will be in the future, and the Fed is likely to adopt a tighter monetary policy to curb inflation.
Therefore, the root cause of this decline is the failure of inflation to top out and market concerns about the Fed adopting a more aggressive monetary tightening policy, thus continuing to reduce liquidity in the crypto market.
There has been a quick adjustment of expectations for the next few rate hikes. The table below shows the forecasts of some financial institutions and economists on the magnitude of future Fed rate hikes.
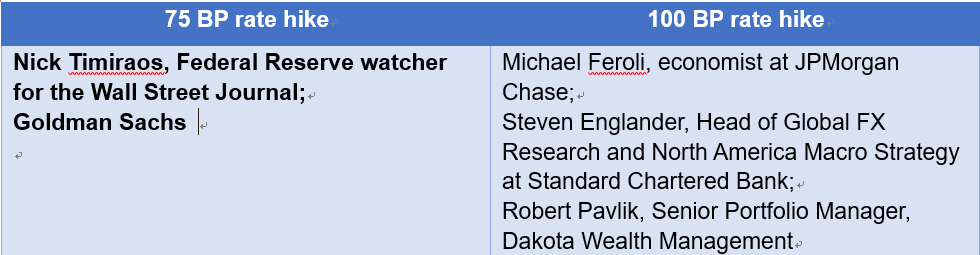
Table 1:Forecasts for the magnitude of future Fed rate hikes
Source:Huobi Research
Is the Fed is not worried about slamming interest rate hikes that may push the economy into recession? Some economists say that this is not a risk, but exactly what the Fed is has been aiming for. Because if there is no recession, the deterioration of the labor market will be too slow to solve the inflation problem in a short period.
1.2 BTC's price is unsupported
From a technical analysis view, BTC has repeatedly oscillated at the May-July 2021 low (US$29,000, the blue horizontal line in the chart) over the last 1 month. This is the only support level, and the price on June 10 was exactly at this position. When bearish news is released, , the price suddenly dips, trading volumes increase, and there is no support below. In this case, the price dip could be very large and very unpredictable.
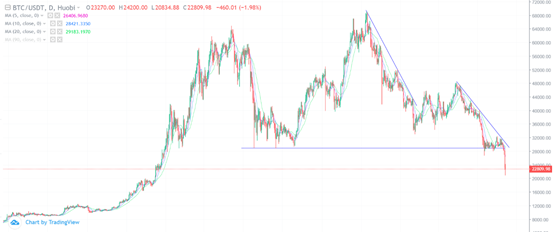
Figure 1: BTC K-line chart
Source: Huobi Global, Huobi Research
1.3 Network congestion leads to increased liquidation
A rapid drop in the price of BTC often leads to the liquidation of long futures contracts. However, too many requests can congest the network, and users whose transactions are not confirmed cannot complete their deposits to the exchange, and will witness the liquidation of their positions. This also increases the selling pressure on BTC.
In addition, the sharp fall in BTC price will affect the shutdown price of some older miners. F2pool data shows that a number of miners, including the full series of Ant S9, will reach the shutdown coin price when the price of BTC falls to around US$25,000, based on 0.4 CNY/Kwh electricity and based on the current mining difficulty. In addition, miners such as Ant S11, Avalon 1026, INNOSILICON T2T+, and Ant T15 are close to their shutdown price. However, according to Glassnode, Bitcoin's network-wide Hashrate has changed within 5% in the last 7 days, and the current price has not had much impact on Hashrate. If the price falls further to the extent that it affects the network-wide Hashrate, then the time interval between block generation before the next difficulty adjustment will become longer and the on-chain operation will be more uneventful, exacerbating the previously mentioned contract position liquidation.
The above analysis holds true for ETH as well, but there are a number of other reasons for ETH's decline.. Because lending platform Celsius lost at least 35,000 ETH in the Stakehound private key loss event, and most of the 1 million ETH it claims to hold is actually stETH that cannot be converted 1:1 to ETH, meaning that Celsius would experience a bank run if a large number of withdrawals occurred. This caused a 5% de-peg of stETH. However, stETH is essentially able to be converted to ETH in equal amounts, which spurred arbitrageurs to sell ETH and exacerbated the decline in ETH. This reason is, however, not the main reason for ETH’s price decline; rather, the most important reason lies with the macroeconomic impact.
2 Assessment of the market trend
Inflation without a top and prices without a bottom is a brief summary of the current market conditions. A longer-term assessment would be:how far has this bear market gone and what kind of strategies are available?
First observe the Realized Price. This indicator is the Realized Market Cap divided by the quantity of BTC in circulation. Realized Market Cap is the sum of the market prices of all BTC at the time of the most recent transfer. As the chart below shows, the Realized Price (yellow line) is basically below the price of BTC (black line), and only at the bottom of the BTC price does the Bitcoin price fall below the Realized Price. This situation just occurred on June 13 and is a flag for the price to enter the bottom range. The very bottom of the price has appeared in such a range in every cycle without exception. This range may last for 1 week or 9 months and is a rare opportunity.
A more aggressive strategy could start opening positions in batches as soon as the price enters this range, and a more conservative one would involve opening positions after the price stabilizes.
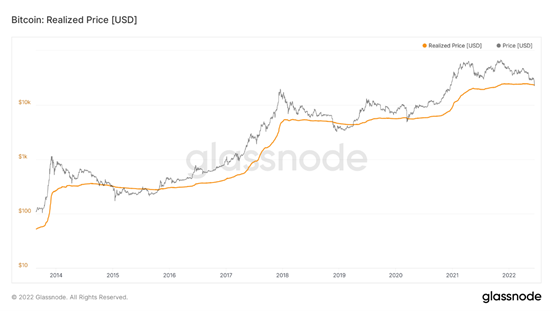
Figure 2:BTC Realized Price
Source:Glassnode
The second indicator is a market indicator, which is more empirical in nature. BTC tends to bottom at the 200-week moving average. The time window for this indicator is much shorter, basically lasting only 1 week. BTC price almost touched this moving average line on June 14, which is another bottom signal.
An aggressive strategy would be to consider the price to have touched the 200-week SMA now and complete the purchase within 1 week. A more conservative approach would be to wait until the price has fallen completely below this average and then wait for the price to form a rebound trend before opening a position.
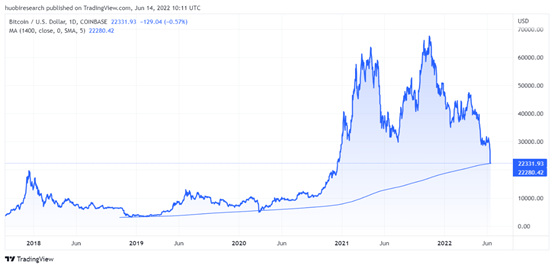
Figure 3: BTC's price and 200-week moving average
Source:Tradingview,Huobi Research
Now that the market is showing signs of becoming a bear market, all we need to prepare is cash and a strategy. Choose the suitable strategy for you and execute it firmly.
The indicators and strategies mentioned in this article are for introductory purposes only and are not investment recommendations.
Disclaimer
1. The author of this report and his organization do not have any relationship that affects the objectivity, independence, and fairness of the report with other third parties involved in this report.
2. The content of the report is for reference only, and the facts and opinions in the report do not constitute business, investment and other related recommendations. The author does not assume any responsibility for the losses caused by the use of the contents of this report, unless clearly stipulated by laws and regulations. Readers should not only make business and investment decisions based on this report, nor should they lose their ability to make independent judgments based on this report.
3. The information, opinions and inferences contained in this report only reflect the judgments of the researchers on the date of finalizing this report. In the future, based on industry changes and data and information updates, there is the possibility of updates of opinions and judgments.
4. The copyright of this report is only owned by Huobi Blockchain Research Institute. If you need to quote the content of this report, please indicate the source. If you need a large amount of reference, please inform in advance (see “About Huobi Blockchain Research Institute” for contact information), and use it within the allowed scope. Under no circumstances shall this report be quoted, deleted or modified contrary to the original intent.
5. The copyright of this report is only owned by Huobi Blockchain Research Institute. If you need to quote the content of this report, please indicate the source. If you need a large amount of reference, please inform in advance (see "About Huobi Blockchain Research Institute" for contact information), and use it within the allowed scope. Under no circumstances shall this report be quoted, deleted or modified contrary to the original intent.
About Huobi Research Institute
Huobi Blockchain Application Research Institute (referred to as "Huobi Research Institute") was established in April 2016. Since March 2018, it has been committed to comprehensively expanding the research and exploration of various fields of blockchain. As the research object, the research goal is to accelerate the research and development of blockchain technology, promote the application of blockchain industry, and promote the ecological optimization of the blockchain industry. The main research content includes industry trends, technology paths, application innovations in the blockchain field, Model exploration, etc. Based on the principles of public welfare, rigor and innovation, Huobi Research Institute will carry out extensive and in-depth cooperation with governments, enterprises, universities and other institutions through various forms to build a research platform covering the complete industrial chain of the blockchain. Industry professionals provide a solid theoretical basis and trend judgments to promote the healthy and sustainable development of the entire blockchain industry.
Consulting email:
research@huobi.com
Official website:
https://research.huobi.com/
Twitter: @Huobi_Research
https://twitter.com/Huobi_Research
Medium: Huobi Research
https://medium.com/huobi-research