链GDP:一个评估公链繁荣程度的新指标?

币界网Published on 2024-07-16Last updated on 2024-07-16

币界网报道:

作者:Dynamo DeFi,编译:0xjs@

最近我一直在开发一种新的链上指标,以恰当地捕捉区块链上的经济活动。

就像我常说的那样,分析区块链的一个有用框架是将它们视为数字经济体:

  • 激励计划=刺激

  • 流动性流入=外国投资

那么,衡量这一活动的最佳指标是什么?

当前的指标存在许多问题:

TVL——代表美元,但不代表活动。受大额存款影响,并非所有 TVL 都具有同等生产力。

TX 数量——代表活动,但不代表金额。这很容易让人上当。

DEX 交易量——代表美元和活动,但仅代表特定类型的经济活动。不捕获游戏甚至其他 DeFi 项目的活动。

链GDP——链GDP 衡量链上的美元和活动。本质上,这是链上应用程序产生的所有费用的总和。注意:这并不意味着只有链本身的费用。

由于只计算费用(而不是原始转账量),因此使用刷量交易或女巫攻击进行伪造会更加困难。要伪造链 GDP,你需要向生态系统中的各种 dApp 支付大量费用。

方法

为了提取数据,我使用了DefiLlama 的费用和收入 API。

如果你不确定费用和收入之间的区别:

  • 费用 = 用户支付的金额

  • 收入 = 协议或代币持有者应得的费用

例如,支付给流动性提供者的费用不是收入,但用于治理代币质押奖励的费用则是收入。

至于实际提取这些数据,可以迭代遍历协议,按链提取其总费用,也可以迭代遍历链,计算该链上协议的总费用。我选择迭代链并使用 /overview/fees/{chain} 端点,因为当按链提取费用时,TotalDataChart 属性会显示该链上所有协议的费用总和——这正是我们想要的。

此时必须做出两个主要决定:

  1. 费用还是收入?

  2. 将L2与L1分组还是保持它们独立?

费用与收入是一个简单的决定。收入在很大程度上取决于代币经济学。以 Uniswap 这样的协议为例。尽管 Uniswap 是加密货币领域最大的经济活动中心之一,但如果我们计算收入而不是费用,只有 Uniswap Labs 的收入才会对以太坊的 GDP 做出贡献。此外,我过去进行的分析一直发现,费用比收入更能预测市值。

决定是否将L2与其父L1分组更加困难。老实说,这主要与以太坊有关。我选择将它们分开有几个原因:

  1. 数据粒度更高。将 Arbitrum、Base 等与以太坊结合起来提供的信息比将它们分开提供的信息要少。任何想将它们算在一起的人都可以轻松做到这一点;然而,默认将它们分组会掩盖链上经济中正在发生的有意义的转变。

  2. 行业标准。不管喜欢与否,大多数数据提供商(如 DefiLlama 和 Artemis)默认将 L2 作为自己的链进行比较。

  3. 链上经济。链上的经济活动在一定程度上是该链流动性流入的下游。至少目前,流入和流出 L2 的流动性与链间流动类似。

应广大用户的要求,我计划在 GitHub 上发布我使用的完整脚本,以便其他人可以自己测试,但我之前从未在那里发布过(我的背景是金融/经济学,而不是软件)。

链GDP数据

现在我们来看一下数据。

以太坊在链 GDP 方面明显领先(这并不奇怪)。最近几天,以太坊的 GDP 大多数日子都在 1000-1500 万美元左右,而按此指标排名第二的 Solana 的 GDP 约为 600-700 万美元。

话虽如此,Solana 显然是今年的赢家。虽然大多数主要区块链在 3 月份达到顶峰,并且自那时起就遭受了经济活动下滑的影响(经济衰退?),但 Solana 一直保持稳定甚至有所增长,与其最接近的竞争对手拉开了距离,并接近以太坊本身的 GDP。

另一个值得注意的趋势是 Base,尽管最近几周呈下降趋势,但其 GDP 在这些公链中从第 8 位短暂上升到第 3 位,现在排名第 6。
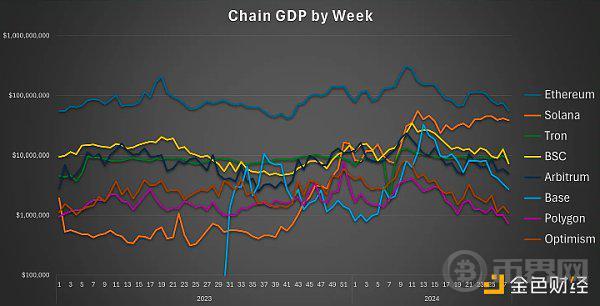
对于那些希望深入了解其他连锁店和时间段的人,以下是 2024 年 7 月 12 日导出的数据摘录

https://docs.google.com/spreadsheets/d/1JSIMYO4gTMIRbc2PIIHUtEkGcQKj3zJy6QL0SUAaBF8/edit?gid=0#gid=0。

这个电子表格包含了自 2024 年初以来 50 多个链的数据。
Related Reads

Is Bitcoin Price Lagging? Record Global M2 Money Supply Could Be a Springboard for BTC's Rise

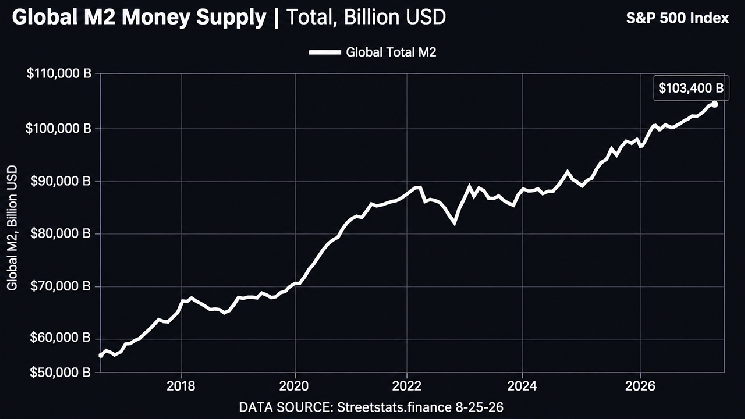
Bitcoin Price Lagging? Record Global Money Supply M2 Could Springboard BTC Growth The global money supply (M2) is expanding rapidly, similar to global debt. The US M2, representing all money circulating in its economy, has reached a record $23.16 trillion. Combined with figures from major economies like the Eurozone, China, and Japan, the global M2 is approximately $103 trillion. Some estimates, however, place it closer to $195 trillion. This surge in liquidity is significant because excess capital often seeks higher returns in assets like precious metals, stocks, and cryptocurrencies. Bitcoin's recent price surge above $81,000 has brought the global M2 metric back into focus. Following a sharp rise in early August after a US Treasury bond buyback announcement, BTC still trades about 37% below its October 2025 all-time high exceeding $126,000. This gap presents a potential "catch-up" trade thesis. Bitcoin's fixed supply of 21 million contrasts with governments' ability to print fiat currency, making scarce assets like BTC attractive if monetary expansion continues. Historically, Bitcoin's bull cycles in 2017-2018 and 2020-2021 coincided with M2 expansion and increased liquidity. Over the past year, the correlation seemed broken as M2 grew while Bitcoin's price fell sharply from its peak. Observers believe fresh dollars may have remained locked in cash-favorable investments. Some, like Ash Crypto, now suggest a long-awaited alignment between Bitcoin and M2 may be starting, especially as a weakening US Dollar Index this month has seen assets like gold and Bitcoin surge. A softer dollar pressures cash havens and prompts holders to act. While record M2 doesn't guarantee higher Bitcoin prices, a sustained influx of liquidity, a weak dollar, and capital flowing into alternative assets could trigger a catch-up rally sooner than expected. However, changes in these conditions could lead to the opposite outcome.

cryptonews.ru26m ago

Is Bitcoin Price Lagging? Record Global M2 Money Supply Could Be a Springboard for BTC's Rise

cryptonews.ru26m ago

Blockchain Capital Partner: Tokenization Will Reshape the Underlying Structure of Capital Markets

"Blockchain Capital partner Aleks Larsen argues that tokenization will fundamentally restructure capital markets by solving a costly 'packaging' problem in finance. Currently, assets like mortgages, private equity, and stocks exist in fragmented, incompatible systems, creating huge friction and slowing capital flow. Tokenization introduces a standardized, machine-readable interface for assets—akin to shipping containers for finance. Just as containerization standardized global trade, enabling massive efficiency gains and economic growth, tokens standardize financial rights. This allows platforms, lenders, and custodians to interact with assets directly on a shared network without rebuilding infrastructure for each one. Stablecoins demonstrate this potential, processing volumes rivaling Visa with far lower cost and faster settlement. Beyond payments, tokenization is expanding to assets like U.S. Treasuries, commodities, and private credit, now totaling nearly $400 billion on-chain. This shift changes financial service access: instead of depending on relationships with institutions, services become accessible based on the asset's tokenized properties themselves. DeFi protocols like Aave exemplify this, where assets meeting criteria can be used as collateral programmatically. Ultimately, tokenization will reorganize capital markets around open networks of specialized services, lowering barriers to entry and reducing costs. This could unlock global capital for currently underserved assets—small receivables, regional infrastructure, emerging market credit—integrating them into a seamless, programmable financial system. Combined with AI, tokenization promises to make capital allocation more efficient, transparent, and globally accessible, reshaping how economic value is created and distributed."

marsbit30m ago

Blockchain Capital Partner: Tokenization Will Reshape the Underlying Structure of Capital Markets

marsbit30m ago

Trading

Spot
活动图片