Price Movements: Yuga Labs’ virtual land sale clogged the Ethereum network and caused ApeCoin to soar, then plummet.
Market Liquidity: Turkish lira crypto trade volume surged to yearly highs amid soaring inflation.
Derivatives: Funding rates spiked during last Thursday’s spot-driven sell off.
Macro Trends: Bitcoin’s correlation with the tech-focused Nasdaq is nearly as high as its correlation with Ethereum.
Special Feature: Introduction to Value at Risk (VaR) for cryptocurrencies.
Trend of the Week
TerraUSD de-pegs, highlighting algorithmic stablecoin risk.
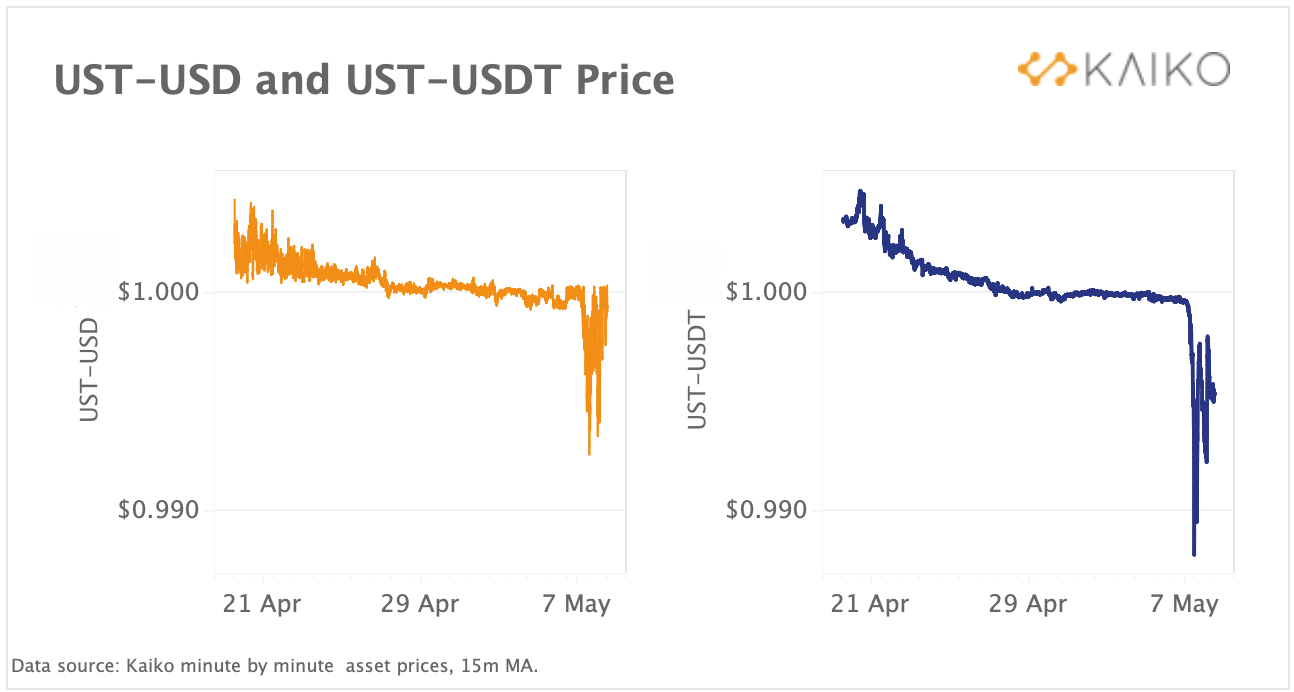
Terra’s UST stablecoin briefly lost its peg to the U.S. Dollar over the weekend due to strong selling pressure after a series of multi-million UST selloffs. The bulk of the selling was reportedly executed on stablecoin-focused decentralized exchange Curve and centralized exchange Binance. Above we chart UST’s price against Tether (USDT) and the U.S. Dollar, aggregated across all UST pairs on both CEXs and DEXs.
At around 11pm on May 7th, UST traded as low as .988 for 1 USDT. UST-USDT daily volumes also surged, hitting a record high level of over $1B, reportedly forcing Binance to temporarily halt UST borrowing. Last month, UST became the third largest stablecoin by market cap at around $18bn, flipping Binance’s BUSD. However, its tremendous growth has been mainly driven by the Terra ecosystem’s lending and borrowing protocol Anchor, which offers attractive double-digit yields to users, raising questions regarding the sustainability of this model.
Price Movements
Bitcoin trades at 10-month lows.
As of Monday morning, Bitcoin is now trading at 10-month lows in the latest sign that macro headwinds and the Fed’s hawkish policies could continue to weigh on risk assets in the near term. Equities didn’t fare much better, with the Nasdaq composite registering its biggest one-day loss since 2020, bringing its correlation with Bitcoin to historic highs. Despite the overall bearishness, Binance had a very good week. The exchange gained regulatory approval to operate in France, contributed $500 million to Elon Musk’s twitter takeover bid, and had its BUSD stablecoin listed on rival Coinbase.
ApeCoin plummets as land mint clogs Ethereum network.
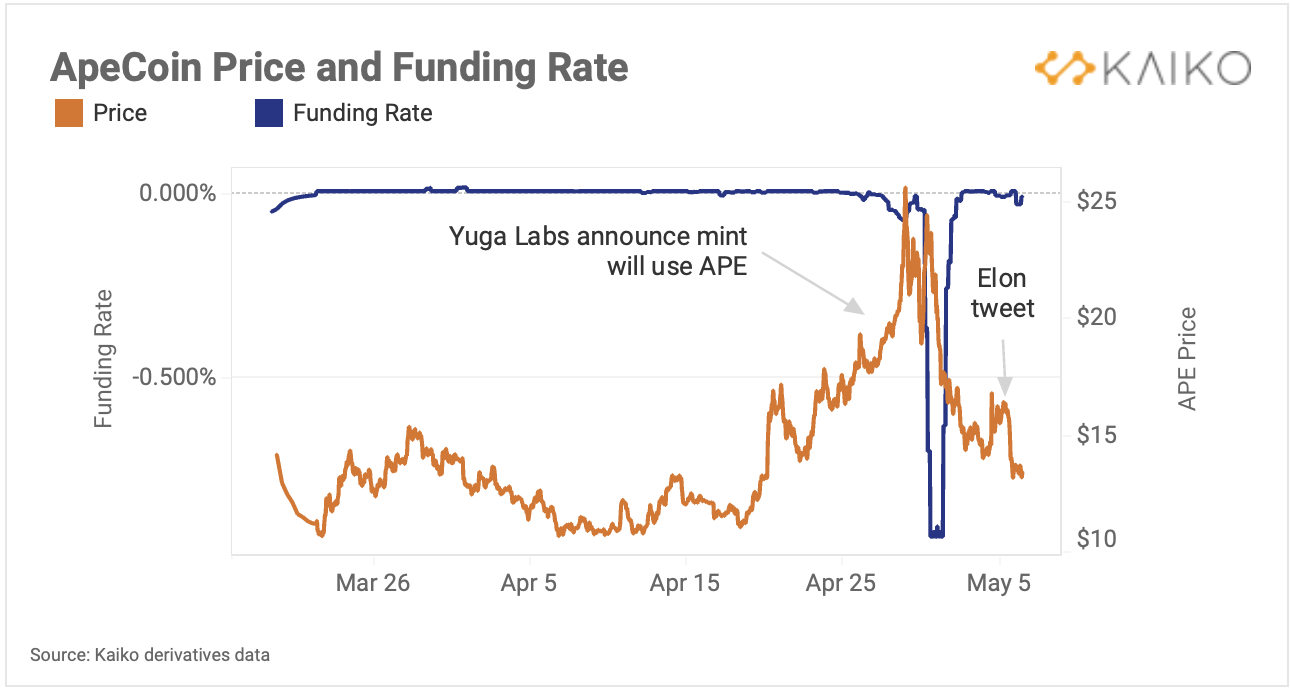
Yuga Labs, the company behind NFT collection Bored Ape Yacht Club, entered the metaverse last week with a much-anticipated virtual land sale for its forthcoming Otherside metaverse platform. A record $561 million in virtual parcels were sold in just 24 hours, which were paid for using the associated token ApeCoin(APE), creating a type of “pump and dump” which saw the value of APE surge to all time highs in the run-up to the mint, before plummeting more than 50%. Funding rates also dropped precipitously, suggesting that traders were aggressively shorting the token following completion of the hotly demanded sale.
In the aftermath of the NFT launch, Elon Musk briefly changed his twitter profile picture to Bored Apes, spiking APE’s price 20% before he tweeted “I dunno … seems kinda fungible”, after which price returned to previous levels.
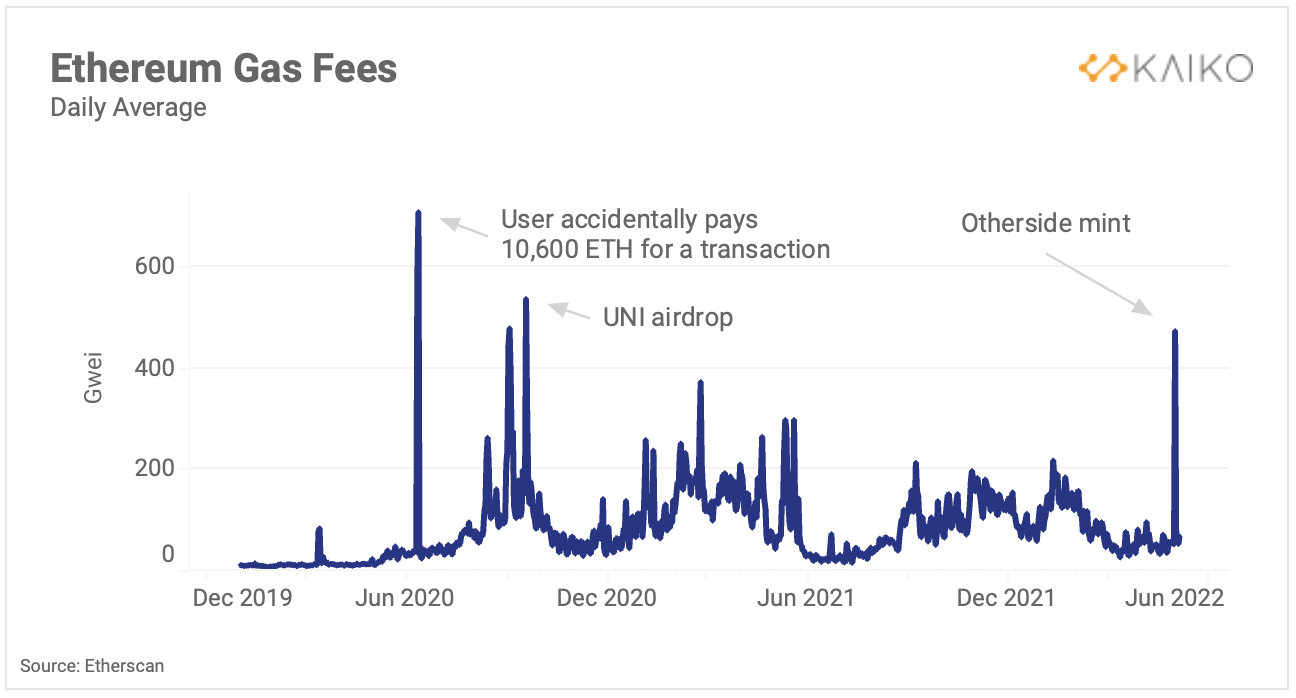
Not only did APECoin holders lose out during the minting frenzy, but the entire Ethereum network became clogged, causing gas fees to spike to levels not seen since the midst of DeFi summer. Transactions associated with the mint consumed more than $180 million in gas fees. Yuga Labs was severely criticized for the chaotic mint, and has promised to refund failed transaction fees.
Market Liquidity
Turkish crypto demand soars amid galloping inflation.
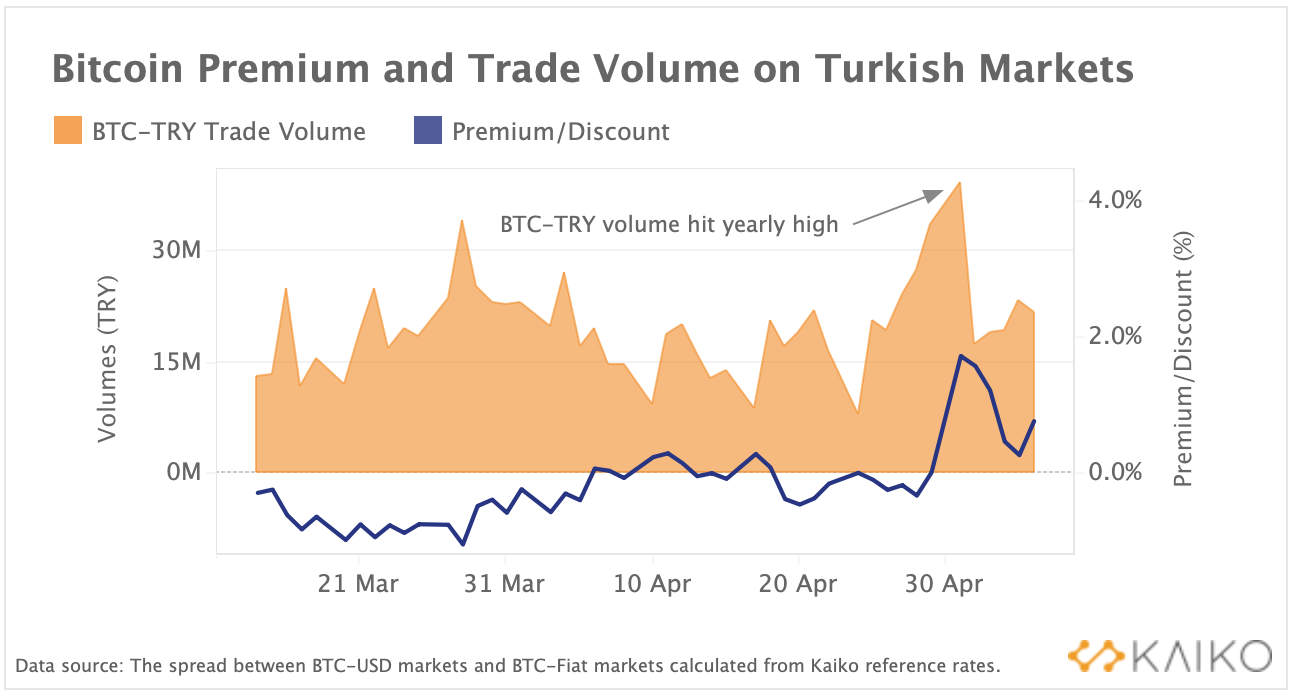
The recent decline in Bitcoin spot prices alongside geopolitical turmoil is boosting crypto adoption in inflation-ridden emerging economies such as Turkey, which saw volume spike to yearly highs in April. Bitcoin’s premium on Turkish markets rose to 1.7% in early May as inflation hit a staggering 70% in April. This has been mirrored by a steady rise in both BTC-TRY and USDT-TRY trade volumes since the start of the war in Ukraine suggesting geopolitical tensions have also played a role in boosting local crypto demand.
The fast growing Turkish market has attracted the attention of major crypto exchanges such as Binance and Coinbase which seek to expand their operations in the country, although Turkey has made recent attempts to regulate the industry.
Euro stablecoin volume spikes despite remaining relatively low.
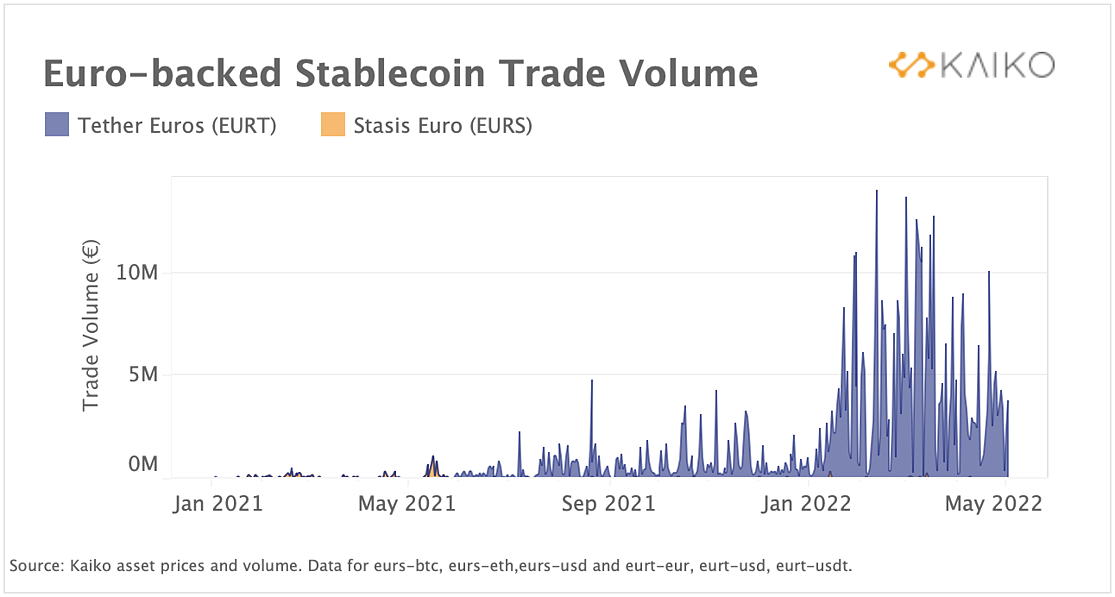
Euro stablecoin volumes have spiked to all time highs in 2022, despite remaining magnitudes lower than volumes for their USD-counterparts. There are only a handful of Euro backed stablecoins in the market today, and we’ve charted above the two largest: Tether Euros and Stasis. Both are operated by private, centralized companies; Tether Euros is a Euro-pegged stablecoin supported by Tether, the company that operates USD Tether (USDT).
Clearly EURT has the largest shares of volume on centralized exchanges and those volumes have spiked quite dramatically this year, albeit from a base considerably lower than the overall stablecoin market. It would be fair to expect Euro volumes to be larger asuuming European traders should want to avoid any FX exposure in their trades. Combine this with the current amount of USD-denominated stablecoin volume and we’re left wondering why Euro stablecoins have not had a similar rate of adoption.
The answer to this is twofold: stricter European regulation on stablecoins and their collateral; and the current regime of persistent negative interest rates from the ECB. The benchmark ECB deposit rate has been negative for over a decade now, which means anyone holding Euro collateral, i.e stablecoins, is actually guaranteed to lose money on their holdings. One thing to watch will be how trade volumes and Euro stables adoption will look if the ECB decides to adopt positive interest rates, something that was hinted at last week. It is very possible that the recent spike in volumes the last few months has been due to expectations that the ECB would follow a similar rate hike pattern as the Fed, which so far has failed to materialize.
Market depth dips before sell off.
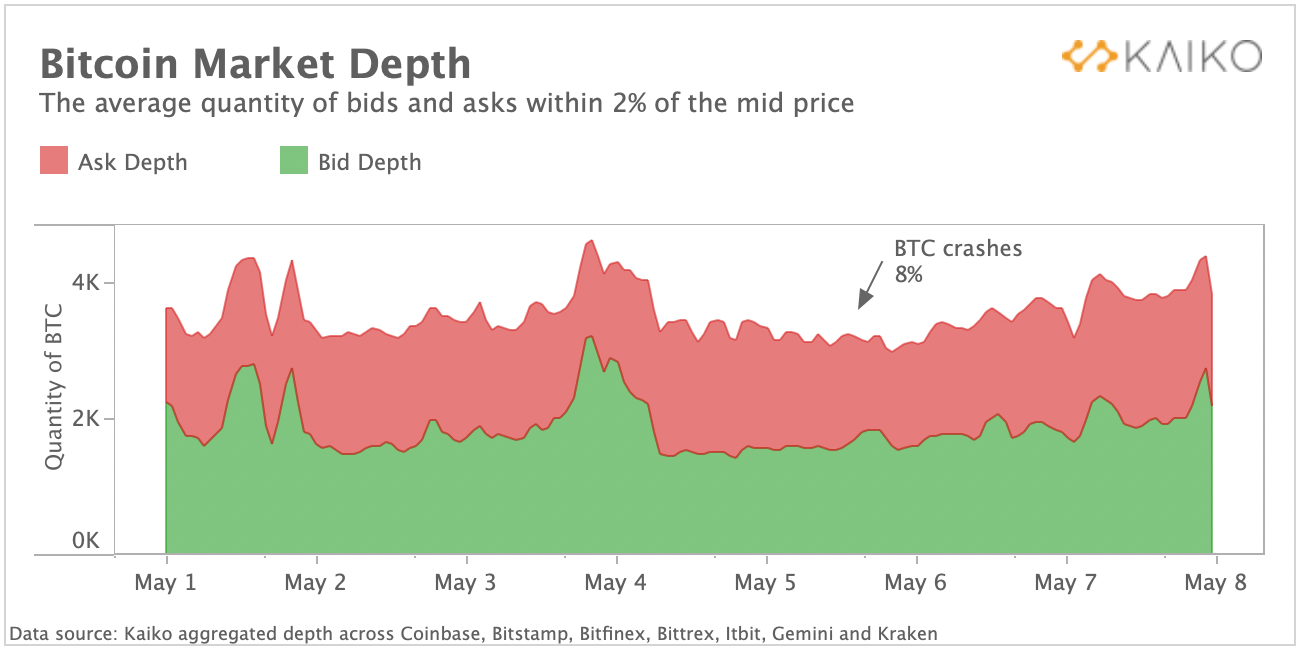
In the day preceding Bitcoin’s 8% price crash, market depth for BTC-USD within 2% of the mid price remained volatile, fluctuating between 3,400 and 4,400 BTC. The crash itself did not cause a noticeable dent in market depth, although liquidity conditions remained lower than earlier in the week, which can often perpetuate a sell-off as market makers remain cautious before re-entering their positions. Following the initial drop, Bitcoin’s price continued to dip over the weekend. However, we can observe that liquidity conditions improved by May 7th to pre-crash levels.
Special Feature: Value at Risk for Cryptocurrencies
Risk management is a crucial (and often obligatory) component of the investment lifecycle. In cryptocurrency markets, risk management remains a complex and evolving area of study due to frequent changes in market structure, high volatility, and limited availability of historical data.
Kaiko’s new Value at Risk (VaR) estimator leverages a proprietary and thoroughly backtested methodology that accounts for the idiosyncrasies of crypto market structure. Value at Risk is one of the most common risk indicators to quantify the extent and probability of potential losses in a portfolio. Kaiko’s VaR data can be applied to any cryptocurrency portfolio to accurately track VaR over time. For example, below we chart the Daily P&L and Daily VaR of an equally weighted $1 million portfolio of BTC and ETH.
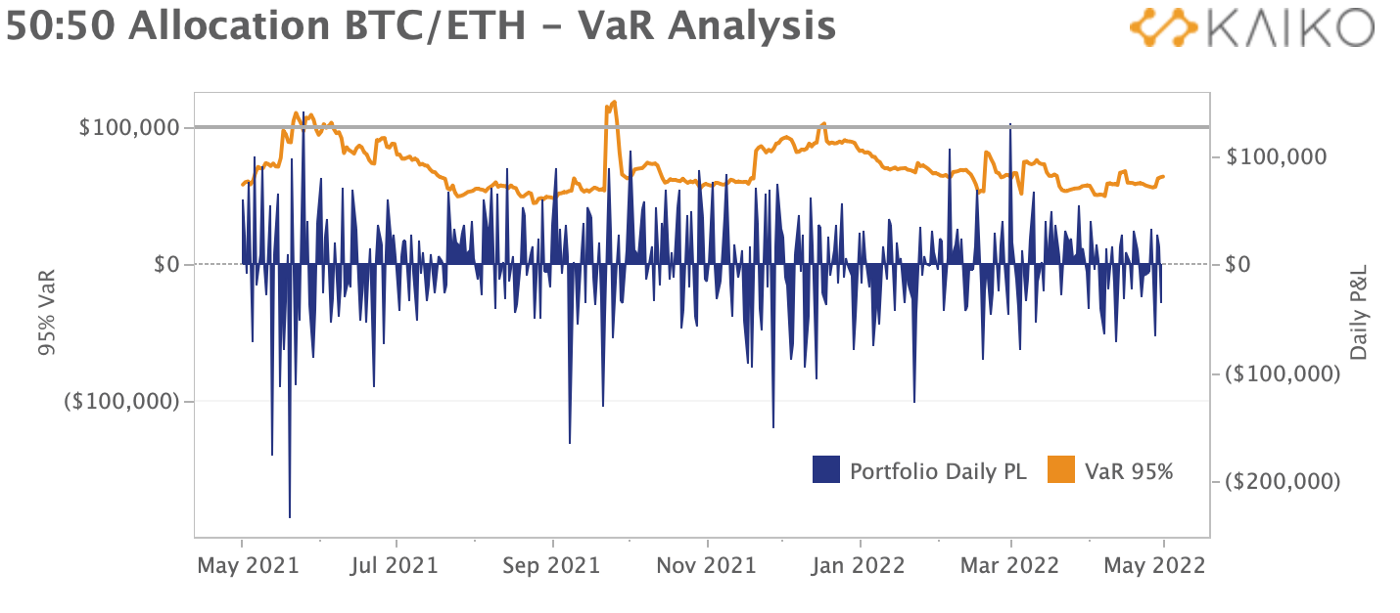
Suppose you are setting a risk budget for this portfolio, and don’t want to lose more than $100k one in every 20 days on average. You would set your VaR risk level to 95%, charted above, and monitor when your portfolio exceeds that $100k level. If VaR exceeds that level you would look to de-risk the portfolio until VaR remains under that $100k threshold. View our full VaR case study below:
VaR Case Study
Derivatives
Funding rates move positive during sell-off.
So far this year, BTC funding rates have remained mostly neutral amid Bitcoin’s sideways price action and low derivatives volumes. During last year’s bullish market conditions, funding rates were strongly positive as traders bid up futures prices, leaving the futures price higher than the spot price. However, recently we’ve noted a divergence in this trend, exemplified by last week’s sell off which saw funding rates flip positive despite bearish market conditions. The likely explanation is that spot markets sold off faster than futures, causing the funding rate to stay positive, which suggests bearish activity is spot-driven.
Bitcoin perpetual futures open interest showed resilience last week despite spot market volatility which spurred over $300mn in long liquidations.
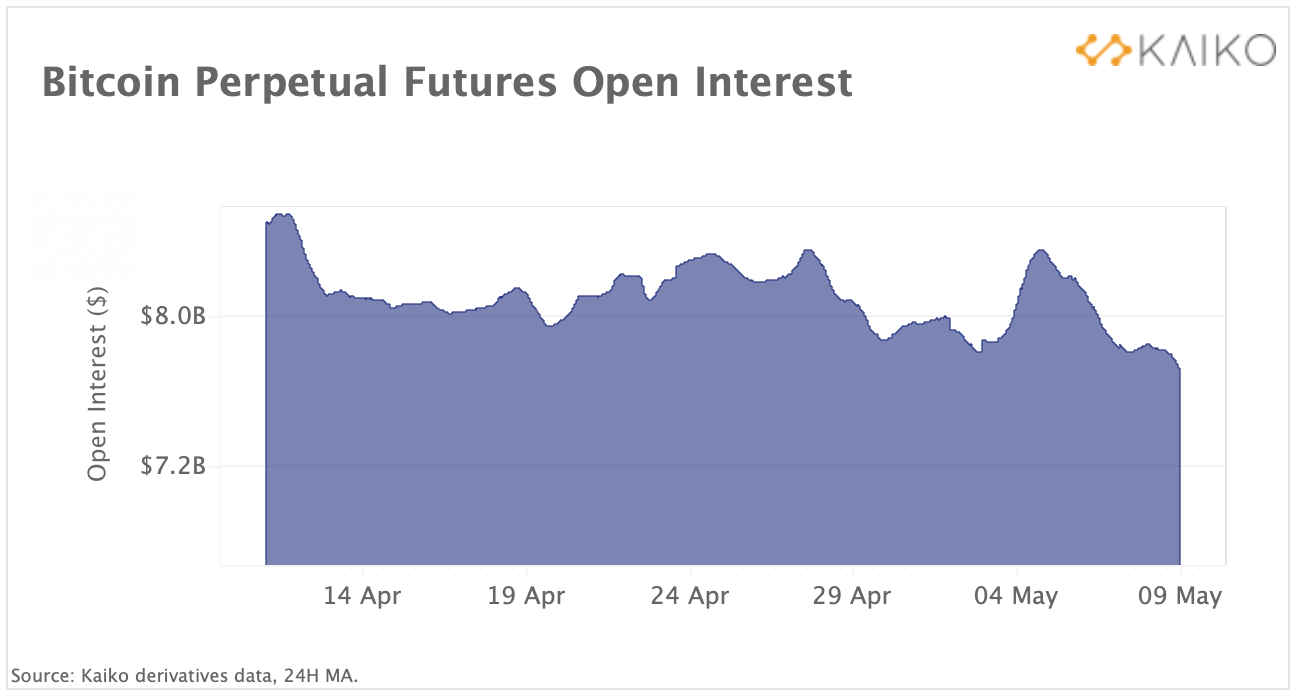
Above we chart the aggregated open interest on four exchanges — Binance, Derbit, FTX and Bybit. We observe the amount of open contracts shrank by just 8% to $7.7B between May 4–8 while spot prices tumbled by 13% over the same period. Overall, the decline in open interest was more gradual than during previous selloffs.
Macro Trends
Bitcoin’s correlation with Nasdaq at all time highs.
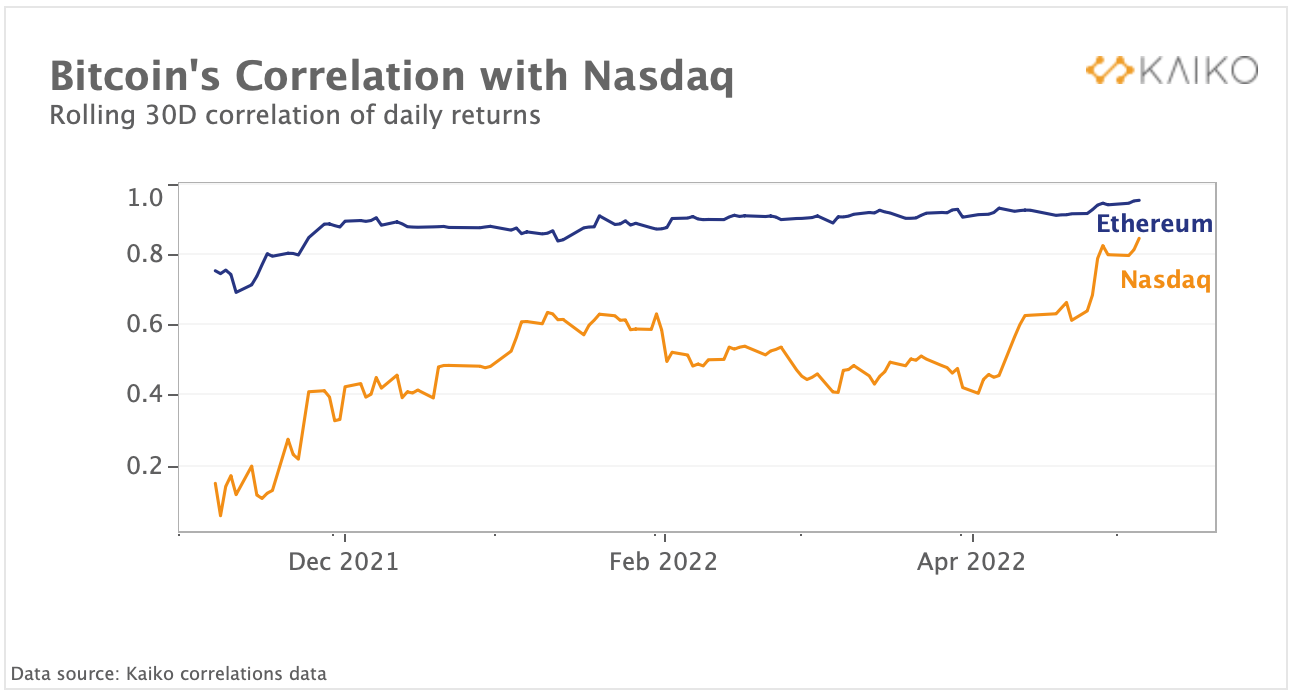
Risk assets continued to move in tandem last week, whipsawing as the U.S. Fed hiked its key policy rate by 50bps — the largest rate increase in about two decades. Bitcoin’s rolling correlation with the tech-focused Nasdaq 100 to hit a historically high level of .8. It is now nearing its traditionally strong correlation to Ethereum which is also on the rise and currently hovers around .9.
However, despite being strongly correlated with the Nasdaq 100, Bitcoin has been performing slightly better since the start of the year. We noticed that when inflation expectations are increasing, Bitcoin tends to outperform tech stocks, which could add credence to the narrative around BTC’s role as an inflation hedge.
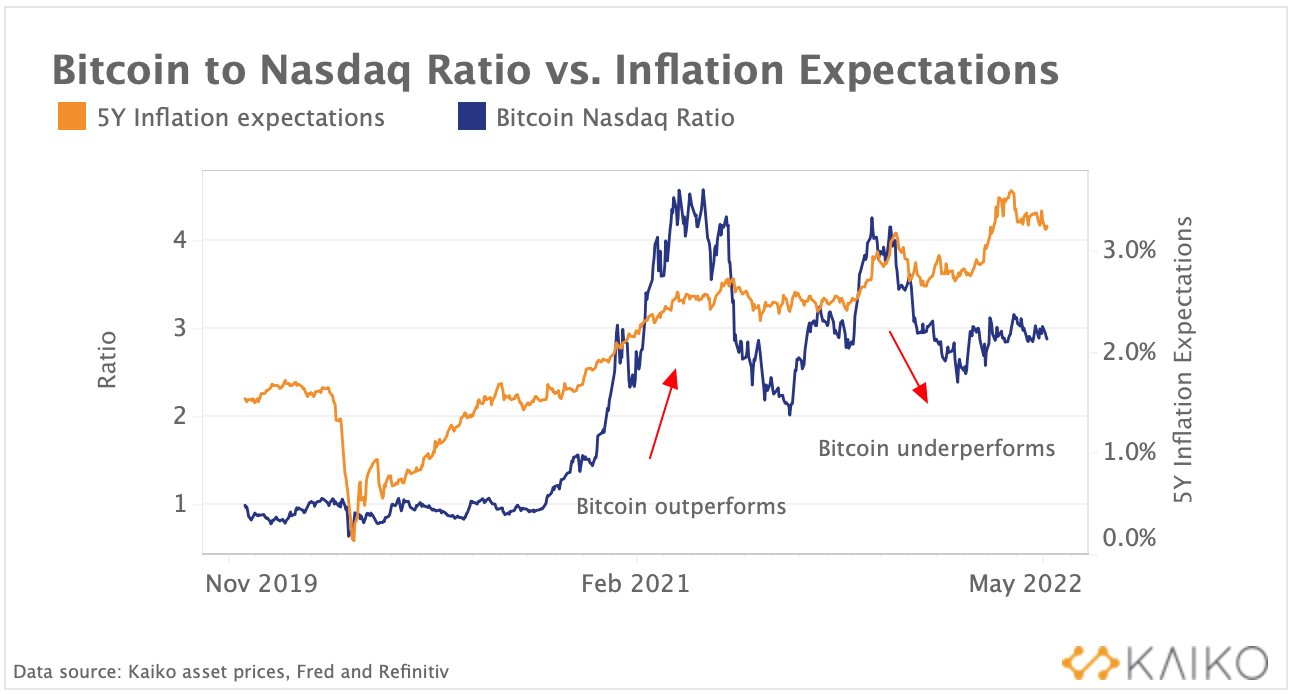
We chart the Bitcoin to Nasdaq price ratio alongside 5-year inflation expectations — a market based measure of the expected inflation over the next 5 years — and can observe this trend in action. However, it could also mean that Bitcoin is perceived as a riskier asset and it suffers more when the Fed’s credibility in fighting inflation is improving.
Bitcoin mining stocks are more volatile than Bitcoin.
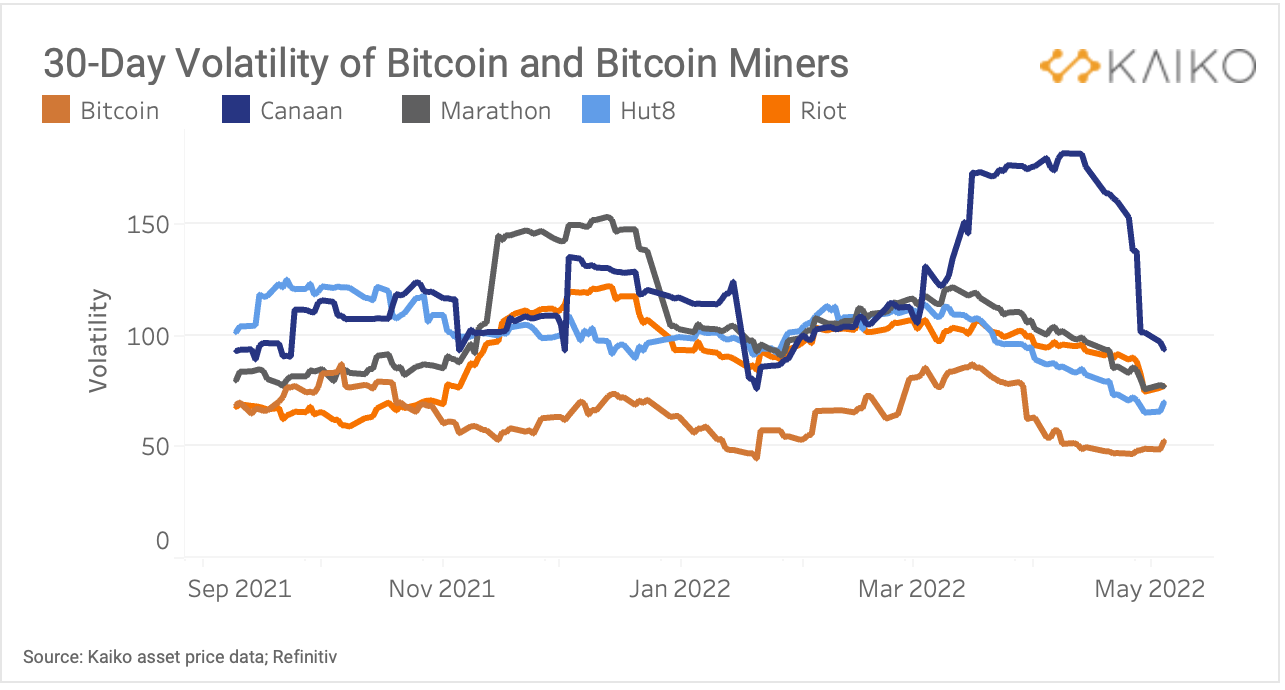
Bloomberg last week reported that Bitcoin miners are “selling Bitcoin call options to wring money out of their holdings, turning to a yield-generating strategy deployed throughout conventional finance.” This strategy involves selling calls on BTC, which often will expire worthless, generating a return for the miner. However, if BTC were to increase rapidly in price, the miners’ upside would be limited. One would thus expect that, all else being equal, miners would have relatively less volatility than BTC itself. However, as charted above, they are all more volatile, especially the Chinese company Canaan, which has seen significant swings as a result of regulatory changes in the country.