ali****@gmail.com
01/25 15:58
Price Analysis January 24 BTC, ETH, XRP, SOL, DOG
Price Analysis January 24
BTC, ETH, XRP, SOL, DOGE, LINK, AVAX, XLM
Bitcoin price analysis
Bitcoin rebounded off the 20-day exponential moving average ($100,831) on Jan. 23, indicating a positive sentiment.
Buyers will make another attempt to catapult the price above the all-time high of $109,588. If they succeed, the BTC/USDT pair is likely to accelerate toward the next target objective of $126,706.
The 50-day simple moving average ($98,839) is the critical support to watch out for on the downside. If this level cracks, the pair could descend to the solid support at $90,000. Buyers are expected to defend the $90.000 to $85,000 support zone with all their might because a break below it could signal the start of a deeper correction toward $73,777.
Ether price analysis
Ether bounced off the neckline of the head-and-shoulders (H&S) pattern on Jan. 23, indicating that the bulls are attempting to prevent the formation of the bearish setup.
The ETH/USDT pair could rise to the 50-day SMA ($3,503), which is a crucial near-term resistance to watch out for. If buyers propel the price above the 50-day SMA, the pair could surge to $3,745.
Conversely, if the price turns down from the 50-day SMA, it will indicate that the bears remain sellers on rallies. That increases the risk of a break below the neckline. If that happens, the pair may plunge to $2,850.
XRP price analysis
XRP has been sustaining above the breakout level of $2.91, indicating that the buyers have the edge.
There is minor resistance at the downtrend line, but if the bulls overcome it, the XRP/USDT pair could start the next leg of the uptrend. The pair could pick up momentum and soar to $4 and eventually to $4.84.
This optimistic view will be negated in the near term if the price turns down and breaks below the 20-day EMA ($2.87). That could start a corrective phase to the 50-day SMA ($2.51) and then $2.20
Solana price analysis
Solana has broken out of the $260 resistance, suggesting that the bulls are trying to assert their supremacy.
There is minor resistance at $274, but the level is likely to be crossed. If buyers propel the price above $274, the SOL/USDT pair could surge to $295. This level may pose a strong challenge, but if overcome, the next stop could be $375.
The 20-day EMA ($228) is the critical support to watch out for on the downside. A break and close below the 20-day EMA will suggest that the bulls have given up. The pair may then plummet to the 50-day SMA ($211).
Dogecoin price analysis
Dogecoin remains stuck inside the ascending channel pattern, indicating buying near the support line and selling near the resistance line.
If buyers push the price above the moving averages, the DOGE/USDT pair could climb to $0.40 and subsequently to the resistance line. A break and close above the channel could start a rally toward $0.48.
On the contrary, if the price turns down from the moving averages, the risk of a break below the support line increases. The pair could slump to $0.30 and later to the 61.8% Fibonacci retracement level of $0.27.
Chainlink price analysis
Chainlink bounced off the 20-day EMA ($23.72) on Jan. 23, indicating that the bulls are buying on dips.
The upsloping 20-day EMA and the relative strength index in the positive zone suggest that the path of least resistance is to the upside. Buyers will try to push the price above $27.21, opening the doors for a rally to $30.94.
This positive view will be invalidated in the near term if the price turns down sharply and breaks below the moving averages. That could sink the LINK/USDT pair to $22 and then to the solid support at $20.
Avalanche price analysis
Avalanche has been trading below the 20-day EMA ($37.82), but the bears have failed to sink the price below the $34.49 support.
The bulls will try to push the price above the 20-day EMA. If they manage to do that, the AVAX/USDT pair could rise to the 50-day SMA ($41.13). That suggests the pair may extend its stay inside the $45.05 to $32.31 range for a few more days.
Contrary to this assumption, if the price turns down from the 20-day EMA, it will signal that the bears are selling on every minor rally. The pair could retest the $32.31 support, where the buyers are expected to step in.
Stellar price analysis
Stellar bulls have managed to defend the 50-day SMA ($0.42) for the past few days but have failed to start a strong recovery.
If buyers push the price above $0.46, the XLM/USDT pair could rise to the neckline of the inverted H&S pattern. The bears are expected to fiercely defend the neckline, but if the bulls prevail, the pair could surge to $0.64.
Conversely, if the price turns down and breaks below the 50-day SMA, it will suggest that the bears are trying to make a comeback. The pair could sink to the nearby support at $0.39 and subsequently to $0.31.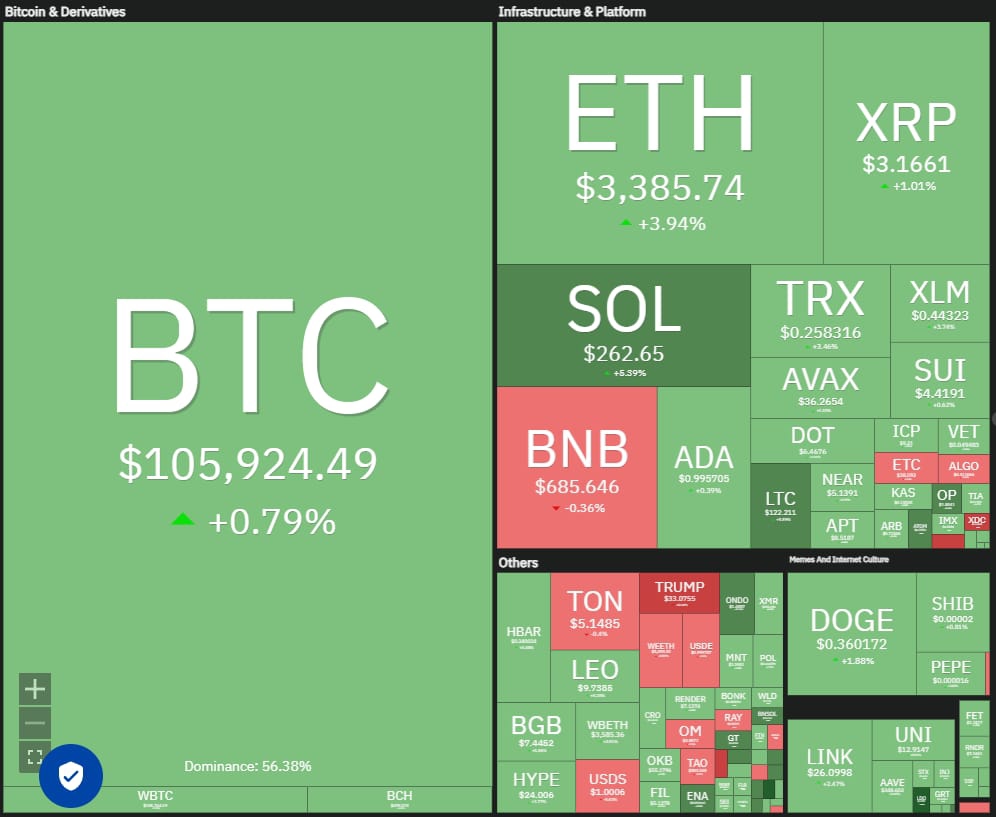
#Tariffs Crash Crypto#Share Your Thoughts on Popular Assets in March#Win 400 USDT: Share Your Crypto Loans Trades
1Share
All Comments0LatestHot