Bit360
08/17 20:57
Bitcoin Price Analysis: BTC Tests Crucial Support
Bitcoin Price Analysis: BTC Tests Crucial Support After Latest ATH
Bitcoin’s price made a new record high just above the $124K mark a few days ago, before printing two consecutive bearish daily candles and dropping back to a key area. Investors are now carefully monitoring the market to find any early signs of reversal.
By ShayanMarkets
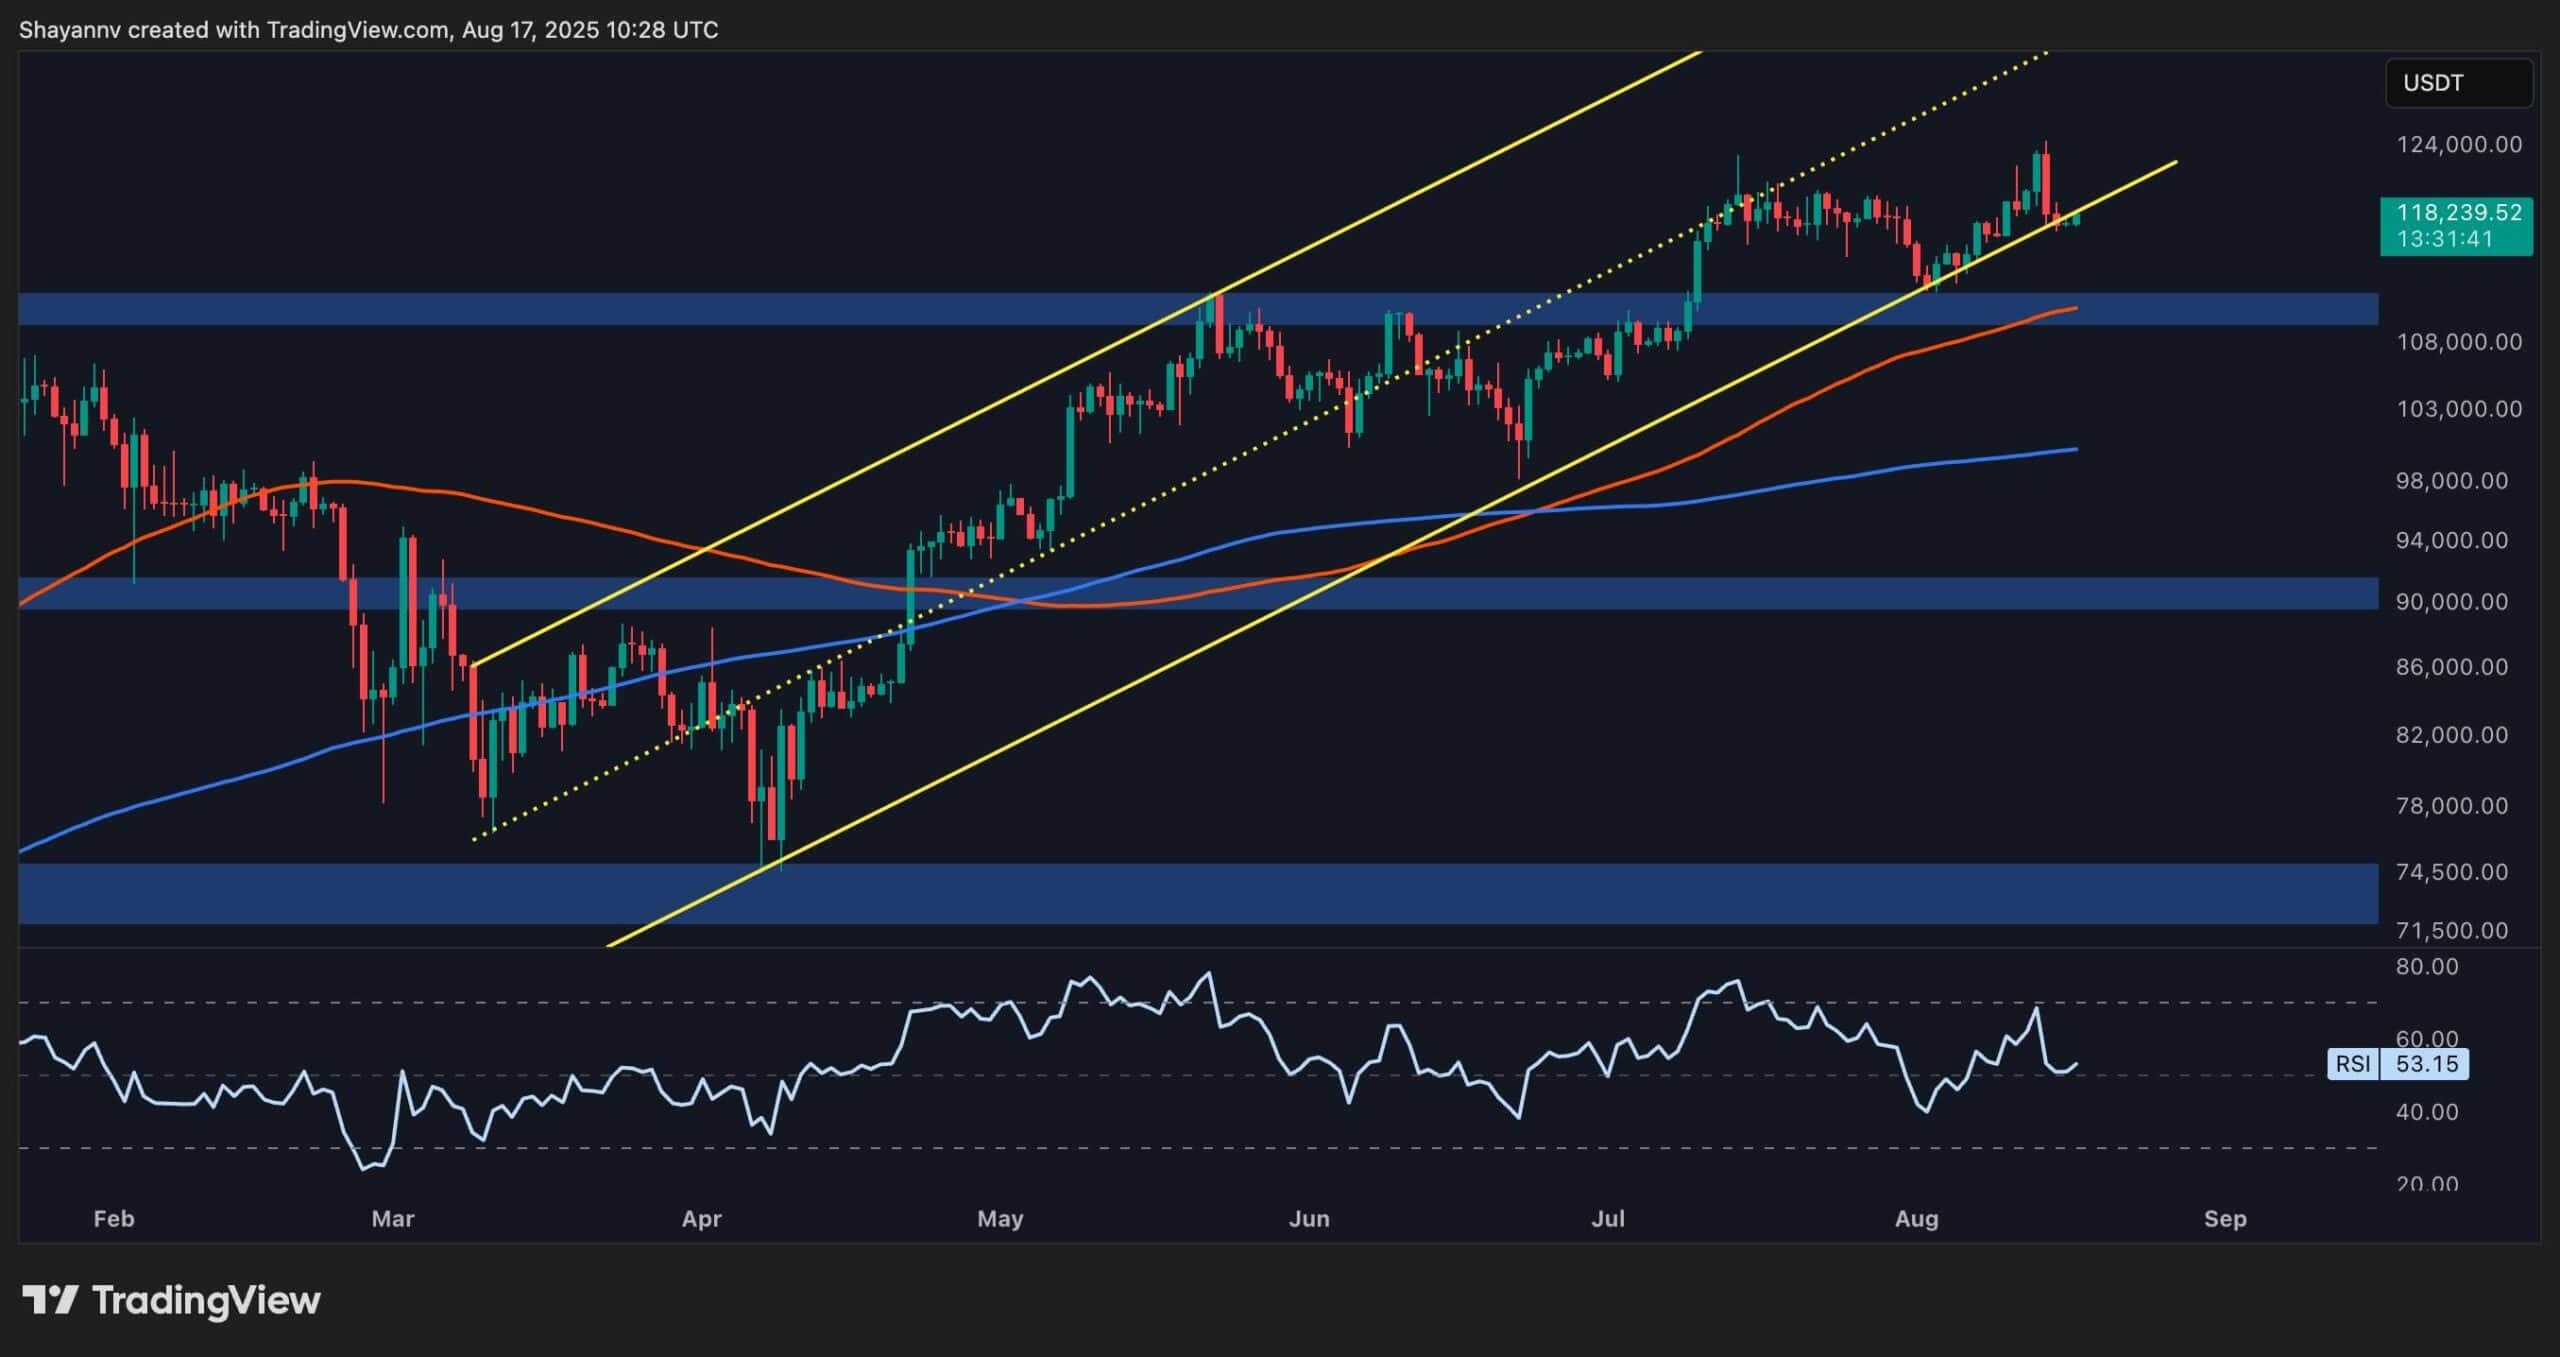
The Daily Chart
On the daily chart, Bitcoin is once again testing the lower boundary of its long-term ascending channel, raising the possibility of a downside breakout after months of holding within the structure. Should the breakdown materialize, the $110K region, backed by the nearby 100-day moving average, could serve as a strong support area.
The 4-Hour Chart
On the 4-hour timeframe, BTC recently attempted a breakout above the $123K resistance but quickly failed to sustain it, resulting in a sharp decline that also broke the short-term trendline built over the past few weeks. This rejection signals weakness at the highs and has shifted the market’s short-term structure
All Comments0LatestHot