Crypto Express
08/09 13:45
Will Cardano continue its rally regardless of BTC
Will Cardano continue its rally regardless of BTC’s stalled momentum?
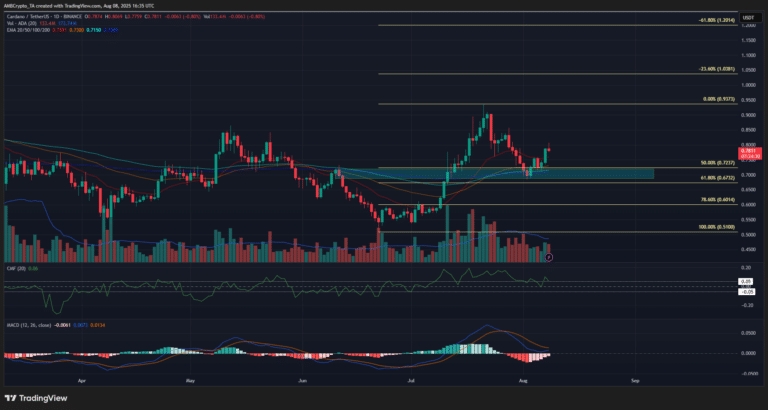
Using the swing points from late June and July at $0.51 and $0.937, a set of Fibonacci retracement levels was plotted. It showed the 61.8% retracement level was at $0.673, and this level was nearly retested as support during the recent retracement.
The June high at $0.73, a resistance two months ago, has been reclaimed as support. Highlighted in cyan, this area also had confluence from the moving averages on the daily chart.
It was encouraging that Cardano saw a bullish reaction from this area. Additionally, the CMF was at +0.06, reflecting significant buying pressure. The MACD remained above the zero line and was on the verge of forming a bullish crossover again.
The technical indicators and the price action on the 1-day chart reflected bullishness. A rally was likely to follow.
The Fibonacci extension levels at $1.03 and $1.2 were the next targets. These levels lined up relatively well with strong horizontal levels from November to December 2024.
#Post To Earn Bonus#Claim1,200 USDT in the Monthly Creation Challenge#Focus on NFT
81Share
All Comments0LatestHot