crypto analysis
07/26 22:09
Mapping HBAR’s next support zone
Mapping HBAR’s next support zone.
The 1-day chart above shows the Fixed Range Volume Profile for 2025’s price action.
The Point of Control was at $0.192 and had been flipped to support in early July. The Value Area High (dotted blue) was at $0.261. HBAR was trading just above this level at press time.
The strong gains in July meant that the market structure was bullish. Even the retracement from $0.3 did not form a lower low, but remained above the $0.234 support.
Momentum indicators support further gains
During this pullback, the RSI reset from overbought conditions to a healthy bullish reading of 65.
This meant that there was more space for Hedera prices to push higher again.
Meanwhile, the OBV continues its steady climb, signaling consistent accumulation and buy-side pressure throughout the rally.
Overall, the signs pointed toward more gains in the coming weeks for HBAR.
A price drop below $0.223 would be the first sign of trouble for bulls on this timeframe. Meanwhile, a rally beyond $0.28-$0.3 will target $0.324 and $0.392 next.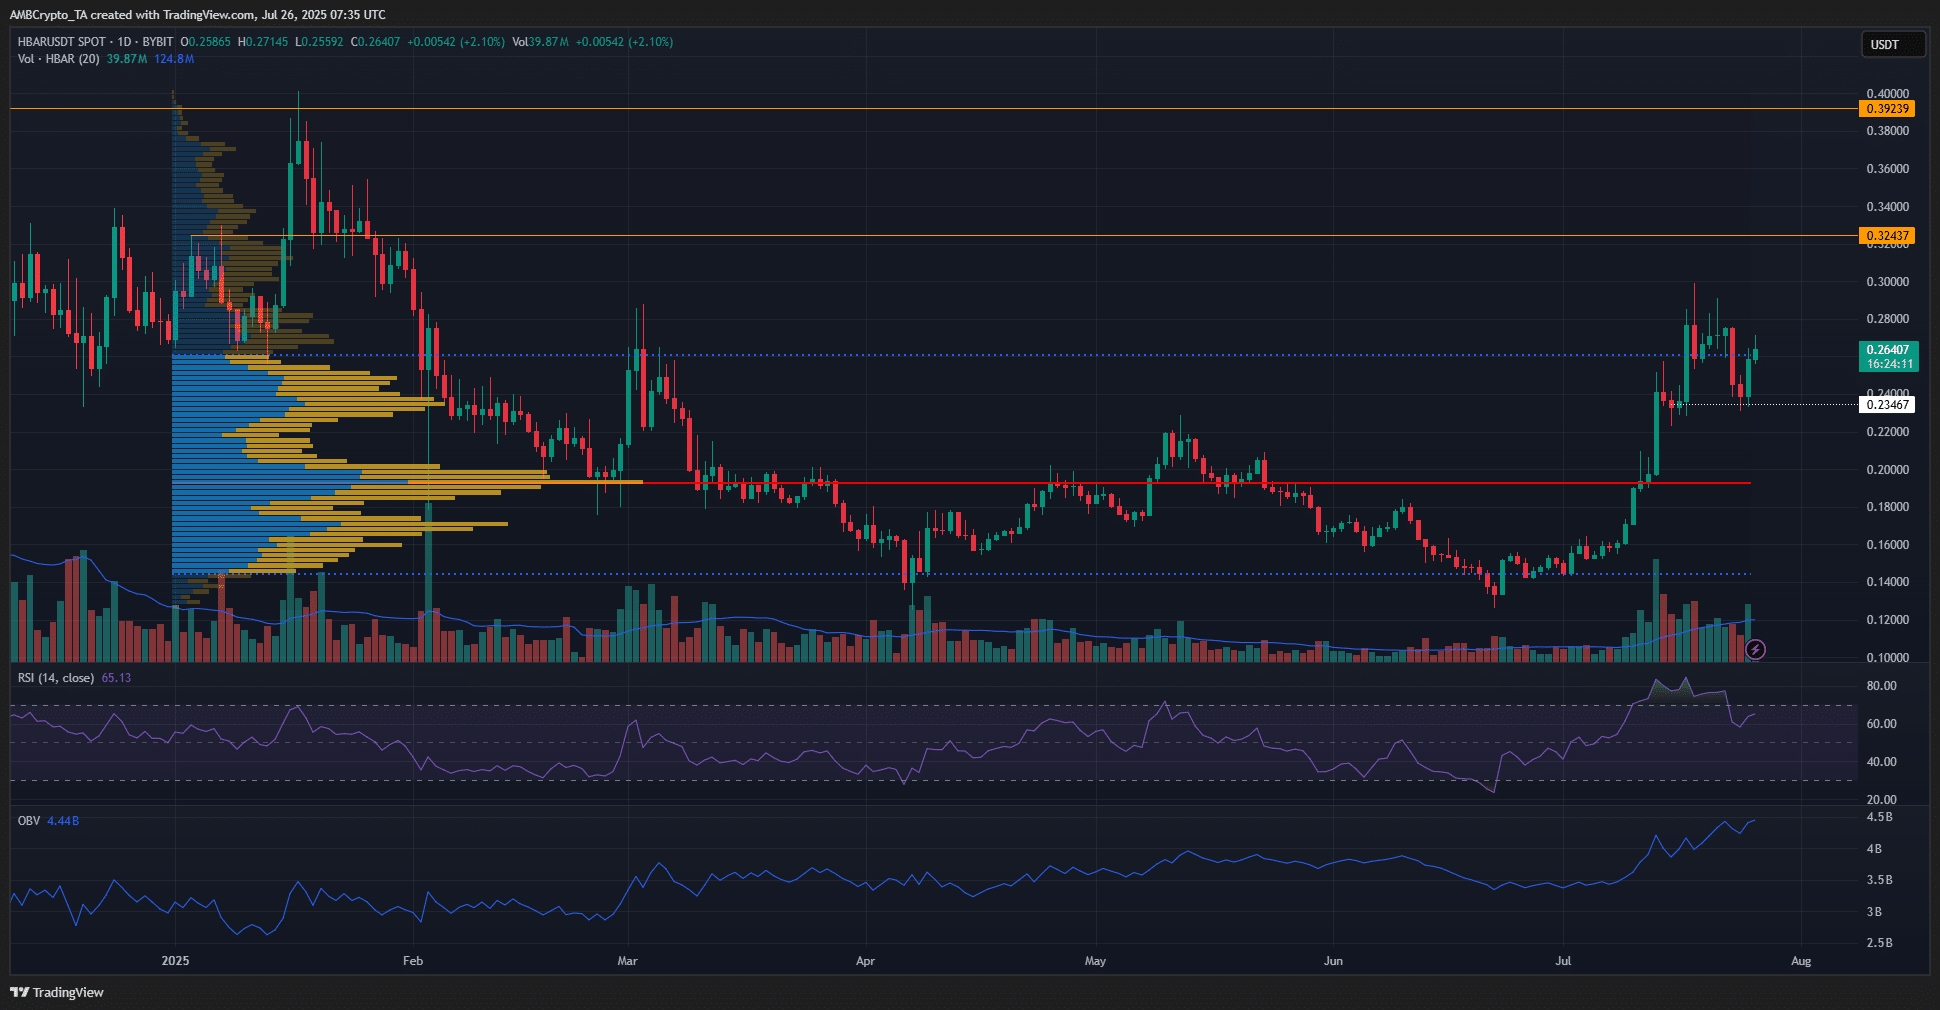
#HTX 12th-Anniversary Carnival#Check In to Win a 20g Gold Bar#Claim1,200 USDT in the Monthly Creation Challenge#Do you think Tanssi is promising? #HTX Crypto Gifts Carnival Is Live!
90Share
All Comments0LatestHot