crypto Queen Abrash
07/26 10:04
HBAR Price Analysis On the daily chart I’ve share
HBAR Price Analysis
On the daily chart I’ve shared, HBAR has broken above its previous resistance at $0.26, which very well aligns with the 23.6% Fibonacci retracement level. This came into play after forming a “higher low” at $0.233 on July 24. That being said, traders need to watch out for the immediate support zone, seen between $0.2480–$0.2520, with a more critical stop-loss threshold at $0.2390.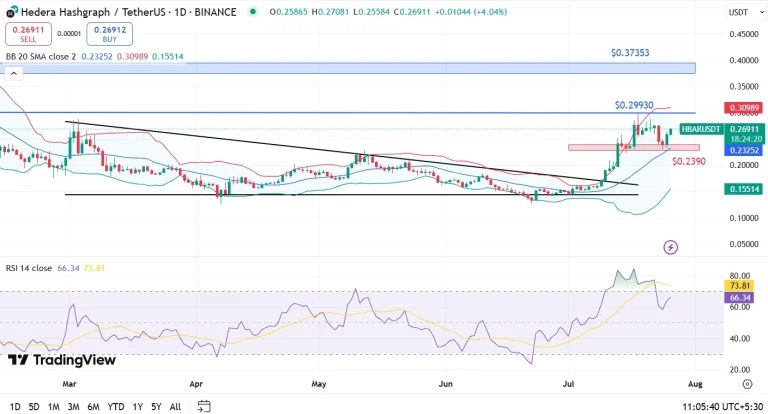
Talking about indicators, the 14-day RSI stands at 66.34, running closely with overbought territory but still suggesting room for upside. Meanwhile, the MACD remains slightly bearish with a negative histogram (-0.00022), though the price has consistently held above its 7-day simple moving average at $0.2611.
If the bullish momentum continues, HBAR price could next target its July 25 high of $0.2976, followed by a potential breakout toward $0.3274. A successful close above $0.2993 would validate this bullish trajectory, with long-term resistance at $0.3735.
All Comments0LatestHot