crypto analysis
07/13 01:04
Solana price technical analysis
Solana price technical analysis.
The daily timeframe chart shows that the SOL price bottomed at $94.3 in April and then bounced back. It moved to the top of the trading range of the Murrey Math Lines at $162.
The Solana price jumped above the 50-day and 200-day moving averages, as well as the 23.6% Fibonacci Retracement level. It has also moved above the ascending trendline that connects the lowest point in April and June.
Therefore, the token will likely continue rising as bulls target the key point at $187, the highest point in May. This target is about 15% above the current level. A break above that level will point to more gains, potentially to the Murrey Math Lines ultimate resistance at $200. 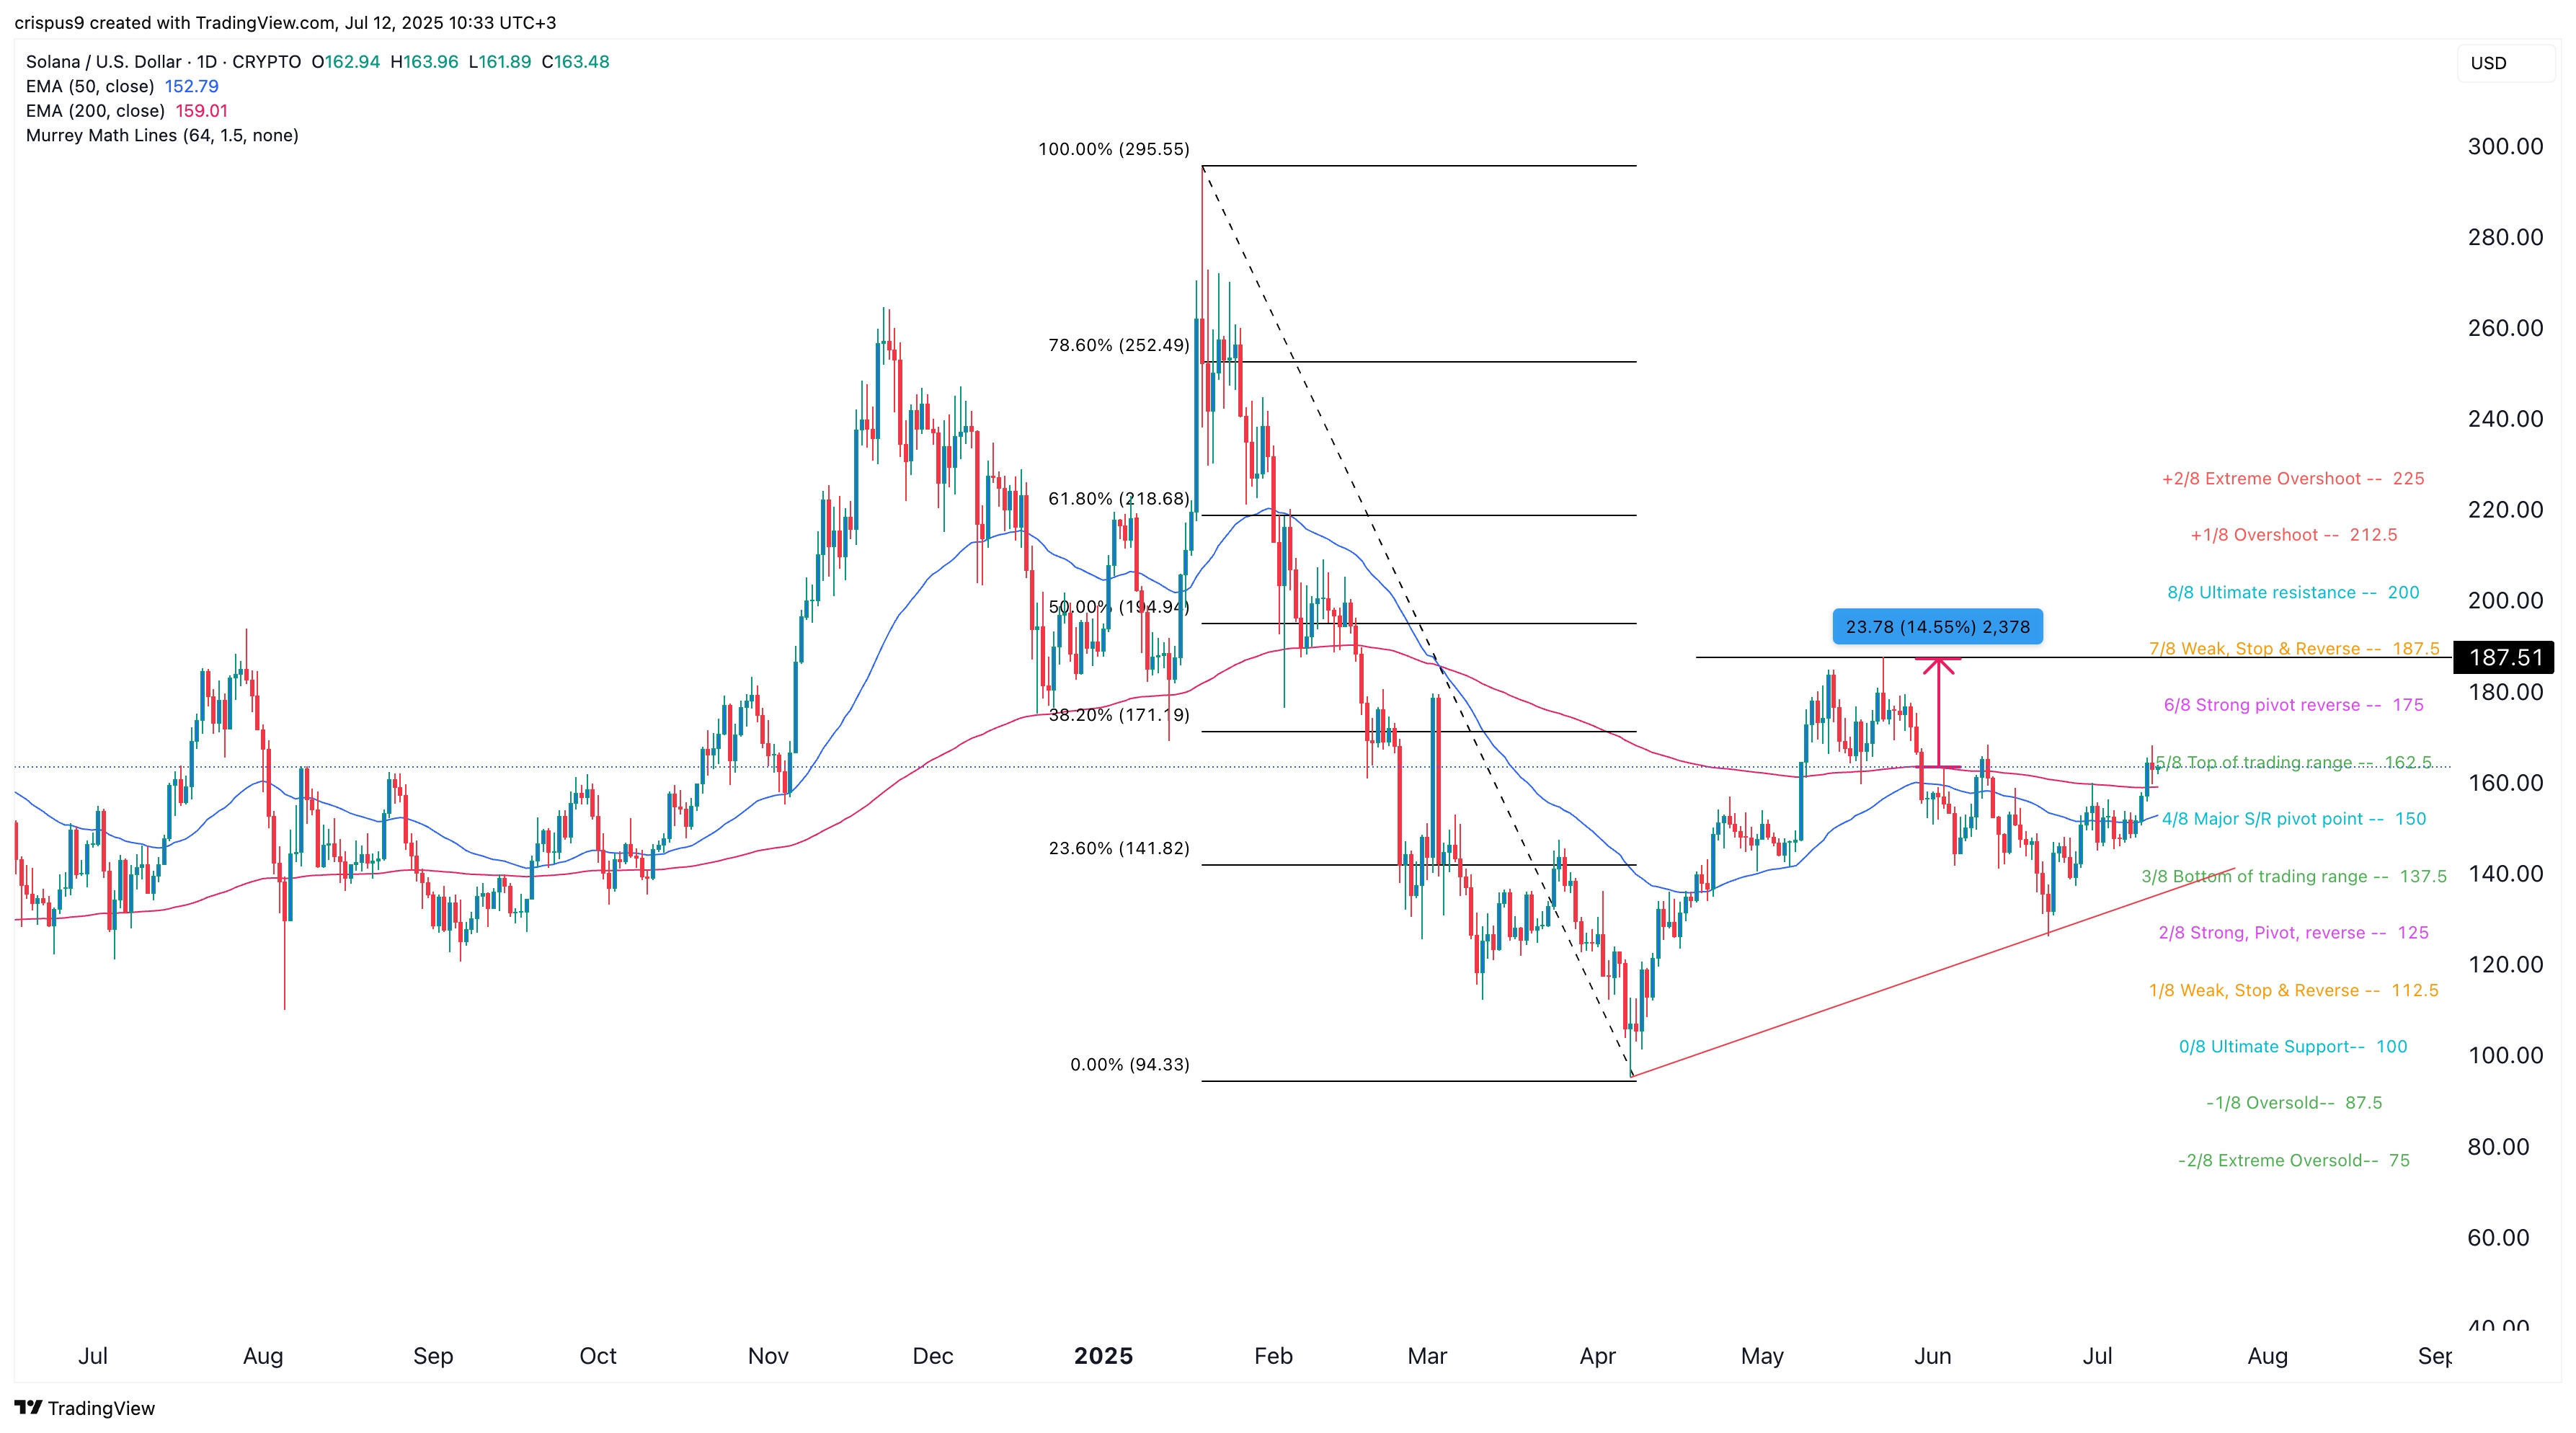
#HTX 12th-Anniversary Carnival#Check In to Win a 20g Gold Bar#Claim1,200 USDT in the Monthly Creation Challenge#Do you think NEWT is promising?#Do you think DELOREAN is promising?
51Share
All Comments0LatestHot