Trading King
06/18 07:34
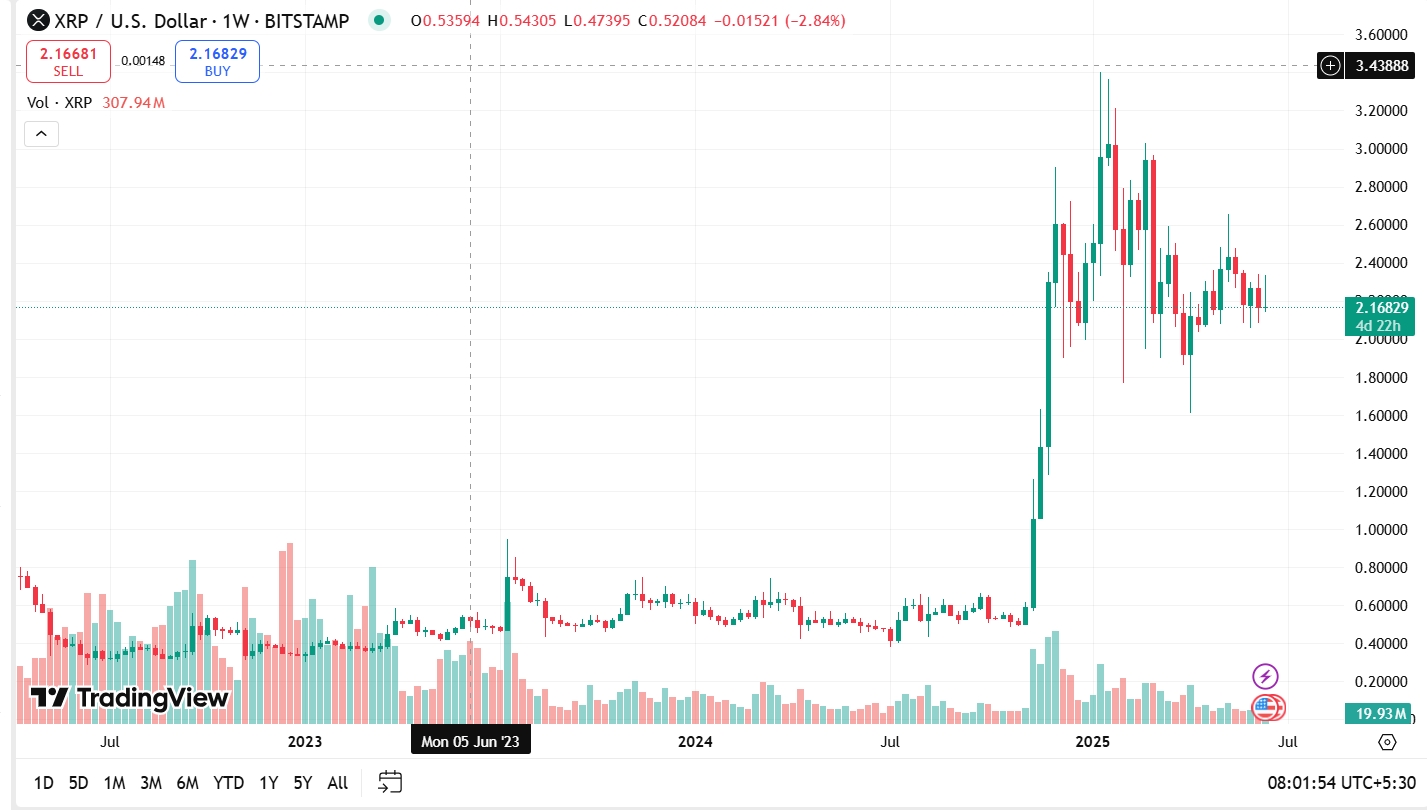
Looking at XRP’s daily price chart, the market
Looking at XRP’s daily price chart, the market currently shows weak momentum in both directions. The price action remains choppy and range-bound, stuck between $2.10 and $2.35 for now. Unless the price breaks out of this range, traders expect XRP to continue moving sideways in the short term.
Important support levels to watch are between $2.10 and $2.05. If XRP falls below this range with confirmation, the next support lies between $1.95 and $1.91, followed by $1.80. On the bullish front, resistance is seen around $2.32 to $2.36. A clear move above this could open the door for a rally towards $2.44 and $2.60
#Share Your Thoughts on Popular Assets in June#Claim1,200 USDT in the Monthly Creation Challenge#Check In to Win a 20g Gold Bar
5Share
All Comments0LatestHot