Audiera Price Forecast: BEAT Soars 40% in a Week, Bulls Targeting $4.68 Resistance

cryptonews.ruPublicado a 2026-07-29Actualizado a 2026-07-29

Resumen

Audiera (BEAT) has shown renewed strength, surging 36.79% in 24 hours and over 40% for the week to trade around $3.65. This recovery follows a sharp correction from June's peak above $11.40. Technical indicators have improved, with the 20-day EMA ($2.91) above the 50-day EMA ($2.65), signaling regained buyer control. Key resistance is at $4.68, aligned with the 38.2% Fibonacci level. A break above could target $5.97 and $7.26, with the $9.10-$11.44 zone representing major previous highs. Support lies at $3.08 (23.6% Fib) and the 20-day EMA at $2.91. A drop below $2.91 could lead to a deeper pullback. Derivatives data shows open interest stabilizing at around $81.87 million, down from over $350 million in June, indicating a more balanced market with less excessive leverage. Recent spot flows show modest net inflows, suggesting renewed accumulation. The short-term outlook depends on bulls defending the $2.91-$3.08 support area while building momentum toward the $4.68 resistance. A confirmed breakout above this level would signal a stronger recovery, while failure could lead to consolidation near current supports.

Audiera ($BEAT) is showing renewed strength following a sharp correction after its June peak above $11.40. The token recently gained momentum, rising 36.79% in the last 24 hours and 40.28% over the past seven days. Currently, $BEAT is trading around $3.65, with a market cap of approximately $1.13 billion.

The recent recovery reflects improving market sentiment as buyers return after weeks of consolidation. Furthermore, technical indicators suggest that $BEAT has regained strength, although traders remain cautious about short-term volatility and key resistance levels ahead.

Technical Forecast for $BEAT Shows Improved Bullish Structure

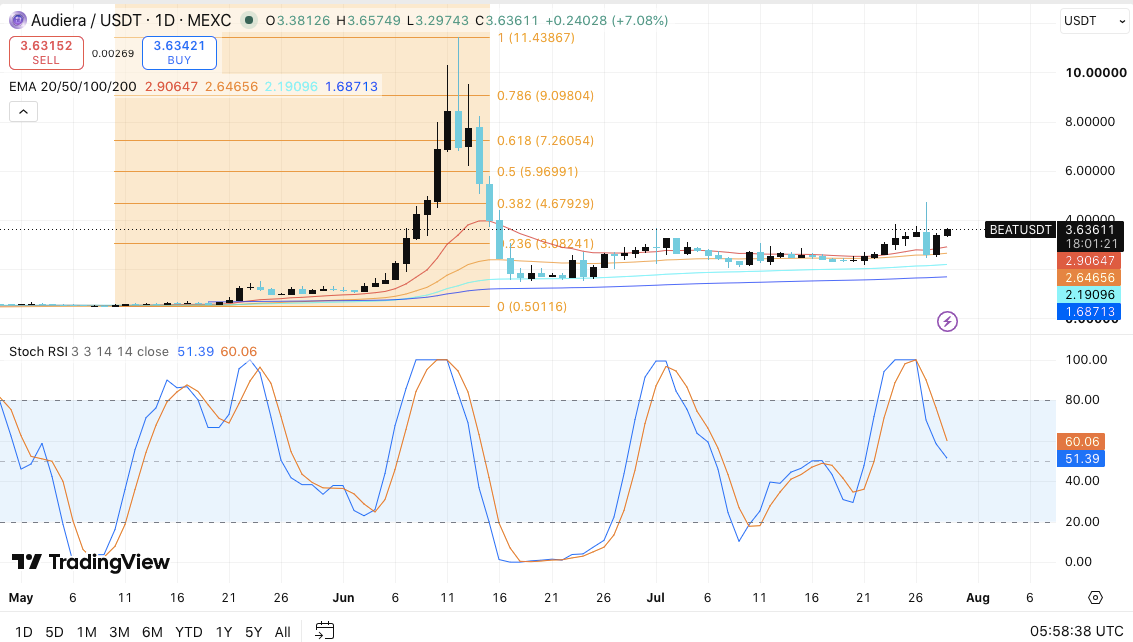
The daily chart of $BEAT/USDT shows a gradual recovery phase after the previous decline. The token is currently trading above its major exponential moving averages, signaling improved medium-term strength.

The 20-day EMA at $2.91 has risen above the 50-day EMA at $2.65. Moreover, both averages remain above the 100-day EMA at $2.19 and the 200-day EMA at $1.69.
Audiera Price Dynamics (Source: Trading View)

This moving average alignment indicates that buyers have regained control. However, $BEAT still needs sustained buying pressure to confirm a full trend reversal. The first major resistance lies at $4.68, which coincides with the 38.2% Fibonacci retracement level. A breakout above this zone could open the path to $5.97 and $7.26.

Furthermore, the $7.26 level represents a significant test for the bulls, as it could confirm a stronger recovery. If momentum is sustained, $BEAT could eventually challenge the resistance zone between $9.10 and $11.44. This area contains previous highs and could attract increased selling activity.

Support Levels and Market Momentum

The short-term outlook for $BEAT largely depends on whether buyers can defend key support areas. The $3.08 level, associated with the 23.6% Fibonacci retracement, remains the first support zone. Additionally, the 20-day EMA at $2.91 provides another layer of defense for the current bullish setup.

A drop below $2.91 could weaken market confidence and expose the token to further decline. Consequently, traders may view the 50-day EMA at $2.65 as the next crucial defensive level.

The Stochastic RSI has started to decline from overbought territory. This suggests that short-term momentum may weaken following the recent rally. Therefore, $BEAT may undergo consolidation before attempting another upward move.

Derivatives Activity Stabilizes After June Volatility

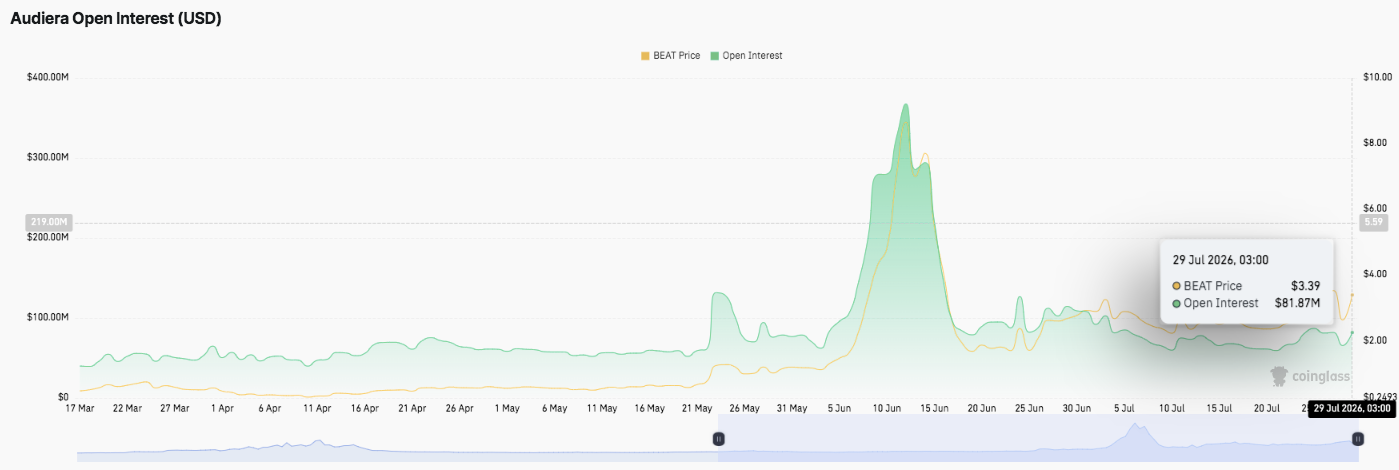
Audiera's open interest data shows significant shifts in trader positioning over recent months. During the rally in early June, open interest surged above $350 million as leveraged traders increased their exposure. This rise reflected strong speculative interest during $BEAT's explosive price movement.
Source: CoinGlass

However, open interest sharply declined following the market reversal. The drop indicates widespread position unwinding and reduced leverage among derivative traders. Since mid-June, open interest has stabilized between $60 million and $120 million.

The latest figure is around $81.87 million, while $BEAT trades around $3.39. This points to a more balanced derivatives market without excessive leverage buildup. Importantly, stable open interest could provide a healthier foundation for future price movements.

Spot Flows Indicate Renewed Investor Interest
Source: CoinGlass

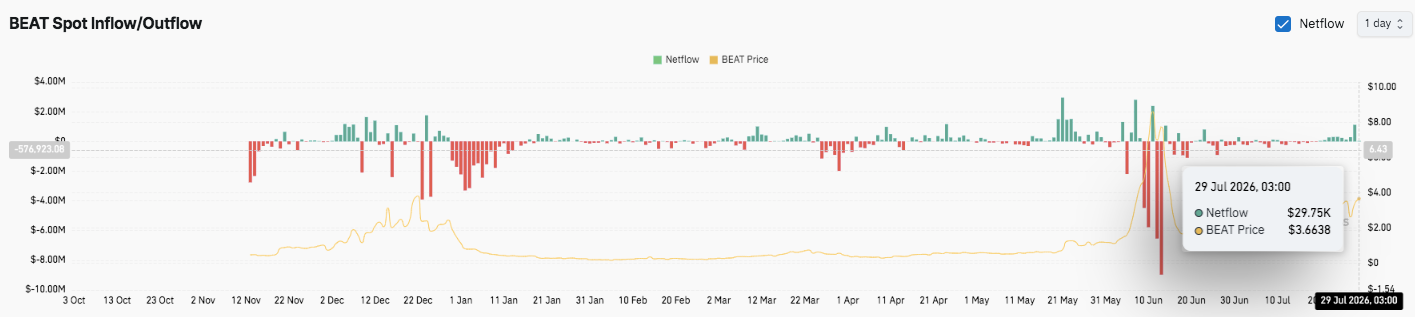
$BEAT's spot inflow and outflow data reveal mixed but improving investor activity. Previous periods recorded significant outflows, indicating profit-taking after the strong rally. Additionally, several large spikes in inflows and outflows occurred during volatile trading sessions in June.

Recently, market activity has become more balanced, with net flows turning slightly positive. The latest data shows an inflow of approximately $29.75 thousand, suggesting renewed accumulation among investors.

Audiera Price Technical Overview

Key levels remain clearly defined for Audiera ($BEAT) as the token attempts to extend its recovery following the June correction.

Upside Levels: $4.68 remains the immediate resistance zone, followed by $5.97 and $7.26, which align with key Fibonacci retracement levels. A decisive breakout above $7.26 could reinforce bullish momentum and open the path to $9.10 and the previous high zone around $11.44.

Downside Levels: $3.08 represents the first major support zone, followed by the 20-day EMA at $2.91 and the 50-day EMA at $2.65. A deeper correction could reveal a broader support area between the 100-day EMA at $2.19 and the 200-day EMA at $1.69.

Resistance Ceiling: The $4.68 level remains a critical barrier for the bulls. A successful daily close above this zone would confirm intensifying buy-side pressure and increase the likelihood of a sustained recovery. However, failure to overcome this resistance could lead to consolidation around current support levels.

Will the Audiera Price Rise?

Audiera's near-term direction hinges on whether buyers can maintain support above the $2.91-$3.08 area while building momentum towards the $4.68 resistance. The recent recovery, improved EMA structure, and balanced derivatives activity point to a gradual improvement in market sentiment. Additionally, modestly positive spot flows suggest renewed investor interest after the June sell-off.

If bullish momentum strengthens and trading volume increases, $BEAT could challenge $5.97 and $7.26 before targeting higher resistance near $9.10. However, losing the $2.91 support would weaken the recovery and increase the risk of a pullback to $2.65 or lower. For now, $BEAT remains in a crucial recovery phase, and technical confirmation coupled with sustained buyer participation will likely determine the next major move.

end-content

Criptos en tendencia

Preguntas relacionadas

QWhat are the current price and recent weekly performance of Audiera (BEAT) according to the article?

AThe current price is around $3.65. Over the past week, it has risen by 40.28%.

QWhat is the immediate key resistance level that BEAT needs to overcome to continue its bullish momentum?

AThe immediate key resistance level is at $4.68, which coincides with the 38.2% Fibonacci retracement level.

QWhat do the Moving Average alignments suggest about the market structure for BEAT?

AThe 20-day EMA ($2.91) is above the 50-day EMA ($2.65), and both are above the 100-day and 200-day EMAs. This alignment indicates that buyers have regained control, signaling an improving medium-term bullish structure.

QHow has the Open Interest for BEAT derivatives changed since June, and what does the current level suggest?

AOpen Interest spiked above $350 million during the June rally but sharply declined afterward. It has since stabilized around $60–120 million, with the latest figure at approximately $81.87 million. This suggests a more balanced derivatives market with less excessive leverage, providing a healthier foundation for future price moves.

QWhat are the two critical short-term support levels for BEAT mentioned in the technical analysis?

AThe first key support level is at $3.08, associated with the 23.6% Fibonacci level. The second is the 20-day Exponential Moving Average at $2.91. A break below $2.91 could weaken market confidence.

Lecturas Relacionadas

Hackers piratean una popular biblioteca para desarrolladores de JS: por qué la vulnerabilidad de npm es peligrosa para la cripto

Los hackers obtuvieron acceso a la cuenta de un desarrollador que mantiene keyv, un popular conjunto de herramientas de software utilizado por millones de programadores en todo el mundo. A través de este acceso, los atacantes insertaron código malicioso en nuevas versiones, en un incidente detectado por Aikido Security a partir del 4 de agosto de 2026. Este ataque comprometió cientos de paquetes de software descargados más de 2 mil millones de veces al mes. La infección ocurría automáticamente al ejecutar el comando `npm install`. Una vez en el sistema, el virus buscaba datos sensibles como contraseñas de npm, claves de acceso de GitHub, credenciales de AWS (Amazon), claves SSH, archivos de contraseñas de KeePass, configuraciones de editores de código (como VS Code y Claude) y, de forma crítica, archivos de carteras de criptomonedas (incluyendo Solana y Monero), frases semilla y claves privadas. Estos datos se enviaban a servidores controlados por los hackers. El virus se autorreplicaba utilizando las credenciales robadas para infectar más paquetes populares con la misma línea de código maliciosa, publicando actualizaciones falsas. Según informes, entre 444 y 868 paquetes, en miles de versiones, ya estaban comprometidos. Este caso es particularmente peligroso para la industria de las criptomonedas. Si el virus infecta a un desarrollador de un proyecto cripto, los atacantes pueden obtener acceso a claves de carteras, servidores y repositorios de código, facilitando grandes robos. Este incidente representa la tercera ola de la campaña "Shai-Hulud", iniciada en septiembre de 2025, lo que indica un problema sistémico de confianza en el ecosistema npm. Subraya la necesidad de una verificación extrema de las herramientas de software utilizadas en este sector.

cryptonews.ruHace 7 min(s)

Hackers piratean una popular biblioteca para desarrolladores de JS: por qué la vulnerabilidad de npm es peligrosa para la cripto

cryptonews.ruHace 7 min(s)

¡JP Morgan advierte sobre el peligro de este altcoin! ¿Por qué los inversores están retirando fondos? Aquí están los detalles

Aunque en el segmento de ETF de bitcoin y altcoins se observan diversas tendencias, un ETF en particular está siendo vigilado de cerca por los inversores. A pesar de que el ETF $HYPE logró un gran éxito en muy poco tiempo, su ritmo de crecimiento se ha ralentizado recientemente. JPMorgan señaló que el flujo de entrada de fondos hacia los ETF que ofrecen oportunidades de inversión en el token nativo de Hyperliquid, $HYPE, se desaceleró en julio y principios de agosto. Según el banco, esto sugiere que los inversores tienen cada vez más dudas sobre la competitividad futura de $HYPE. Los analistas de JPMorgan destacaron que, aunque los ETF $HYPE mostraron uno de los mayores flujos de entrada en mayo y junio (excluyendo los de bitcoin), esta situación favorable comenzó a cambiar en julio. El informe subraya no solo la desaceleración, sino también preocupaciones sobre la competitividad a largo plazo de Hyperliquid, pronosticando posibles dificultades para que plataformas descentralizadas como esta ganen cuota de mercado. Para los inversores, esta ralentización no significa que la demanda institucional haya desaparecido, pero la incapacidad de mantener el fuerte impulso previo puede indicar una mayor cautela. Según JPMorgan, una nueva aceleración en los flujos hacia el ETF $HYPE podría ser un indicador clave de que disminuyen las preocupaciones sobre su competitividad.

cryptonews.ruHace 1 hora(s)

¡JP Morgan advierte sobre el peligro de este altcoin! ¿Por qué los inversores están retirando fondos? Aquí están los detalles

cryptonews.ruHace 1 hora(s)

Trading

Spot

Artículos destacados

Cómo comprar BEAT

¡Bienvenido a HTX.com! Hemos hecho que comprar Audiera (BEAT) sea simple y conveniente. Sigue nuestra guía paso a paso para iniciar tu viaje de criptos.Paso 1: crea tu cuenta HTXUtiliza tu correo electrónico o número de teléfono para registrarte y obtener una cuenta gratuita en HTX. Experimenta un proceso de registro sin complicaciones y desbloquea todas las funciones.Obtener mi cuentaPaso 2: ve a Comprar cripto y elige tu método de pagoTarjeta de crédito/débito: usa tu Visa o Mastercard para comprar Audiera (BEAT) al instante.Saldo: utiliza fondos del saldo de tu cuenta HTX para tradear sin problemas.Terceros: hemos agregado métodos de pago populares como Google Pay y Apple Pay para mejorar la comodidad.P2P: tradear directamente con otros usuarios en HTX.Over-the-Counter (OTC): ofrecemos servicios personalizados y tipos de cambio competitivos para los traders.Paso 3: guarda tu Audiera (BEAT)Después de comprar tu Audiera (BEAT), guárdalo en tu cuenta HTX. Alternativamente, puedes enviarlo a otro lugar mediante transferencia blockchain o utilizarlo para tradear otras criptomonedas.Paso 4: tradear Audiera (BEAT)Tradear fácilmente con Audiera (BEAT) en HTX's mercado spot. Simplemente accede a tu cuenta, selecciona tu par de trading, ejecuta tus trades y monitorea en tiempo real. Ofrecemos una experiencia fácil de usar tanto para principiantes como para traders experimentados.

607 Vistas totalesPublicado en 2026.01.22Actualizado en 2026.06.02

Cómo comprar BEAT

Discusiones

Bienvenido a la comunidad de HTX. Aquí puedes mantenerte informado sobre los últimos desarrollos de la plataforma y acceder a análisis profesionales del mercado. A continuación se presentan las opiniones de los usuarios sobre el precio de BEAT (BEAT).

活动图片