TL,DR
- March's macro environment was generally bearish: The Fed kept rates unchanged and sent hawkish signals; sticky inflation, rising oil prices, and weakening employment reinforced "stagflation" concerns, significantly pushing back rate cut expectations. Meanwhile, US stocks weakened amid tariff uncertainties and geopolitical risks, putting overall pressure on risk assets. Looking ahead to April, the market will continue to grapple with inflation, non-farm payrolls, and policy paths. While the crypto market was boosted by clearer regulations, it still faces macro and political pressures.
- March trading volume showed "sporadic surges followed by rapid declines," with multiple extreme price swings lacking sustainability, indicating short-term driven capital. The total market cap fluctuated mildly, peaking mid-month before retreating to the $2.45–$2.50 trillion range, showing overall weak momentum.
- Both BTC and ETH spot ETFs shifted from net outflows to net inflows in March, with asset规模和 prices recovering同步. ETH saw stronger capital回流 and price elasticity, reflecting a marginal recovery in risk appetite and capital flowing back into higher-volatility assets. Meanwhile, the total stablecoin supply shifted from contraction to mild expansion but became more concentrated towards major players, indicating that although new liquidity is returning to the market, the overall phase is still one of cautious repair rather than full-risk expansion.
- BTC traded within a $62,000–$74,000 range in March, currently around $69,000–$71,000, generally between the $65,000–$67,000 support and $72,000–$75,000 resistance. A directional move requires配合 from the macro environment. ETH performed relatively weaker, mainly oscillating between $1,900–$2,200. It was pressured short-term by slowing ETF inflows and the hawkish FOMC; it needs to hold above $2,200 to signal a turnaround. SOL was relatively resilient, trading between $82–$97, currently around $88–$92. Structurally, it maintains a range-bound pattern; short-term focus is on a break above $95–$97 resistance or below $82 support.
- The SEC and CFTC jointly established a digital asset classification framework, clearly categorizing BTC, ETH, and 14 other major assets as "digital commodities," and introduced a "Token Safe Harbor" concept. This marks a significant reduction in regulatory uncertainty and provides a key legal foundation for institutional entry. Meanwhile, BlackRock launched an Ethereum ETF (ETHB) that distributes staking rewards, pushing crypto ETFs from pure price tools towards yield-generating assets. However, incidents like Resolv highlight that industry risks are shifting from on-chain vulnerabilities to off-chain infrastructure and private key management, further elevating the importance of security systems.
- April will be a critical window for crypto regulation and legislation. If the CLARITY Act makes breakthroughs in committee and advances to a vote, it will form a complete regulatory loop with the SEC/CFTC classification framework, significantly boosting policy certainty for institutional entry. Conversely, stalled progress could pressure market mood. Meanwhile, the Ethereum Glamsterdam upgrade enters a key testing phase, coupled with expectations of an expanding staking ETF ecosystem, which will support ETH's mid-term fundamentals and strengthen the long-term logic for institutional participation in the Ethereum network.
1、Macro Perspective
Policy Direction
On March 18, the Fed's FOMC held its second policy meeting of the year, keeping the federal funds target rate unchanged at 3.50%–3.75% as expected. The market focused most on the dot plot and Chair Powell's hawkish tone during the press conference—the dot plot showed the median projection for 2026 rate cuts remained at one, but disagreement among members widened significantly (some even projected no cuts). Powell emphasized the non-linear nature of disinflation and warned about persistent upside risks from tariffs and energy prices, clearly stating the Committee is in no rush to act and will remain cautiously观望 until inflation and employment data give clear signals. The Fed raised its 2026 PCE inflation forecast to around 2.7%, above previous expectations, further dampening market pricing for rapid rate cuts and pressuring risk assets, including crypto, in late March.
US Stock Market Trends
In March, US stocks generally trended lower with increased volatility, performing noticeably weaker than at the start of the year. In late February, US trade policy tightened again, with market uncertainty around tariffs反复 weighing on risk appetite. Entering March, escalating geopolitical tensions with Iran pushed Brent crude above $100 per barrel, a multi-year high, coupled with recession warnings from several institutions, significantly worsening market sentiment. By mid-March, the S&P 500 had pulled back, showing a clear correction from early-year highs. The VIX fear index spiked, reflecting a shift from tactical profit-taking to broader defensive de-risking by institutions. Within the tech sector, AI computing and infrastructure held up relatively well, but traditional software and fintech faced valuation reassessment pressure, keeping overall risk premiums elevated.
Inflation Data
The US Bureau of Labor Statistics released February 2026 CPI data on March 11: CPI rose 2.4% year-over-year, unchanged from January, and 0.3% month-over-month; Core CPI (excluding food and energy) rose 2.5% YoY and 0.2% MoM, both matching expectations. Inflation data overall held above the Fed's 2% target but did not accelerate further. Notably, services inflation remained sticky, while Middle East conflicts pushed oil prices sharply higher, with Brent surpassing $100, creating renewed pressure from energy-side inflation. Consequently, the Fed raised its inflation forecast at the March FOMC meeting, acknowledging the "last mile" is more challenging than expected, increasing the need to keep rates higher for longer in the near term.
Employment Data
The US Labor Department's February 2026 non-farm payroll report, released in early March, showed an unexpected loss of about 90,000 jobs, a rare post-pandemic decline, significantly weaker than expectations; the unemployment rate rose to about 4.4%, and the labor participation rate edged down. The job decline was mainly influenced by strikes, government sector volatility, and slowing corporate hiring. The unexpected labor market softening provided some support for rate cut expectations, but the共存 of sticky inflation and weakening employment created a "stagflationary signal," putting the Fed in a dilemma: cutting rates could fuel inflation, while standing pat could worsen the economic slowdown. Market expectations for the timing of the first rate cut have largely shifted to the second half of the year.
Political Factors
March saw multiple political and policy uncertainties交织叠加, significantly impacting market sentiment. US trade policy remained volatile, with tariff uncertainties disrupting corporate profits and supply chains. Meanwhile, escalating US-Iran geopolitical tensions constituted the biggest exogenous risk, with oil above $100 directly lifting inflation expectations and dampening consumer confidence. In crypto, regulatory discussions on asset classification and legislative frameworks progressed, maintaining some optimism about long-term合规化, but macro factors still dominated short-term pricing. Gold prices advanced further, staying near historical highs, reflecting strong safe-haven demand. Overall, geopolitical risks, tariff uncertainty, and the FOMC's hawkish stance created a triple pressure, with political factors having a net negative impact on crypto market sentiment.
Next Month Outlook
Looking ahead to April, the market will focus on March CPI and PCE inflation data and the March non-farm payrolls report, which will directly influence the Fed's policy judgment at the May FOMC meeting. Notably, February's weak employment combined with oil above $100 has made "stagflation" concerns a core market narrative; if March data延续 this combination, risk assets will remain under pressure. The trajectory of US-Iran tensions is also a key variable for April; further escalation would reinforce inflation stickiness and increase market volatility. Additionally, Fed Chair Powell's term ends in May 2026, and uncertainty around his successor will gradually become a market focus. For crypto assets, regulatory立法进程 (like the pace of the CLARITY Act) and BTC spot ETF flows remain core watch variables. Whether BTC can hold key support levels and maintain net inflows will determine the next phase's price direction.
2、Crypto Market Overview
Coin Data Analysis
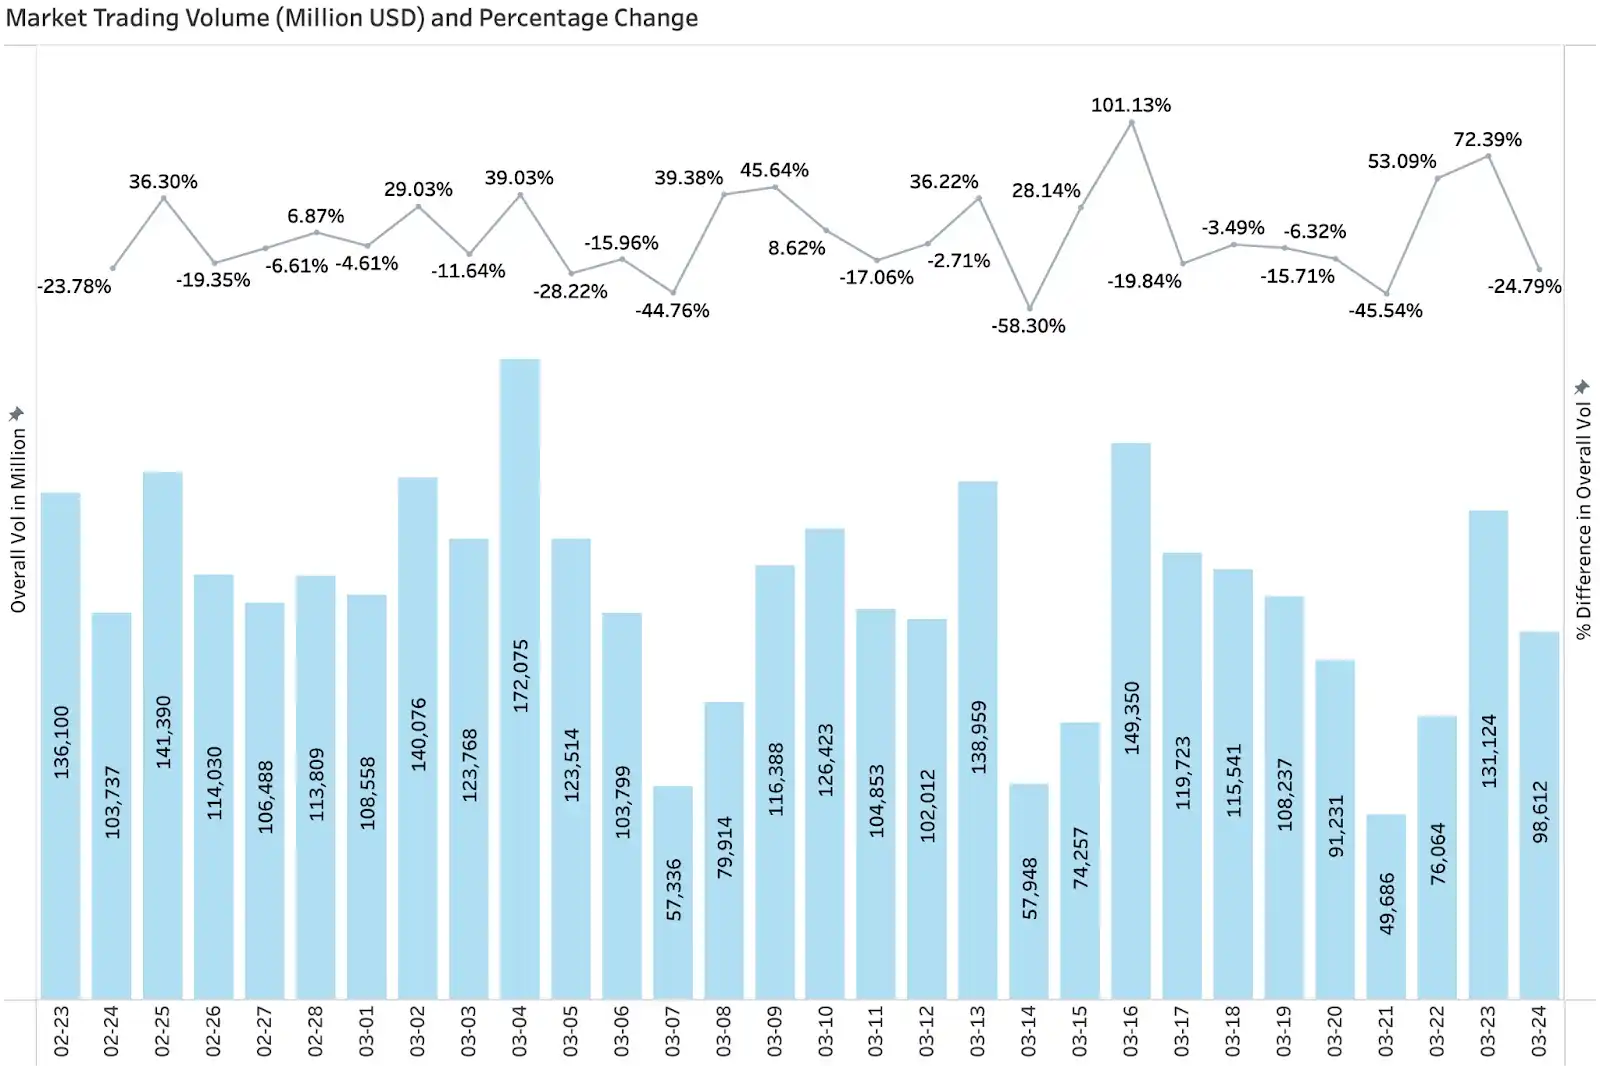
Trading Volume & Daily Growth Rate
According to CoinGecko data, overall market trading volume in March showed a distinct pattern of "sporadic surges followed by rapid declines," with volatility significantly higher than February. Volume quickly expanded to a阶段性 high in early March to around March 4th (approx. $170 billion level), then rapidly retreated; it surged again mid-month driven by sentiment and events, with a single-day increase of 101% on March 16th, but sustainability was still lacking, leading to another period of lower volume. Rhythm-wise, volume spikes were highly concentrated around short-term sentiment catalysts or event shocks (like increased market volatility or on-chain/security事件), while volume remained at low-to-medium levels at other times, indicating capital was primarily driven by short-term speculation and trading, with a continued absence of medium-to-long-term incremental capital. Volume weakened further in late March, accompanied by multiple large negative growth days (e.g., -45%, -24%), indicating a marginal decline in market activity. Overall, while March saw stronger explosive volume spikes at specific points compared to February, the lack of continuous volume means a stable uptrend has not formed, with structural and event-driven行情 still dominant.
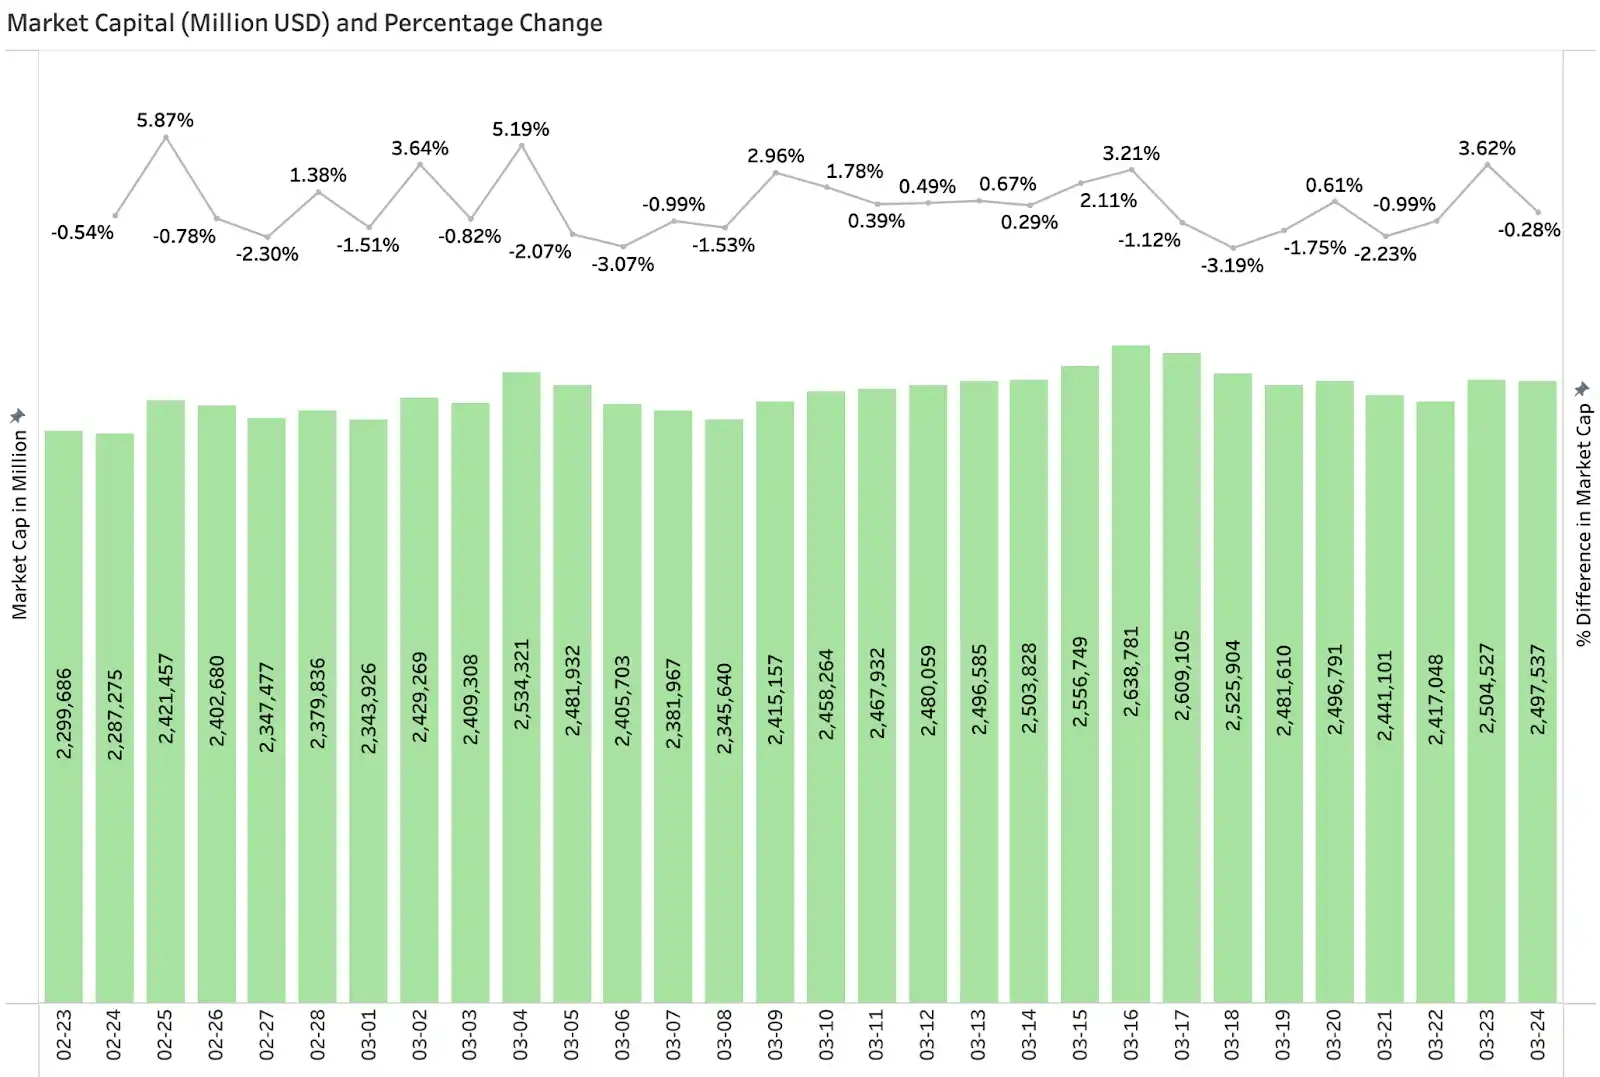
Total Market Cap & Daily Change
According to CoinGecko data, the total crypto market cap in March overall showed a structure of "oscillating upward followed by a pullback and stabilization." It oscillated around $2.3 trillion early in the month, gradually recovered, and reached a阶段性 peak around mid-March (approx. $2.63 trillion). Daily changes were relatively温和 during this period, with most fluctuations within ±3%, indicating修复 but still cautious sentiment. Compared to February, March's market cap movement was more stable, without extreme single-day大幅回撤s, reflecting a阶段性缓解 of systemic risk. However, after the mid-month peak, the market cap pulled back again and oscillated repeatedly in the $2.45–$2.50 trillion range, with weakening growth动能. Overall, the market is currently in a platform consolidation phase post-repair, lacking sustained upward momentum. Risk appetite is still in a repair process, and subsequent trends仍需 rely on improved macro liquidity, sustained ETF inflows, and further policy catalysts.
3、On-Chain Data Analysis
BTC, ETF ETF Inflow/Outflow Analysis
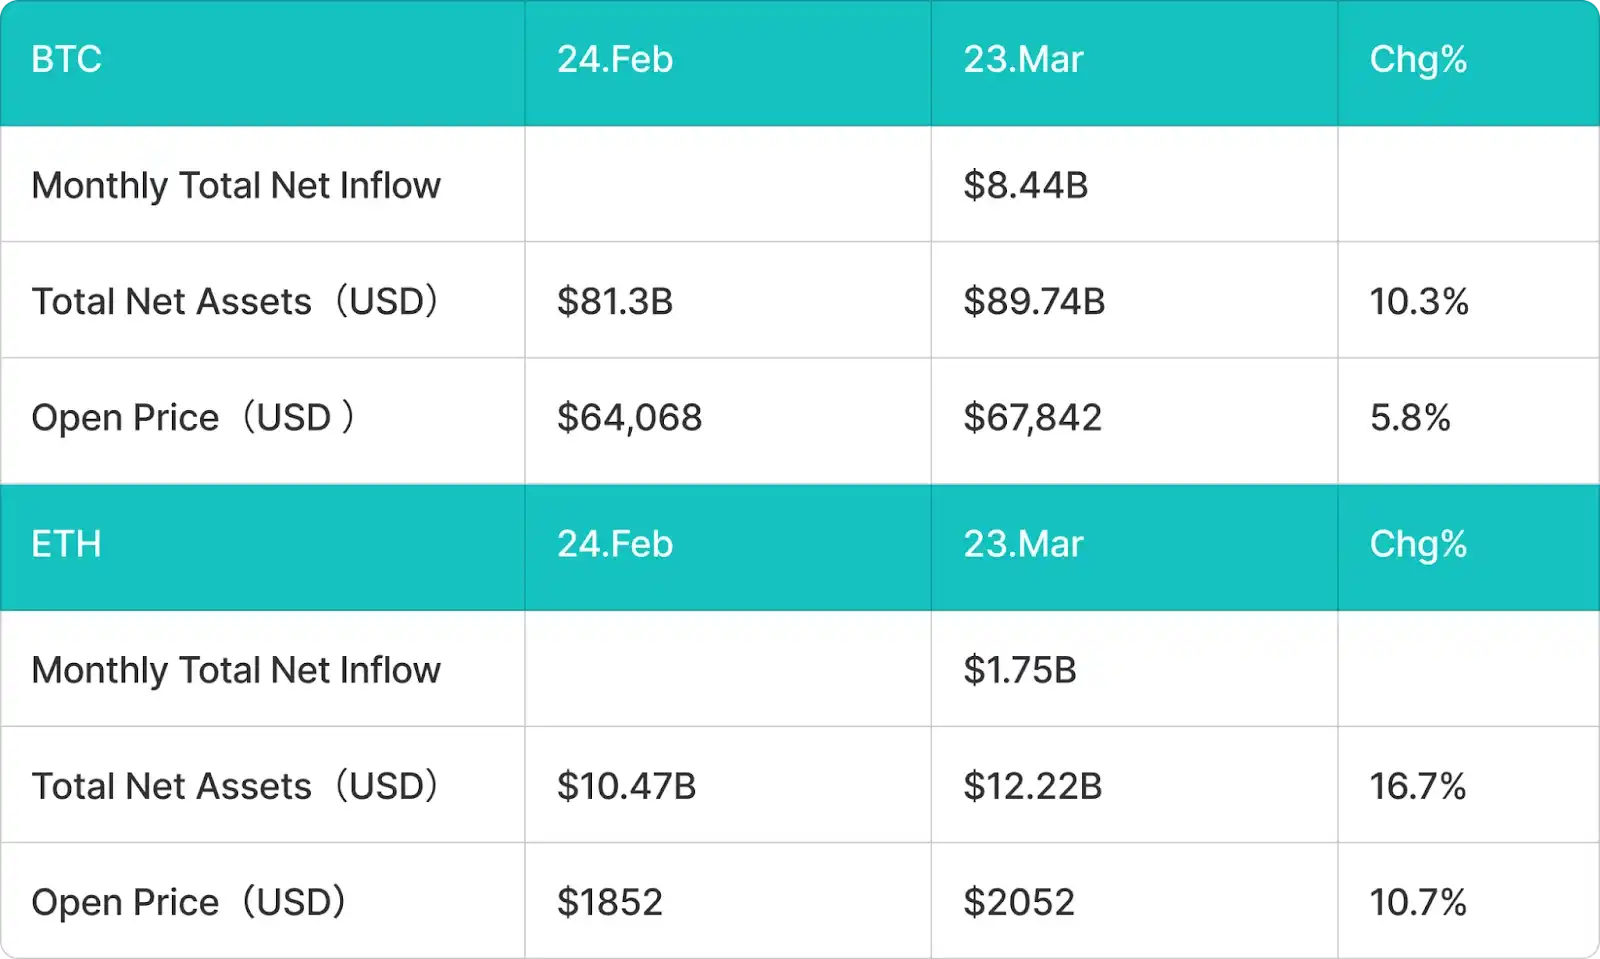
BTC spot ETF flows strengthened noticeably in March, showing an inflection point from net outflows to net inflows. BTC spot ETFs achieved net inflows of approximately $8.44 billion this month. Total net assets increased from about $81.3 billion on February 24th to $89.74 billion, a环比 growth of about 10.3%. Price-wise, BTC rose from around $64,068 at the start of the month to $67,842, a gain of about 5.8%. Overall, the return of ETF inflows and price recovery formed a positive feedback loop, indicating some repair in institutional risk appetite. Compared to February's concentrated outflows, March更像是 a阶段性 reallocation process. On one hand, marginally improved macro liquidity eased pressure on risk assets; on the other, BTC's significant earlier correction made it valuationally attractive, prompting institutions to rebuild exposure. This resulted in a "capital回流 + price stabilization" repair characteristic.
ETH spot ETFs also showed significant improvement in March, shifting from outflows to inflows. ETH spot ETFs saw net inflows of approximately $1.75 billion this month. Total net assets grew from about $10.47 billion to $12.22 billion, a环比 increase of 16.7%. The ETH price rose from $1,852 to $2,052, a gain of about 10.7%. In terms of performance, ETH's capital回流 magnitude and price elasticity were both higher than BTC's, reflecting that during a phase of marginal risk appetite recovery, capital tends to flow back into higher-volatility assets. As an asset prioritized for reduction in February, ETH became a priority for repair in March. However, its overall规模 has not yet returned to previous highs, indicating institutions are currently making tactical re-entries rather than full-scale long-term allocations, maintaining some caution.
Stablecoin Inflow/Outflow Analysis
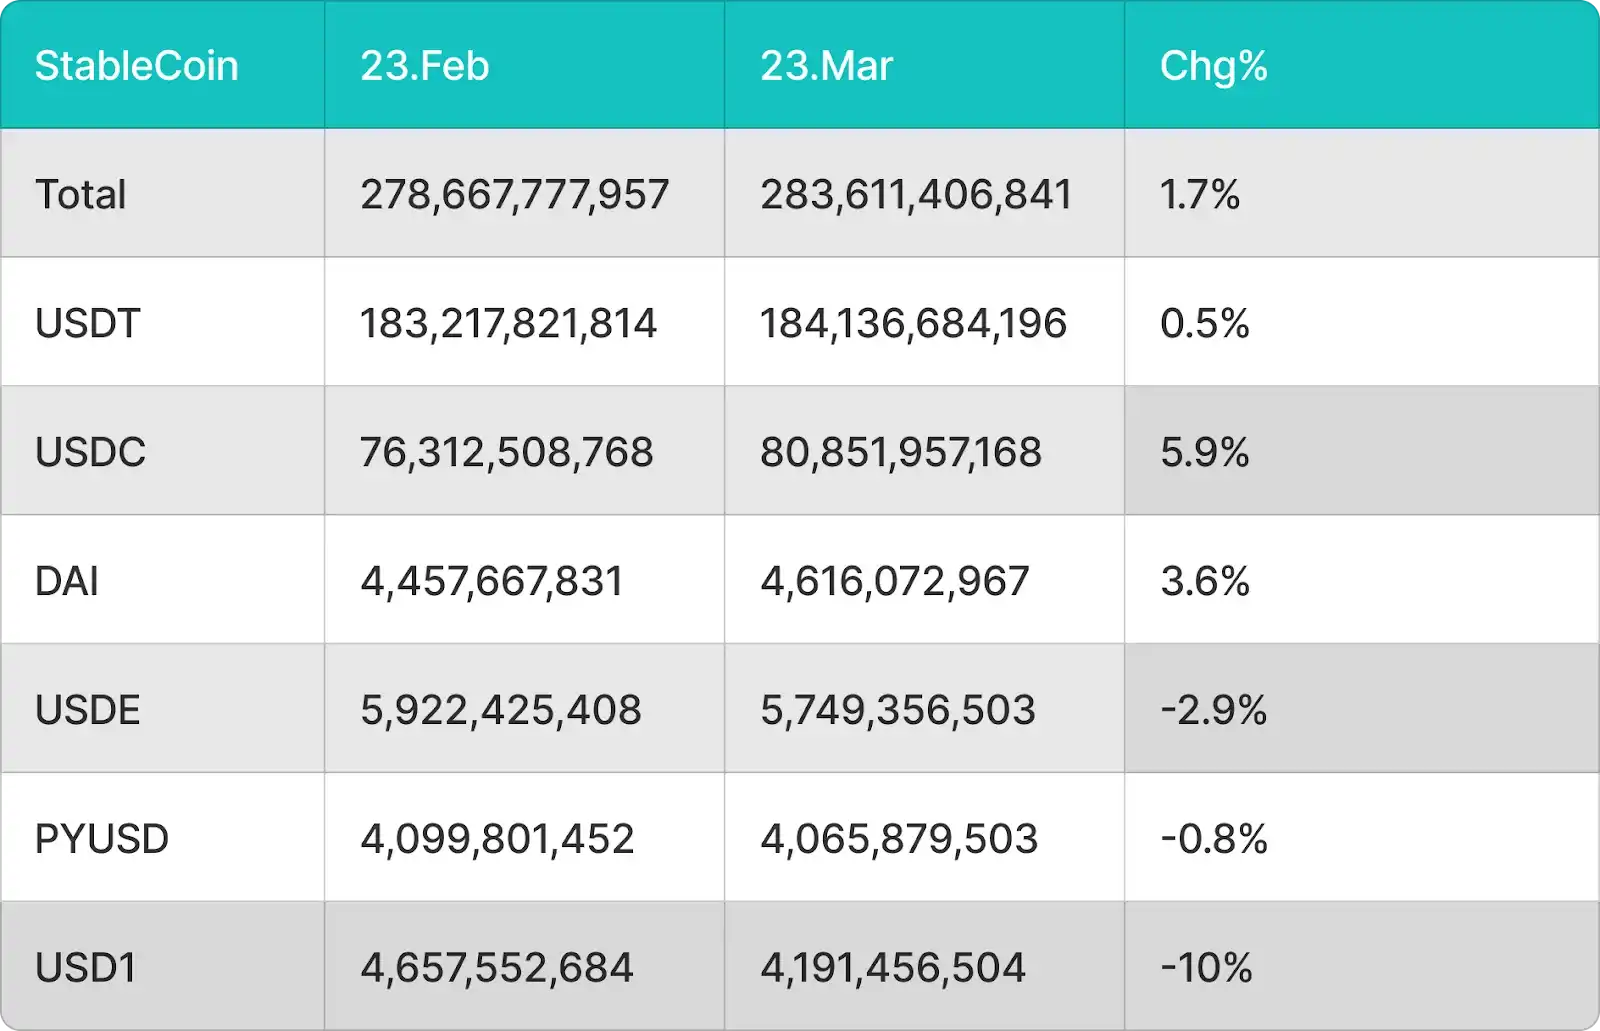
Regarding stablecoins, the overall circulating supply increased from approximately $278.668 billion to $283.611 billion in March, a环比 growth of about 1.7%, shifting from slight contraction in February to mild expansion, indicating marginal improvement in market liquidity. Structurally, USDT grew slightly by about 0.5%, maintaining its dominant position; USDC grew by about 5.9%, the most significant increase, reflecting that compliant stablecoins were favored during the capital回流 phase; DAI grew by about 3.6%, performing relatively steadily. In contrast, USDE, PYUSD, and USD1 decreased by about 2.9%, 0.8%, and 10% respectively, with USD1 seeing the most significant contraction, indicating continued pressure on demand for some non-mainstream or ecosystem-specific stablecoins. Overall, while stablecoins expanded, capital clearly concentrated towards the top, with structural分化 intensifying.
In summary, March showed typical repair characteristics: Both BTC and ETH spot ETFs shifted from net outflows to net inflows, with asset规模和 prices recovering同步; the total stablecoin supply shifted from contraction to expansion, verifying that new capital is re-entering the market. However, structurally, capital remains concentrated in mainstream assets and stablecoins, indicating the current phase is still one of cautious risk appetite recovery—closer to a capital repletion-driven阶段性修复 rather than a comprehensive trending bull market.
4、Price Analysis of Major Cryptocurrencies
Bitcoin (BTC) Price Analysis
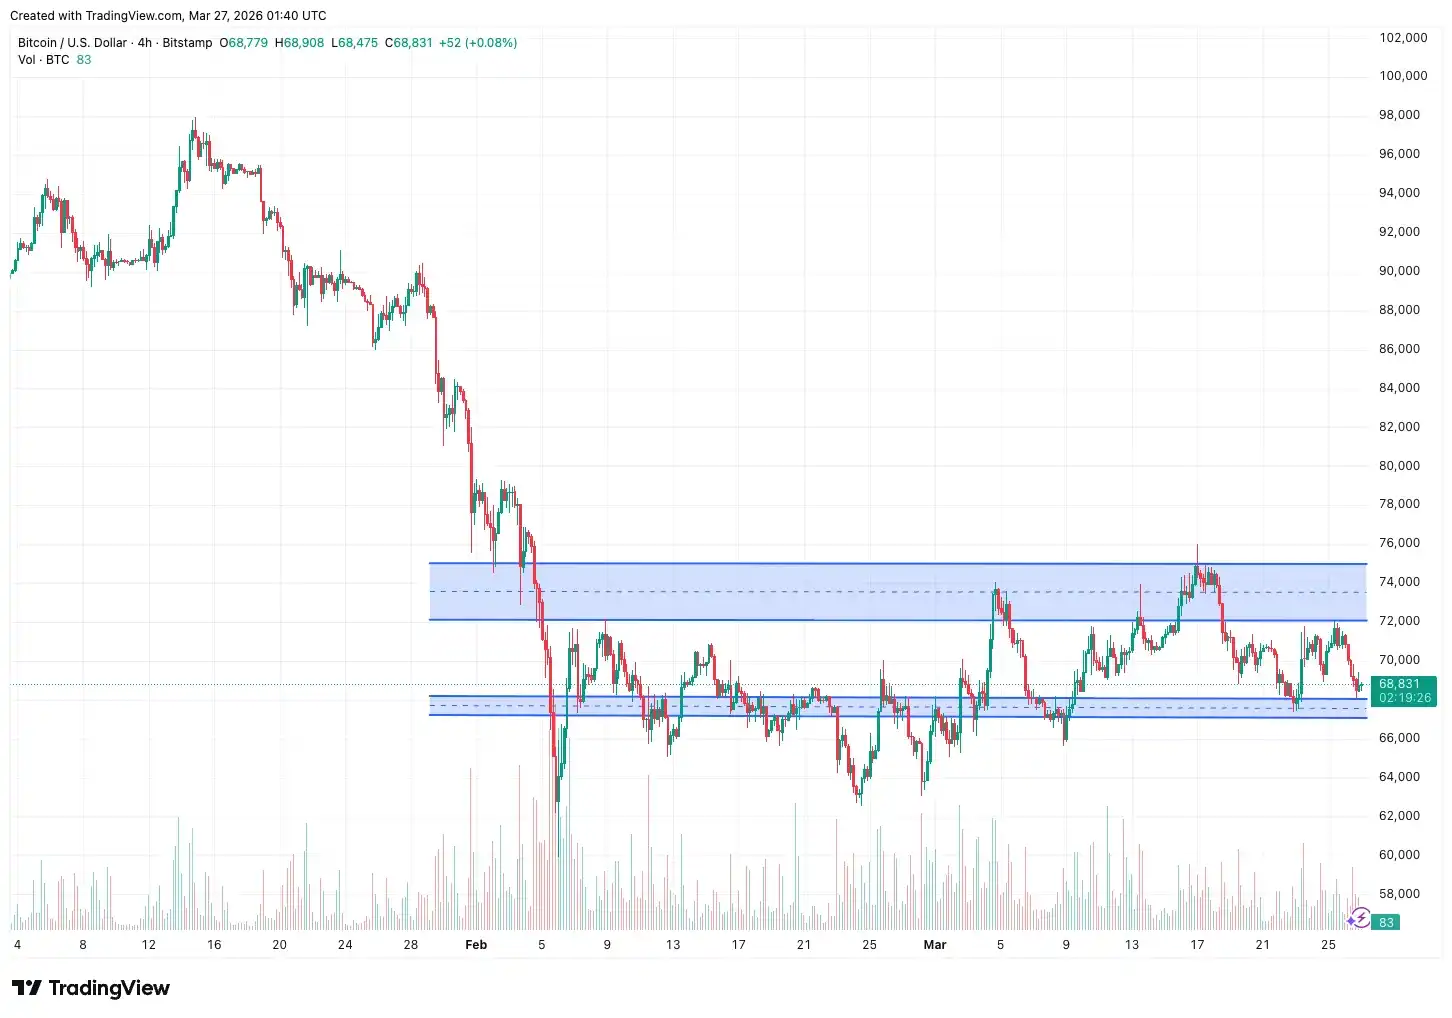
In March, Bitcoin's price experienced wide fluctuations within a $62,000–$74,000 range. After a short-term rebound to around $69,000 on February 25th following the end of five weeks of net outflows, BTC entered a period of range consolidation. Major resistance was concentrated around $72,000–$75,000, which it tested multiple times during the month without a decisive break. Key support below was around $65,000–$67,000; it briefly tested the $63,000–$64,000 zone before quickly bouncing back. Following the hawkish FOMC statement on March 18th, BTC fell about 5% in a day, retesting the $67,000–$68,000 support. As of March 27th, it was trading around $69,000–$71,000, still within the range. A decisive break and hold above $74,000 could open the path for a recovery towards $78,000–$82,000. Conversely, a break below $65,000 could lead to a further decline towards the $60,000–$62,000 medium-term support. Overall, Bitcoin is currently in a range-bound pattern, with $65,000–$67,000 as primary support and $72,000–$75,000 as near-term resistance. A directional breakout signal still requires配合 from an improved macro environment.
Ethereum (ETH) Price Analysis
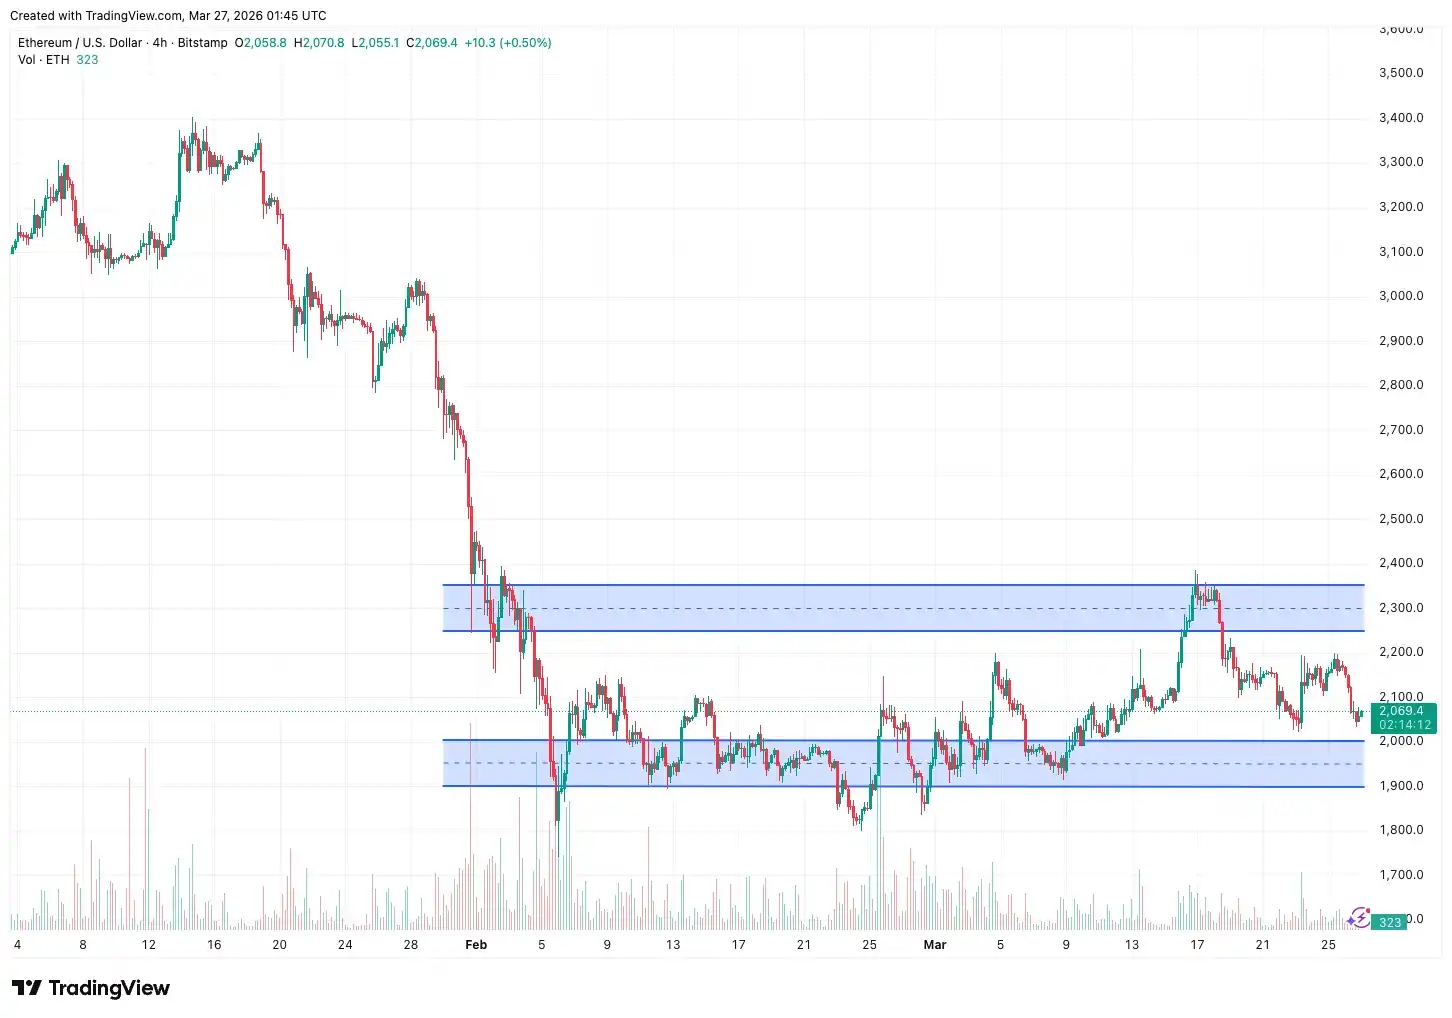
In March, Ethereum's price continued its weak, oscillating trend, overall underperforming Bitcoin. ETH rebounded from around $2,050 at the end of February into range-bound trading, mainly moving between $1,900 and $2,200. As of March 27th, it was around $2,100–$2,200. Key resistance above is first concentrated in the $2,250–$2,350 range, corresponding to short-term dynamic moving averages and previous congestion zones, which have repeatedly capped advances. The $1,900–$2,000 area below is crucial support; a break could lead to a further decline towards the $1,700–$1,800 medium-term key support. Following the hawkish FOMC signals on March 18th, ETH faced short-term pressure, and阶段性 slowing ETF inflows further dampened rebound momentum. The ability to gradually move above $2,200 with volume will be a key indicator for判断 a trend shift from weak to strong. The short-term technical picture remains neutral to weak.
Solana (SOL) Price Analysis
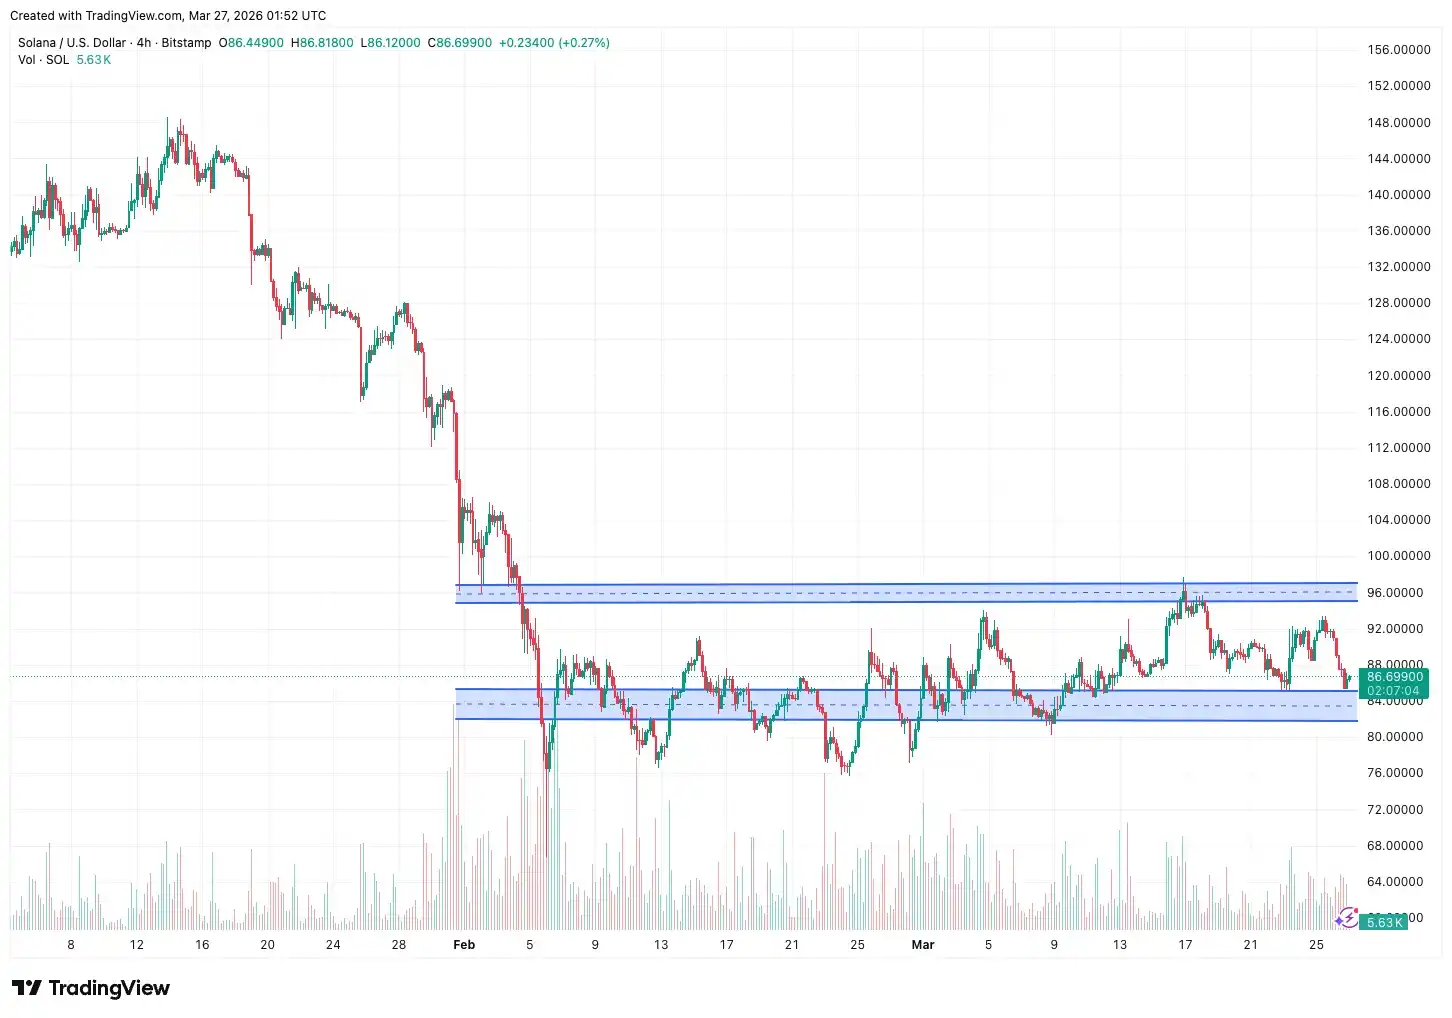
Solana's performance in March was relatively stable, trading within an $82–$97 range, showing some resilience compared to BTC and ETH. As of March 27th, SOL was around $88–$92, slightly changed from the end of February. Short-term support is mainly around $82–$85, a level that has provided a floor multiple times recently; above, $95–$97 is the key resistance zone, corresponding to the mid-March high—a break requires strong volume配合. If SOL can hold firmly above $90 and break above $97 with volume, it could initiate a recovery towards $100–$105. Conversely, a break below $82 could lead to a further decline towards the $75–$78 medium-term support. Overall, SOL's volatility remains high. Until macro risk appetite improves, its price will likely continue seeking a directional breakout within the $82–$97 range.
5、Hot Events of the Month
SEC/CFTC Jointly Issue Crypto Asset Classification Guidance, Officially Designate 16 Assets as "Digital Commodities"
On March 17, the US Securities and Exchange Commission (SEC) and the Commodity Futures Trading Commission (CFTC) jointly released a 68-page interpretive document on crypto asset classification, formally establishing a systematic regulatory framework for the digital asset market. The document designates BTC, ETH, SOL, XRP, Cardano, Chainlink, Avalanche, Polkadot, Stellar, Hedera, Litecoin, Dogecoin, Shiba Inu, Tezos, Bitcoin Cash, and Aptos—16 major crypto assets—as "digital commodities" under CFTC jurisdiction,明确不属于 securities. The overall framework categorizes digital assets into five types: digital commodities, digital collectibles, digital tools, stablecoins, and digital securities. Only digital securities (tokenized versions of traditional financial instruments) remain under full SEC jurisdiction.
This joint interpretation is seen as one of the most significant regulatory breakthroughs in the crypto industry's history. SEC Chair Paul Atkins announced the "Token Safe Harbor" safe harbor provision concept the same day, offering transitional compliance protection for protocols not yet fully decentralized. Following the news, major crypto assets reacted positively. Institutional compliance departments quickly reassessed the configurability of digital assets, and several asset management firms indicated they would accelerate the process of including BTC, ETH, and SOL in investment portfolios. Analysts widely believe this joint agency action ends years of regulatory ambiguity, removing the core legal obstacle for the next wave of institutional entry.
BlackRock Launches Staked Ethereum ETF (ETHB), Spot ETFs Enter the Yield Era
On March 12, the world's largest asset manager, BlackRock, officially listed the iShares Staked Ethereum Trust ETF (ETHB) on Nasdaq, becoming the first US spot ETF that distributes Ethereum staking rewards to investors. The product launched with seed assets of approximately $107 million and saw first-day trading volume of about $15.5 million. At listing, about 80% of its held ETH was already staked on-chain, with a target staking ratio maintained between 70%–95%. Regarding收益分配, ETHB distributes approximately 82% of staking rewards to holders monthly, with a fee of 0.25% (a temporary优惠 of 0.12% for the first $2.5 billion in assets), offering both ETH price exposure and on-chain yield attributes. The key difference from traditional spot ETH ETFs (like BlackRock's ETHA) is that ETHB is a "yield-generating ETF," introducing Ethereum's PoS staking mechanism into a compliant traditional fund structure for the first time.
ETHB's approval is a direct result of the changing US crypto regulatory environment. Previously, former SEC Chair Gensler required all submitted Ethereum ETF applications to剥离 the staking function; the current SEC under Chair Paul Atkins raised no objections to ETHB's staking structure. Simultaneously, the生效 of the GENIUS Act cleared the合规 path for yield-generating crypto products. In terms of market impact, ETHB's launch marks a paradigm shift for US spot crypto ETFs from "pure price tools" to "yield-generating tools," directly competing with traditional yield assets like bonds and REITs. Analysts note that if ETHB's规模 expands rapidly, it will provide sustainable staking demand support for the Ethereum network and push more asset managers to apply for similar products, opening a new entry point for institutional participation in the Ethereum ecosystem.
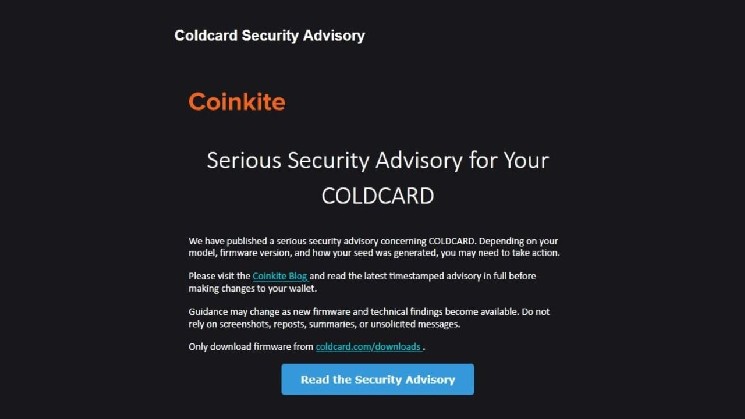
Resolv Labs Hit by Private Key Attack, Frequent Crypto Security Incidents
On March 22, the decentralized yield stablecoin protocol Resolv Labs suffered a severe security incident. Attackers infiltrated its cloud infrastructure, obtained privileged private keys hosted on AWS KMS, bypassed normal minting mechanisms, and illegally minted approximately 80 million USR stable tokens with minimal collateral. They quickly cashed out around $25 million via Curve liquidity pools within a short period, causing the USR price to plummet from $1 to $0.025 in 17 minutes. This incident did not stem from on-chain smart contract vulnerabilities but from failures in off-chain key management and infrastructure security, highlighting the significant risks of concentrating core private keys in a single cloud service environment.
From a broader perspective, the Resolv incident is not isolated. Recent security events, including a reentrancy attack on Solv Protocol, indicate a structural shift in crypto attack patterns: the proportion of traditional smart contract vulnerabilities is decreasing, while "Web2 attack vectors" like private key leaks, cloud service intrusions, and social engineering have become mainstream, accounting for over 76% of stolen funds. Combined with the historical loss of approximately $17 billion in 2025 and the trend of frequent large-scale incidents, the industry has entered a new phase where "off-chain security determines the上限." DeFi protocols must elevate key management (like multi-signature, hardware security modules) and overall operational security systems to the same level of importance as on-chain audits.
6、Next Month Outlook
CLARITY Act Legislative Sprint, April Could Be Key Window for the Year
April will be decisive for whether the CLARITY Act can be passed in 2026. Galaxy Digital's research department clearly stated that if the bill does not complete committee procedures by April, its chances of passing this year are "extremely low." The core controversy lies in whether stablecoins can pay market-based interest—the banking industry advocates strict limits on passive收益, while the crypto industry fights to retain compliant yield space. Senators announced compromise negotiations on this clause on March 10, and Treasury Secretary Bessent signaled that stablecoin legislation could be signed into law in Spring 2026. If negotiations succeed in April and advance to a full vote, it will form a complete historical regulatory breakthrough loop with the March 17 SEC/CFTC joint classification, providing unprecedented policy certainty for institutional allocation. If legislative pace lags again, a "negative expectation reset" effect could阶段性 pressure market sentiment.
Ethereum Glamsterdam Upgrade Process, Staking ETF Ecosystem Expands Rapidly
The Ethereum Glamsterdam upgrade is listed as a core priority for the first half of 2026 by the Foundation, with a target window around June. April will enter the critical testnet verification phase. This upgrade is Ethereum's largest technical iteration since "The Merge," with core goals including: increasing the per-block Gas limit from 60 million to 200 million, targeting network throughput of 10,000 TPS (about 10x current), reducing complex smart contract Gas fees by about 78.6%, and introducing parallel transaction processing and on-chain block building mechanisms, significantly optimizing the MEV structure. If core EIPs progress smoothly on the testnet in April, it will significantly strengthen ETH's mid-term ecosystem expectations and provide fundamental support for its recently weaker price. Regarding staking ETFs, following ETHB's listing, applications for similar products from Franklin Templeton, Grayscale, and others will enter the SEC review window. April may see审批动态 for follow-up products, further expanding the staking ETF ecosystem's规模 and market influence, and providing持续 staking demand support for the Ethereum network.
Powell's Term Ends and Warsh's Potential Succession, Monetary Policy Continuity in Question
Federal Reserve Chair Jerome Powell's term will officially end on May 15, 2026. Trump nominated former Fed Governor Kevin Warsh as his successor on January 30. If confirmed by the Senate, Warsh would assume office in May. This leadership transition will enter its final political博弈 window in April; the timing and wording of the Senate confirmation vote will be highly scrutinized by the market.
Warsh's policy stance is a double-edged sword for the crypto market. Historically labeled a "hawk," he advocated for higher real interest rates and reducing the Fed's balance sheet size—a stance that, if implemented, would pressure risk assets like Bitcoin. However, his recent rhetoric has softened, citing AI-driven productivity gains leading to structural disinflation, providing room for rate cuts, aligning with Trump's desire for lower rates. His attitude towards crypto assets is ambivalent: He has publicly called cryptocurrency "software masquerading as money" and characterized BTC's rise as a "speculative bubble symptom" fueled by loose monetary policy. On the other hand, he has investment records in crypto startups, supports central bank involvement in digital currencies, and is generally evaluated by analysts as "pragmatic rather than hostile."
For the crypto market, Powell's departure itself removes a known policy anchor, while Warsh represents greater uncertainty溢价. If Warsh sends dovish signals during April's confirmation hearings, the market might提前 price in H2 2026 rate cut expectations, boosting crypto assets. If his hawkish stance is reinforced, combined with current inflation stickiness and oil price pressures, it would create a dual压制 on risk appetite. This personnel variable, alongside the CLARITY Act legislative window and macro data, constitutes one of the three core watch points for the crypto market in April.