Executive Summary
- Bull Market Drawdowns remain relatively shallow but in line with historical bull market uptrends. This highlights both the similarities and the relative resiliency of the current cycle.
- Both Short-Term Holder positioning and their spending behaviour have largely improved as the spot price attempts to reclaim the Short-Term Holder cost-basis at $62.5k.
- A significant amount of Futures Open Interest remains in place, which may expose the market to deleveraging and liquidation cascades if significant volatility breaks out.
Technical Damage Report
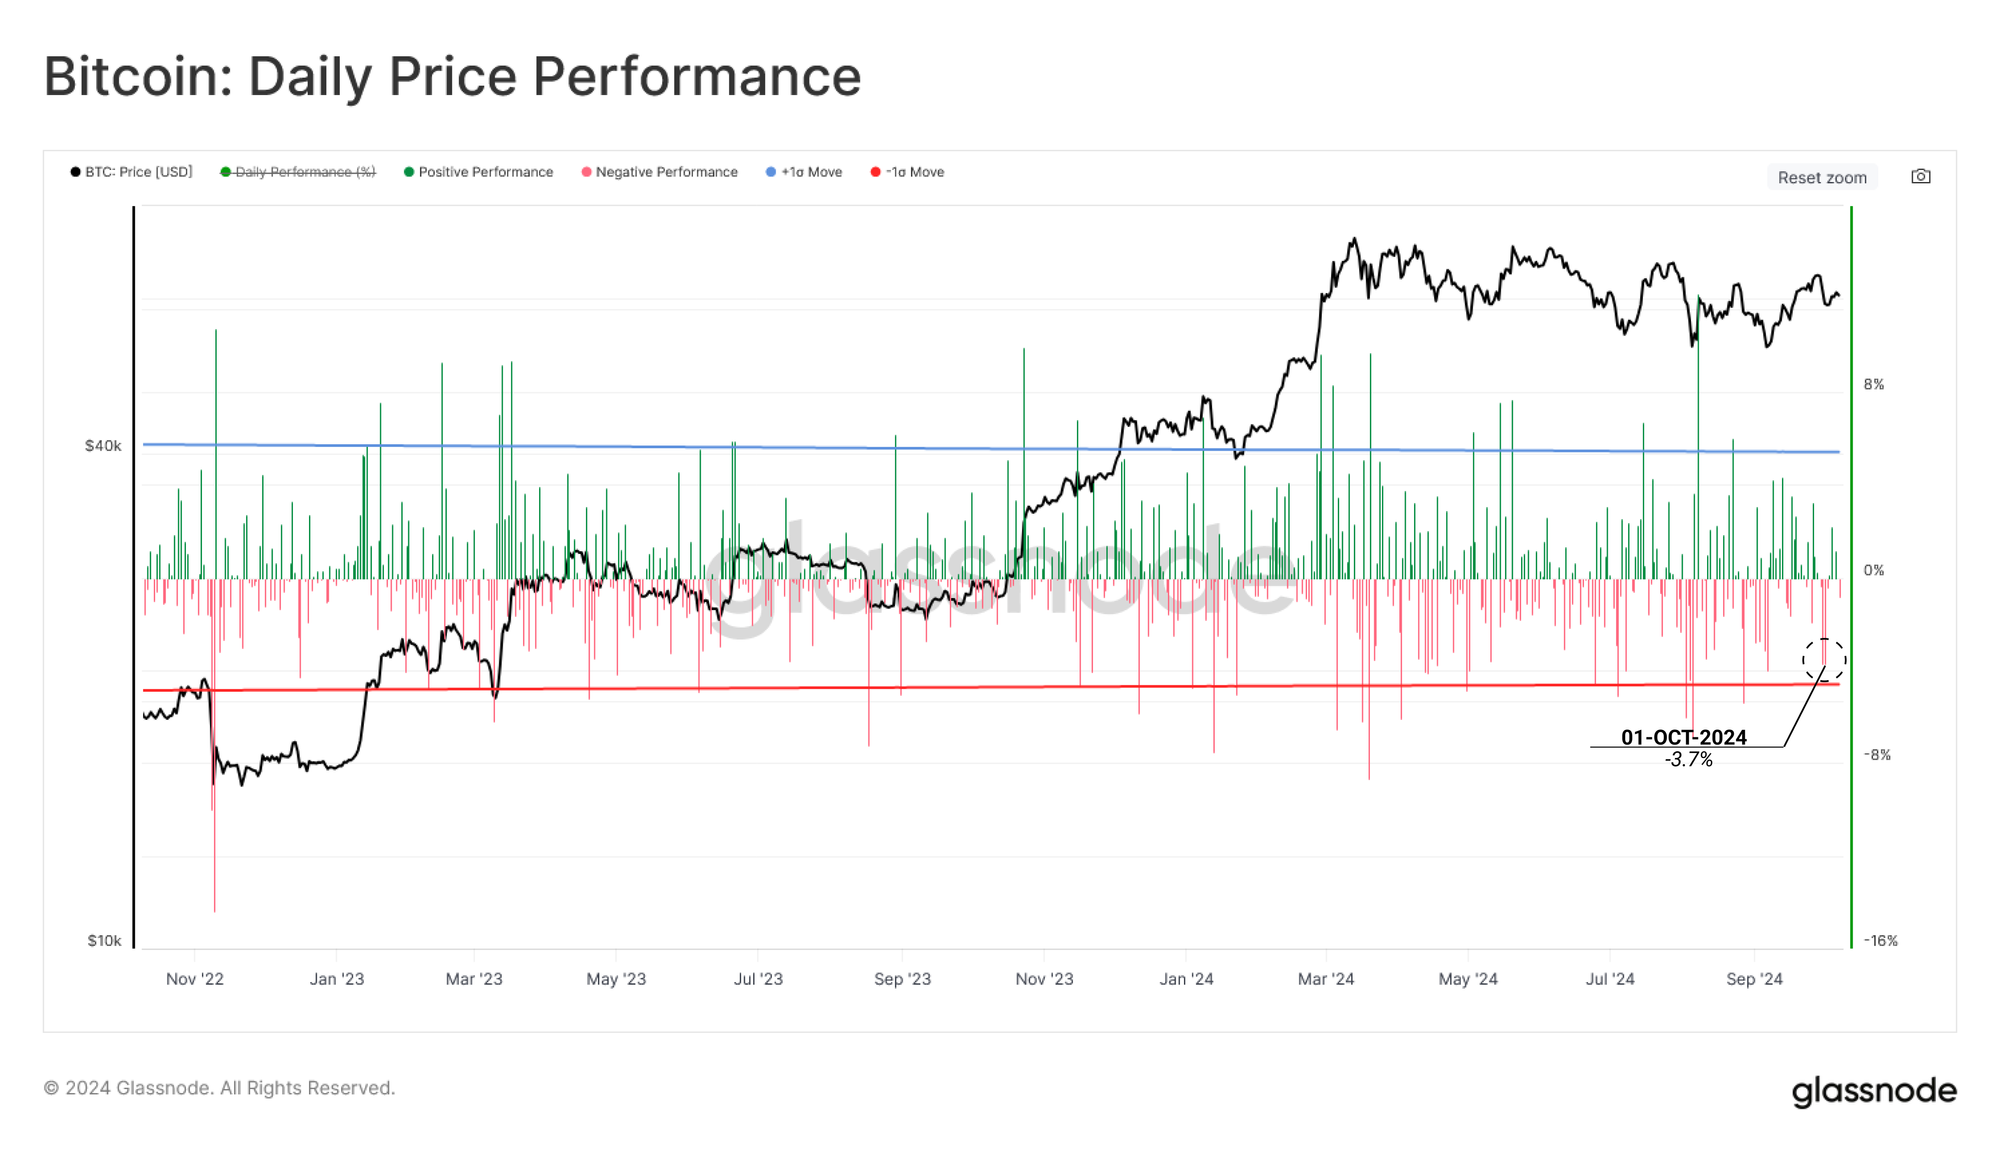
The Bitcoin market is truly unique in that it boasts the deepest liquidity profile at hours where traditional markets are closed for trading, and trades globally in all timezones and jurisdictions. This allows investors to express, trade, and speculate an opinion on the market at any time, which can lead to significant price fluctuations over weekends.
The recent pullback into the $60k region occurred late in the week and was one of the deepest one-day sell-off events since the 2022 cycle low. However, despite the lighter trade volume typically seen over weekends, the market has managed to recover back to close the week at $63.5k.
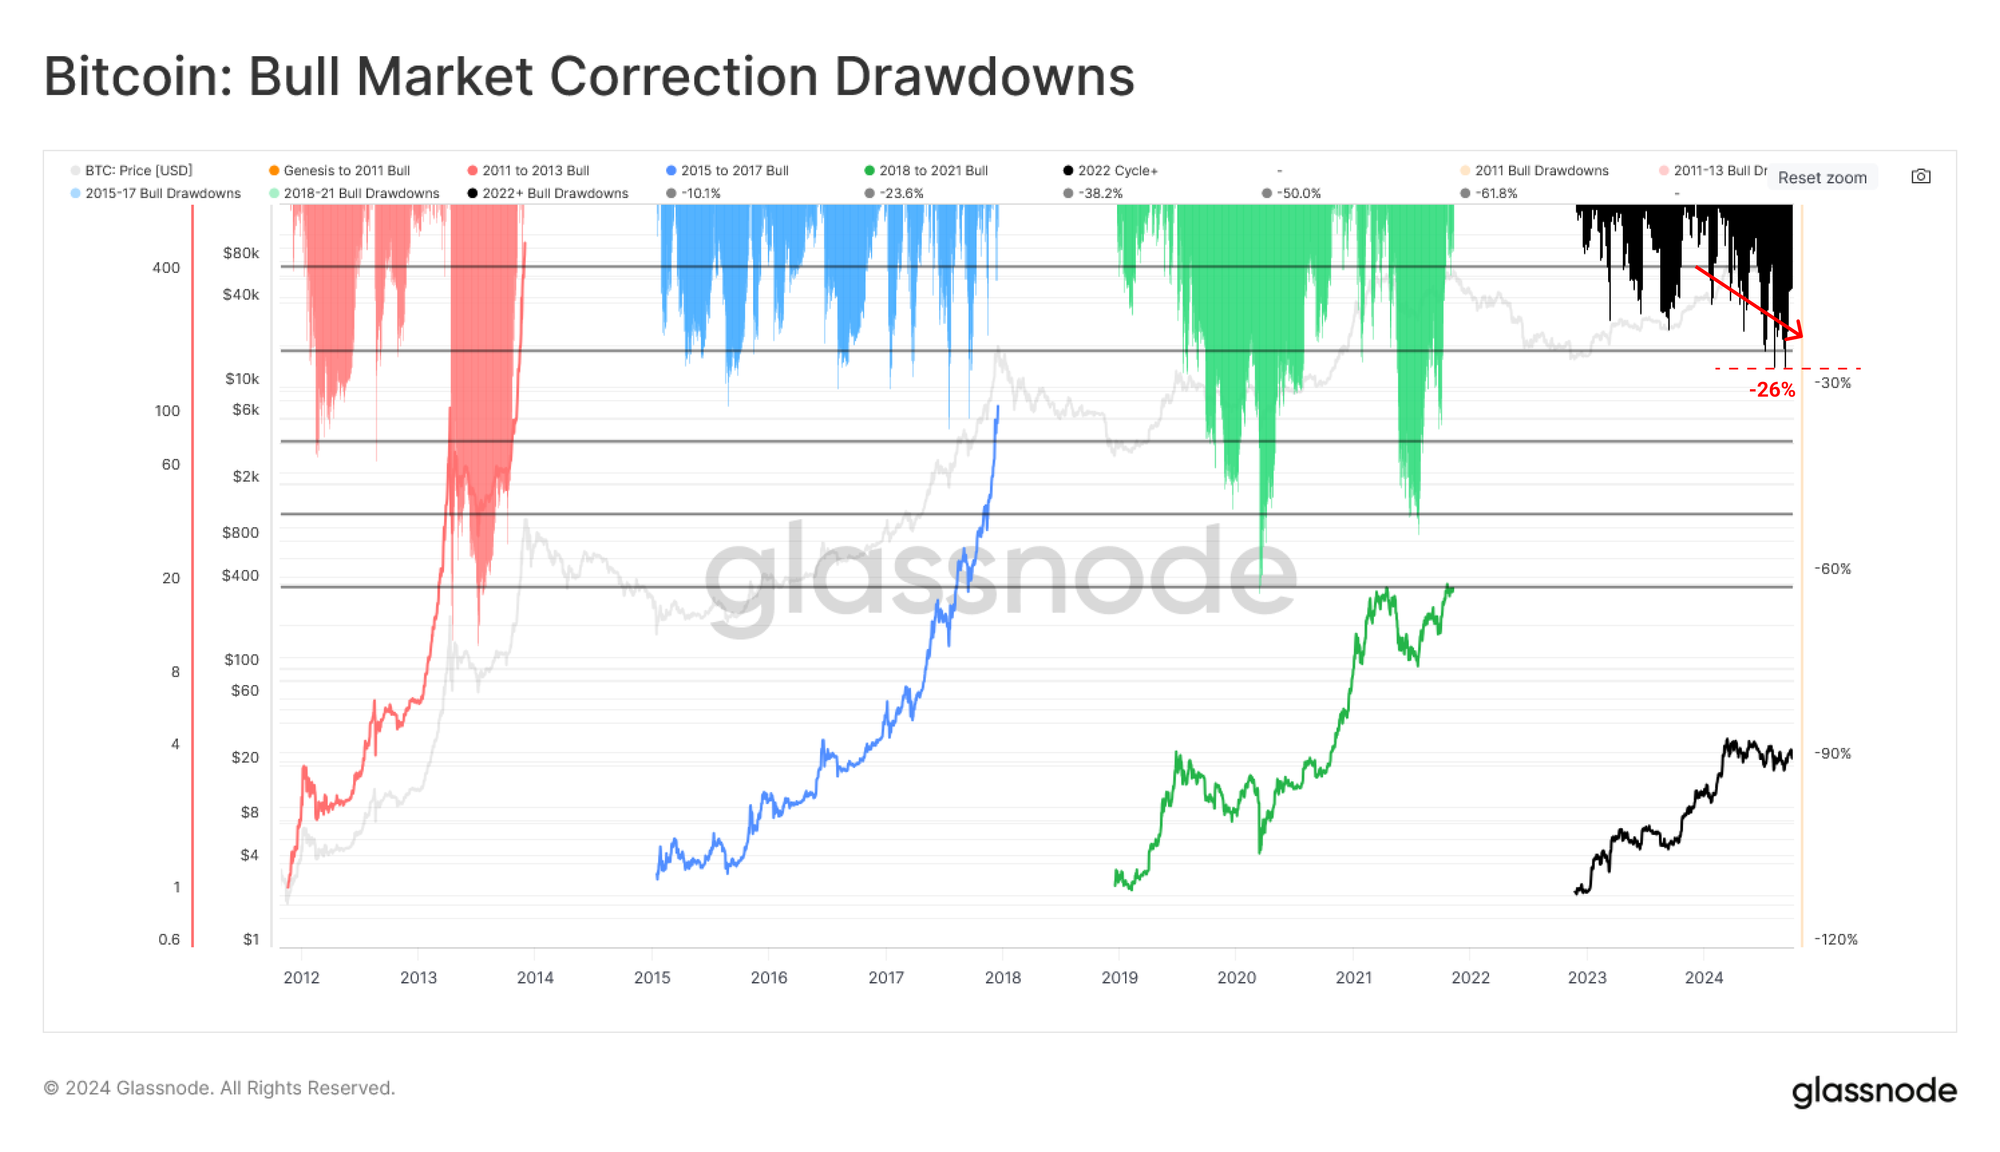
When we evaluate the depth of corrections measured from the local high during bull markets, the 2023-24 drawdown profile is largely in line with previous uptrend cycles. We can also see a relatively high degree of resiliency on the demand side. The maximum drawdown is -26% on a closing basis, which is somewhat shallower than is typically seen during prior cycles.
However, the last few months have been the deepest of this up-cycle, which suggests that this has been one of the more challenging periods since the FTX collapse in late 2022.
Key Pricing Levels
A key tool within the on-chain analysis toolbelt is our ability to assess the average cost basis of various investor cohorts. This provides insight into the financial pressure various groups of investors are experiencing, measured as a derivative of the unrealized paper gains/losses held.
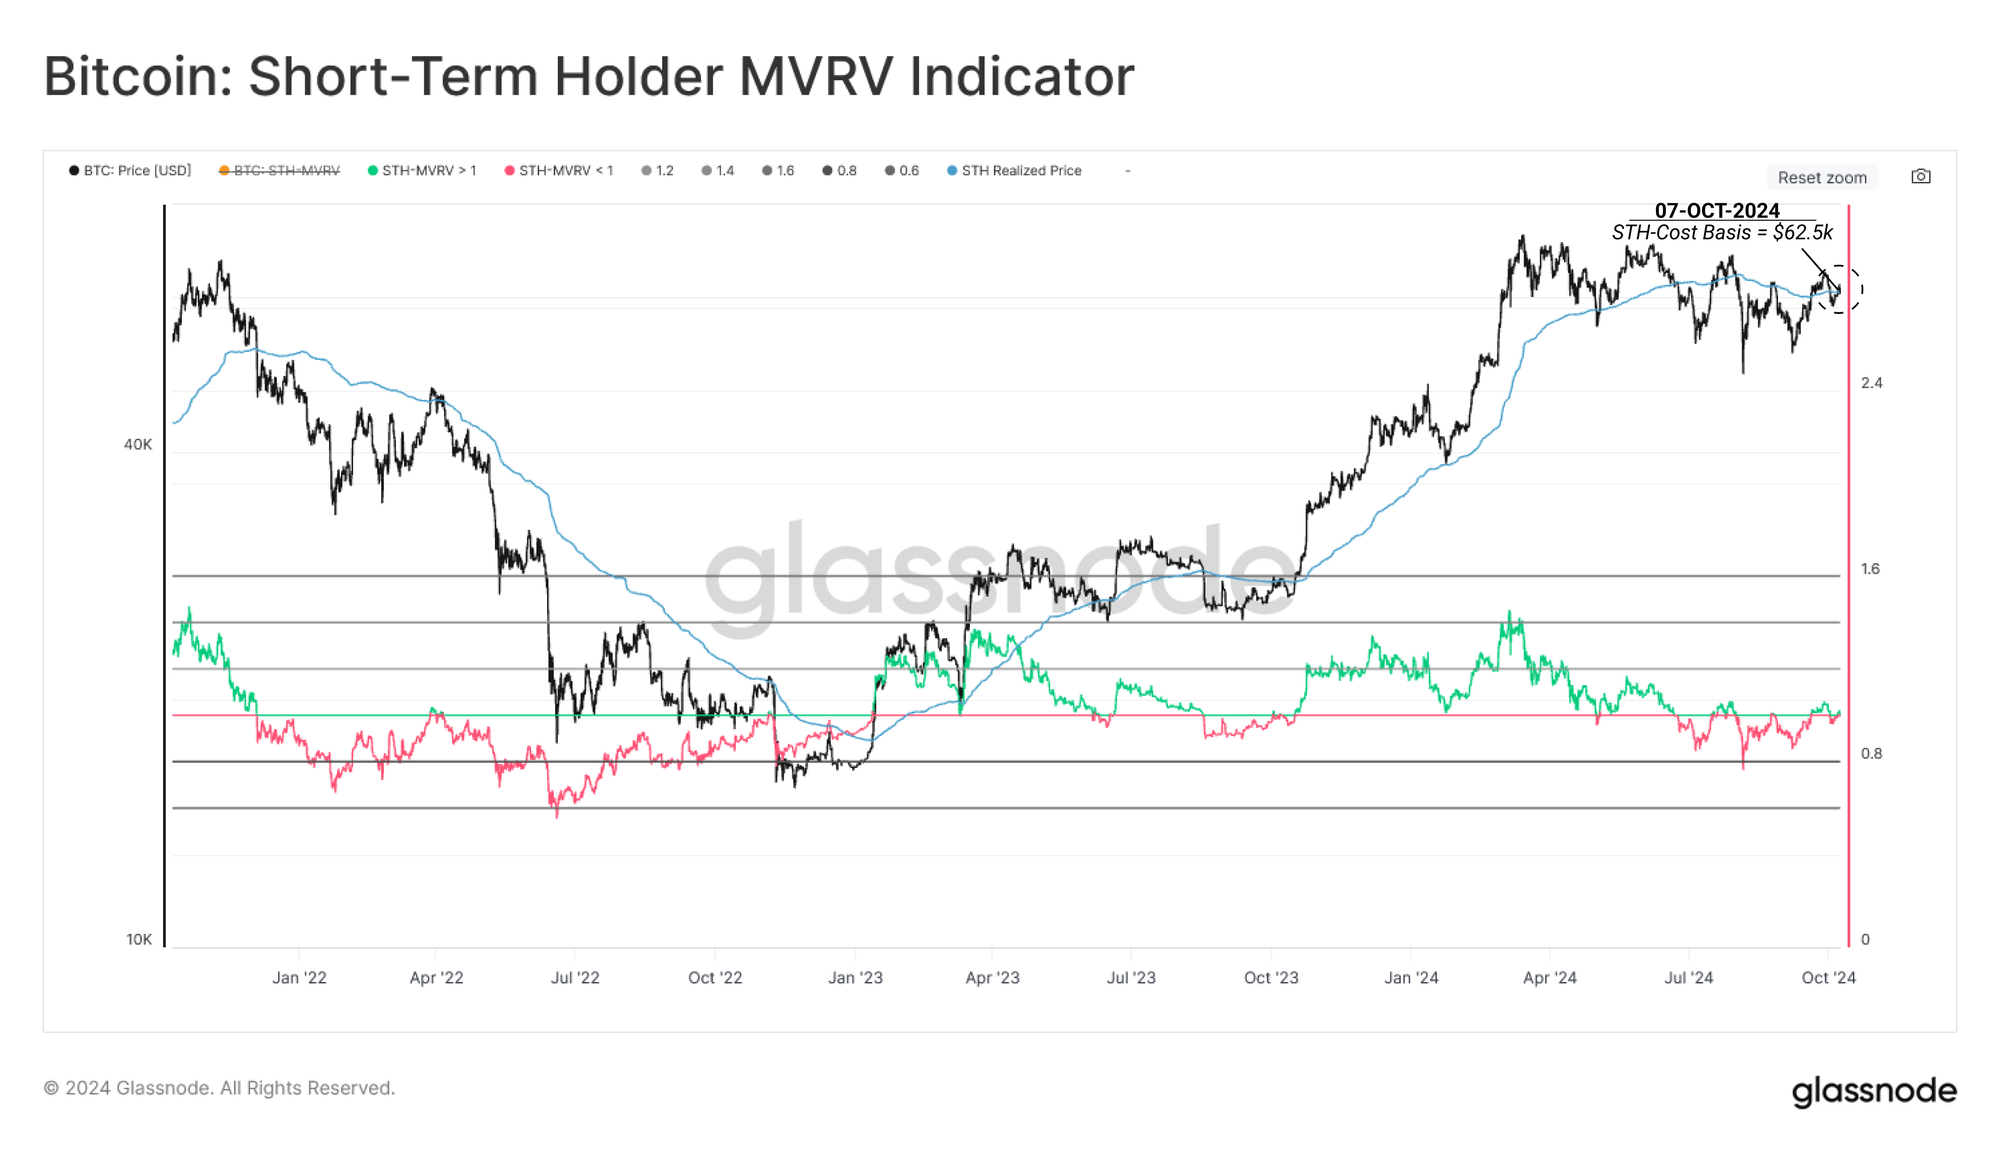
A particularly interesting cohort for understanding near-term price action is the Short-Term Holder cohort, typically characterized as new market demand. The spot price has just accelerated above and reclaimed its critical cost-basis of $62.5k, which is a sign of a relatively constructive nature.
If the market fails to hold above this level, however, it will put a large cohort of recent buyers under increasing pressure, especially considering the last few months of challenging conditions.
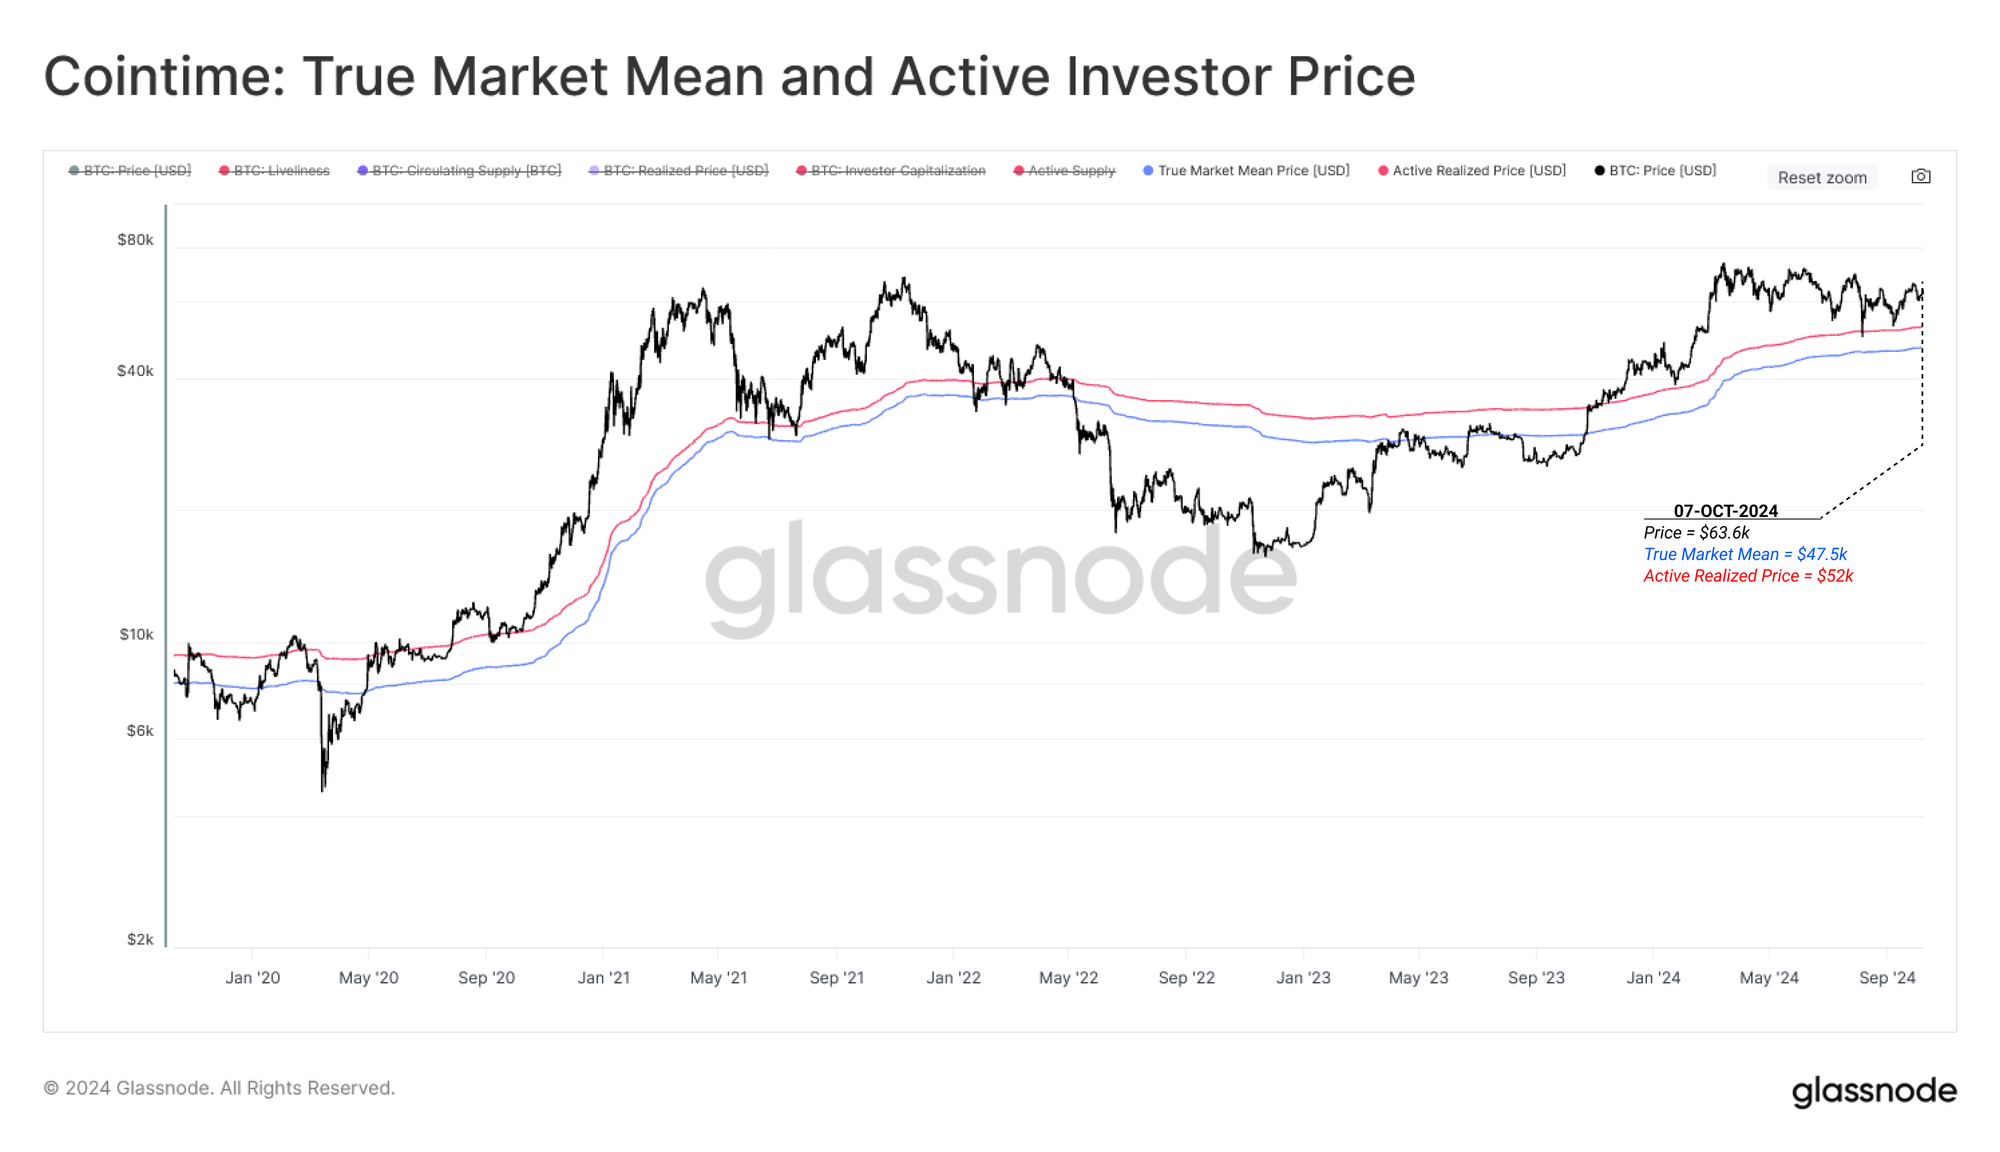
We can also gauge a more macro outlook by utilizing the True-Market Mean ($47k) and the Active Investor Price ($52.5k). Both of these models provide an estimate of the average cost basis for investors who are active within the current cycle (by discounting lost and long-dormant supply).
The position of the spot price relative to these two key pricing levels can be considered a zone of interest for differentiating between macro bull and bear markets.
Year to date, the spot price has traded above both of these price levels, except for a brief excursion below the Active Investor Price during the 5-Aug sell-off. This suggests a relatively robust market, which has tended to provide demand support during market drawdowns.
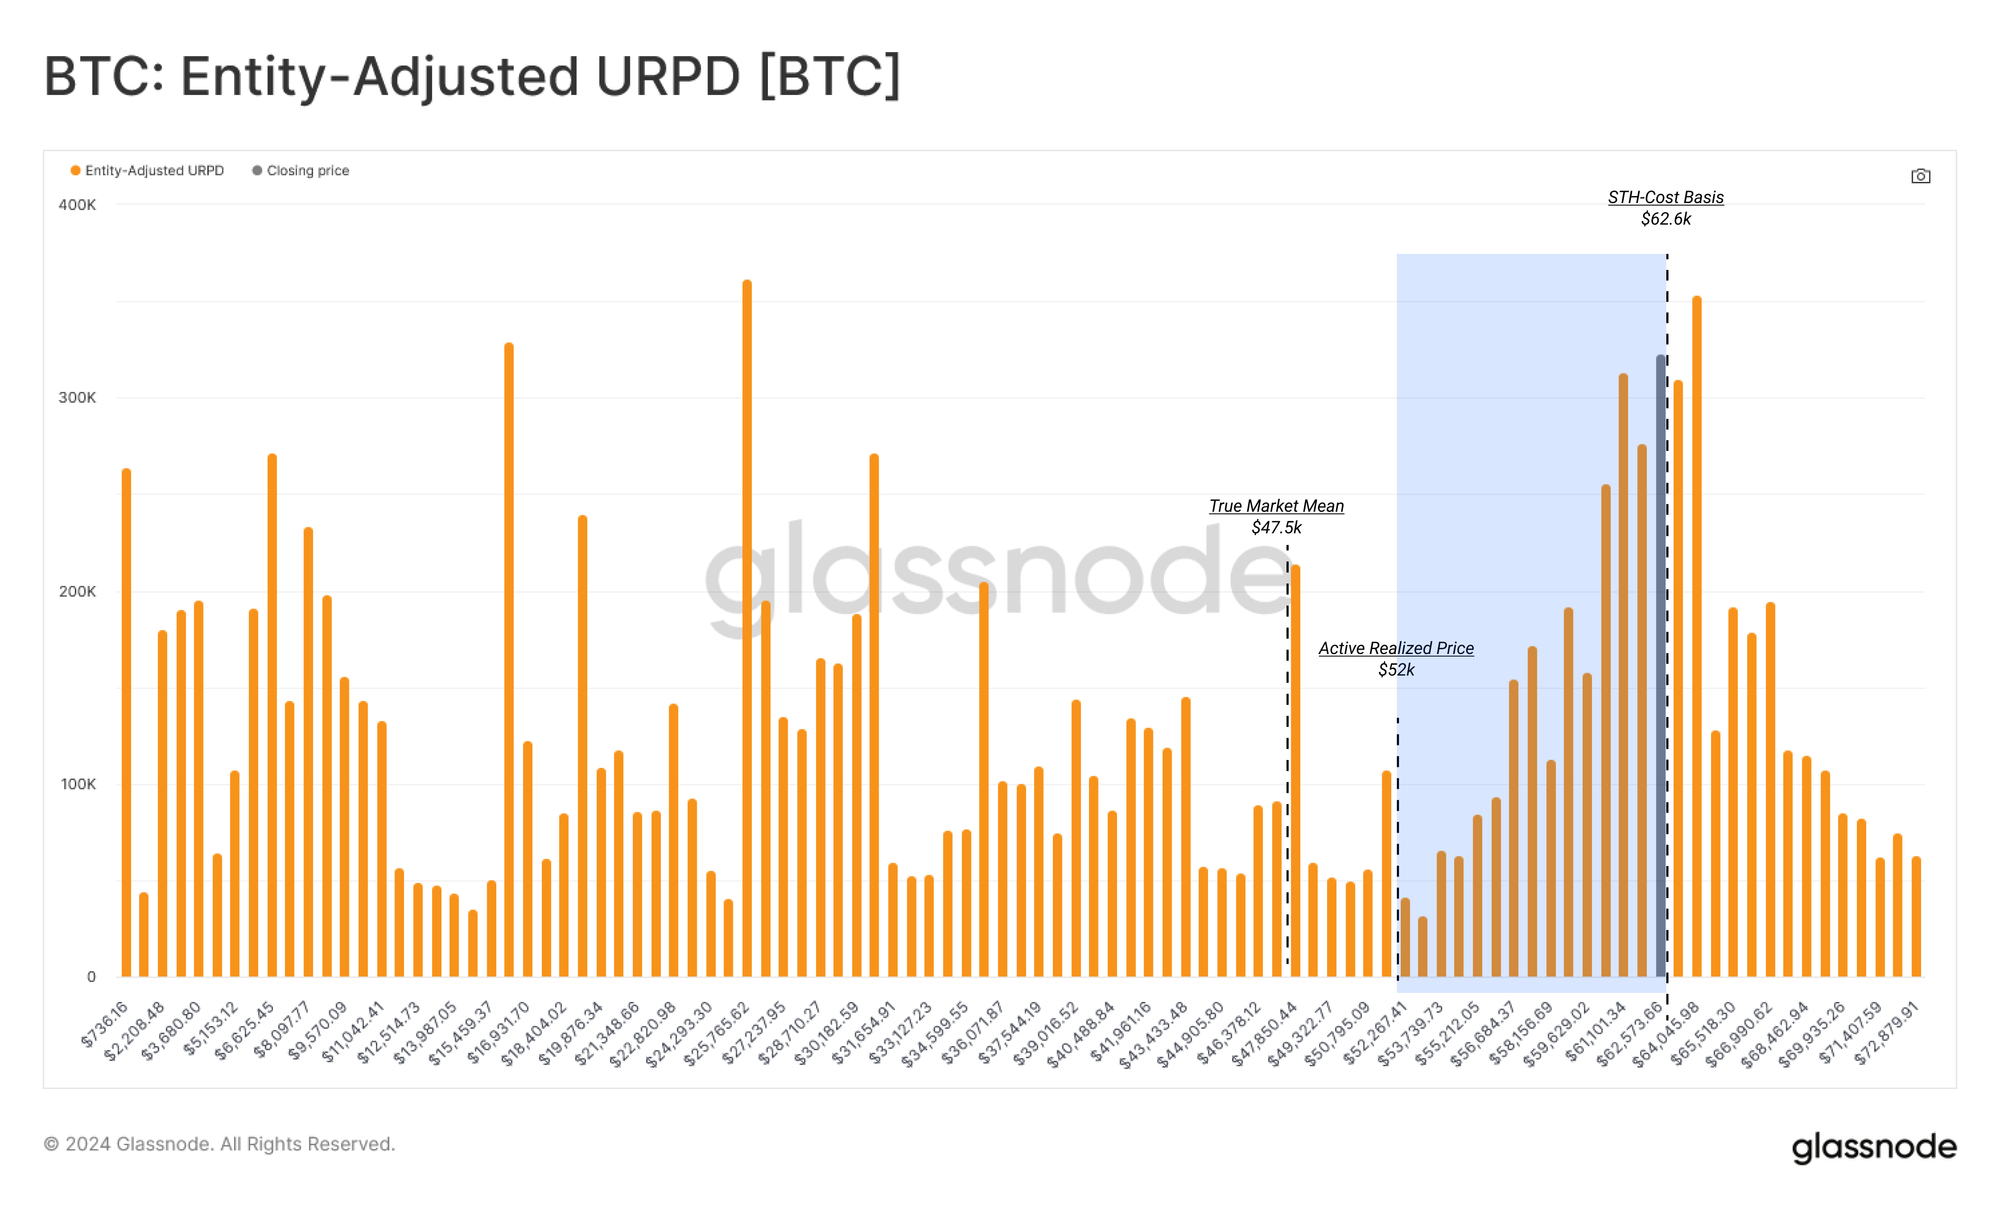
The URPD metric is an extremely useful tool, allowing us to profile the current cost basis of the circulating coin supply. The spot price is located within an extremely large cluster of coins. This suggests that small fluctuations in price can impact the profitability of a substantial number of investors.
The chart below has marked out the URPD with the critical pricing levels noted above, some key observations can be noted:
- The STH cost basis resides within the middle of this dense cluster, highlighting its pivotal role in gauging near-term investor sentiment.
- Two large supply nodes are located at the True Market Mean and Active Investor Price, underscoring their importance as support levels.
- In close proximity to these pricing levels are large ‘air gaps,’ where very few coins have transacted, potentially marking them as points of interest in the event of downside volatility.
This paints a picture of a market that rests on delicate ground, with a large volume of supply likely to be sensitive to the next major market move.
A Short-Term Reset
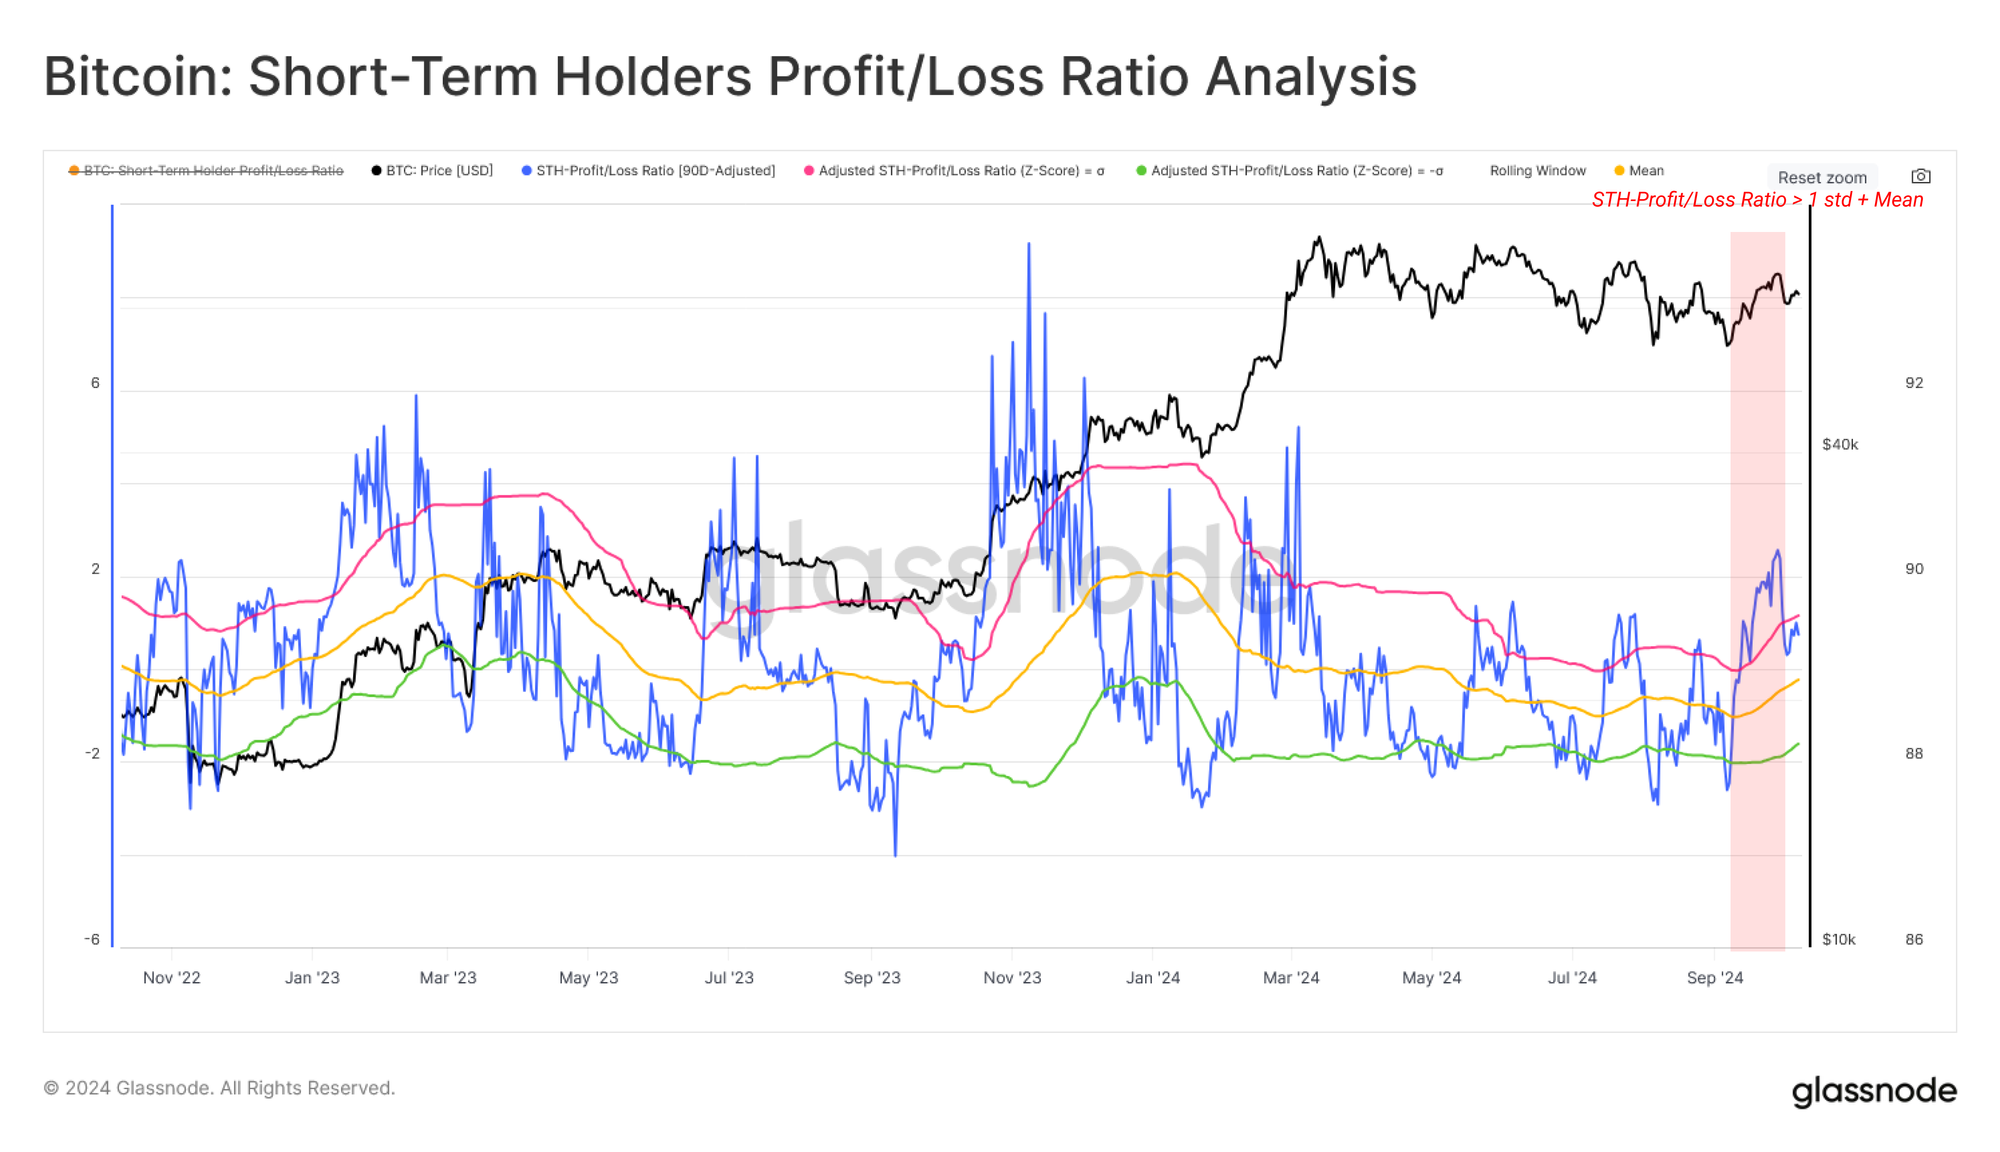
With Short-Term Holders playing an important role in defining local price action, the balance of their supply held in profit or loss can help distinguish positive or negative tipping points.
By this metric, there is a clear profit dominance amongst Short-Term holders, with this ratio trading at 1.2. This indicator has also recently broken more than one standard deviation above its 90-day mean, suggesting an initial positive boost to investor sentiment may be underway.
From the perspective of Short-Term Holder unrealized profit/loss, we can use a similar analysis framework applied to STH-MVRV. These tools assess the magnitude of unrealized paper gains/losses held by this cohort on average.
Here, we can also observe an improvement in the profitability of new investors, with their MVRV ratio rallying from the lows during the yen-carry trade unwind in early August. STH-MVRV has also reclaimed its 90d moving average, which is another positive sign.
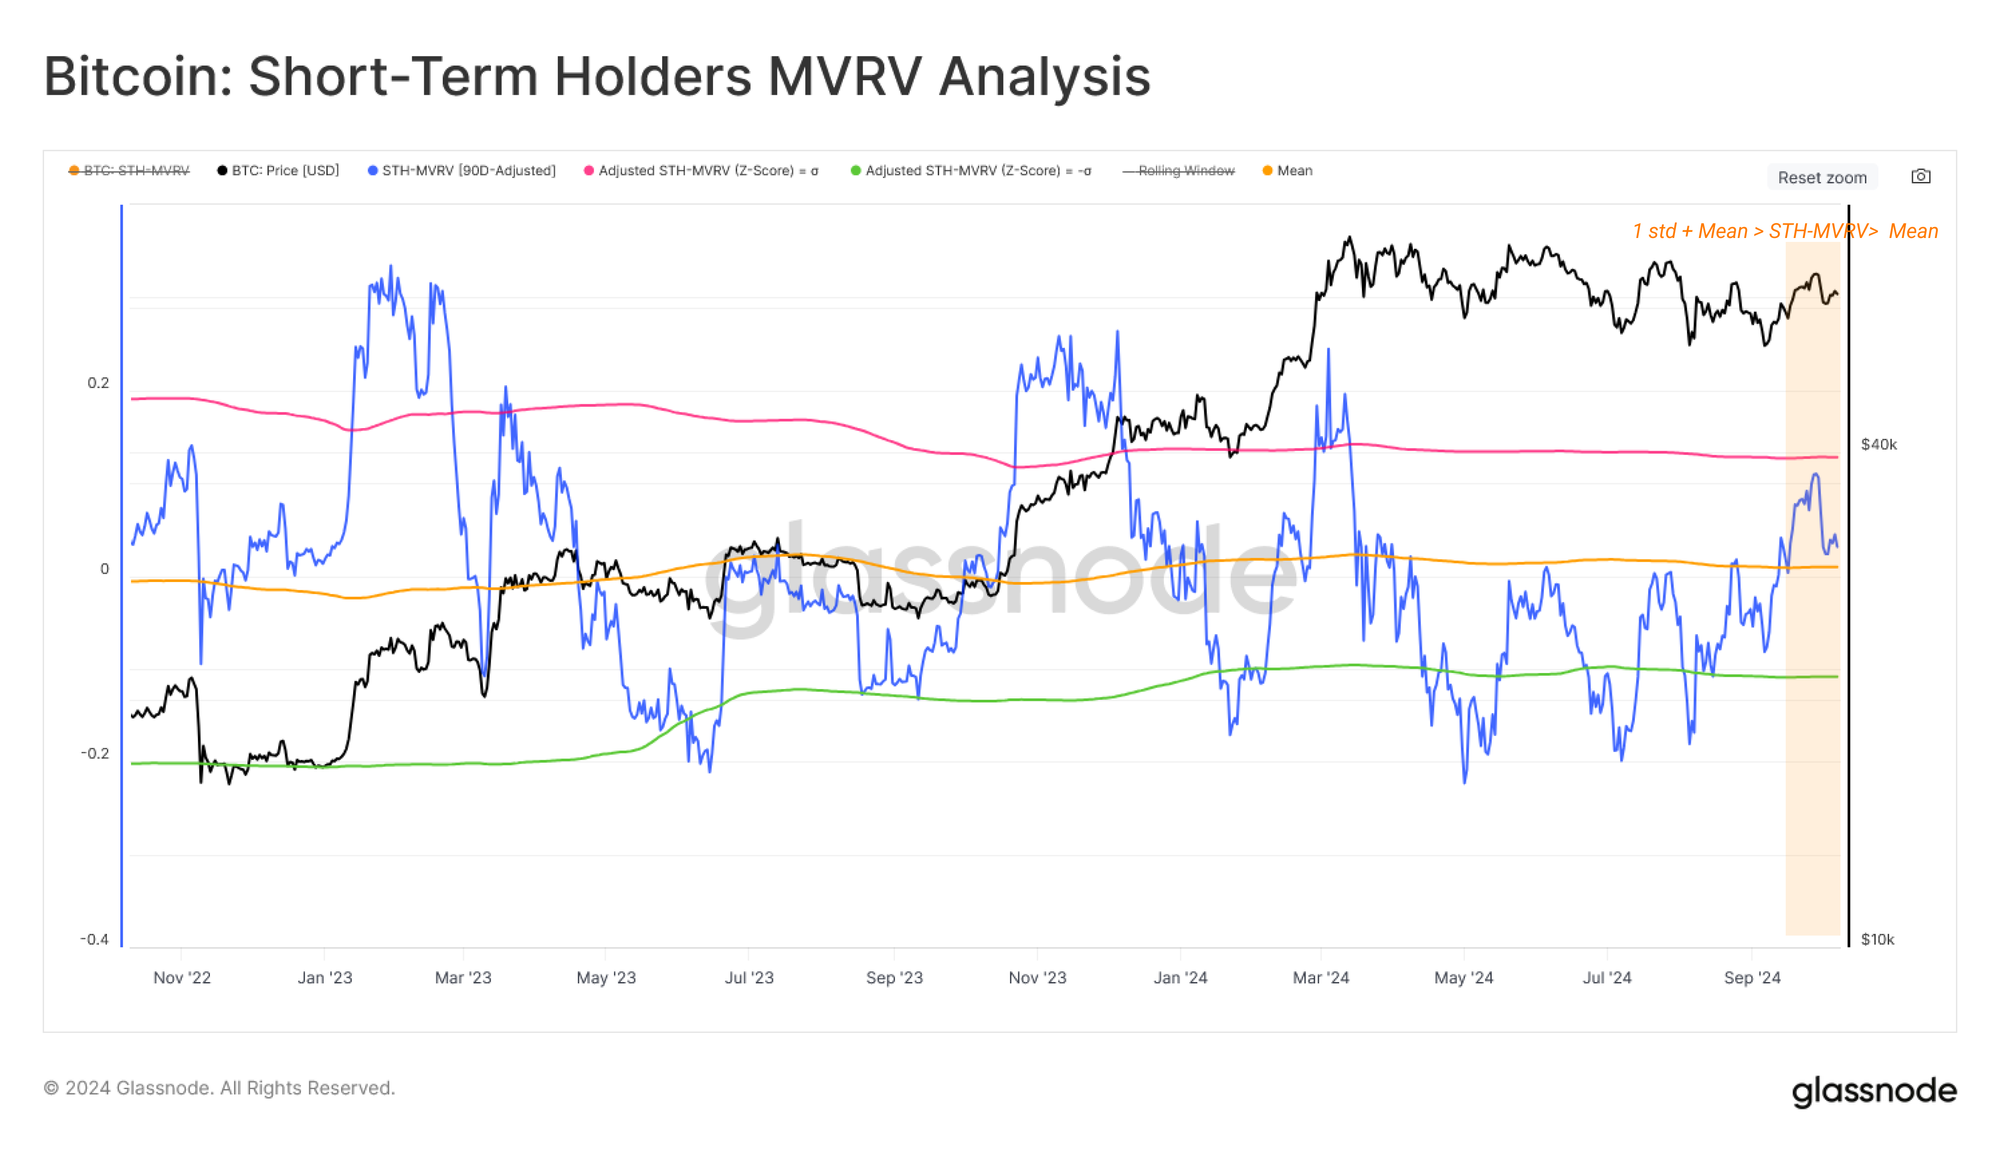
With both the Supply in Profit/Loss Ratio and STH-MVRV reaching their respective upper statistical bands, we can theorize that new investors have a decent incentive to lock in profit during the prevailing rally.
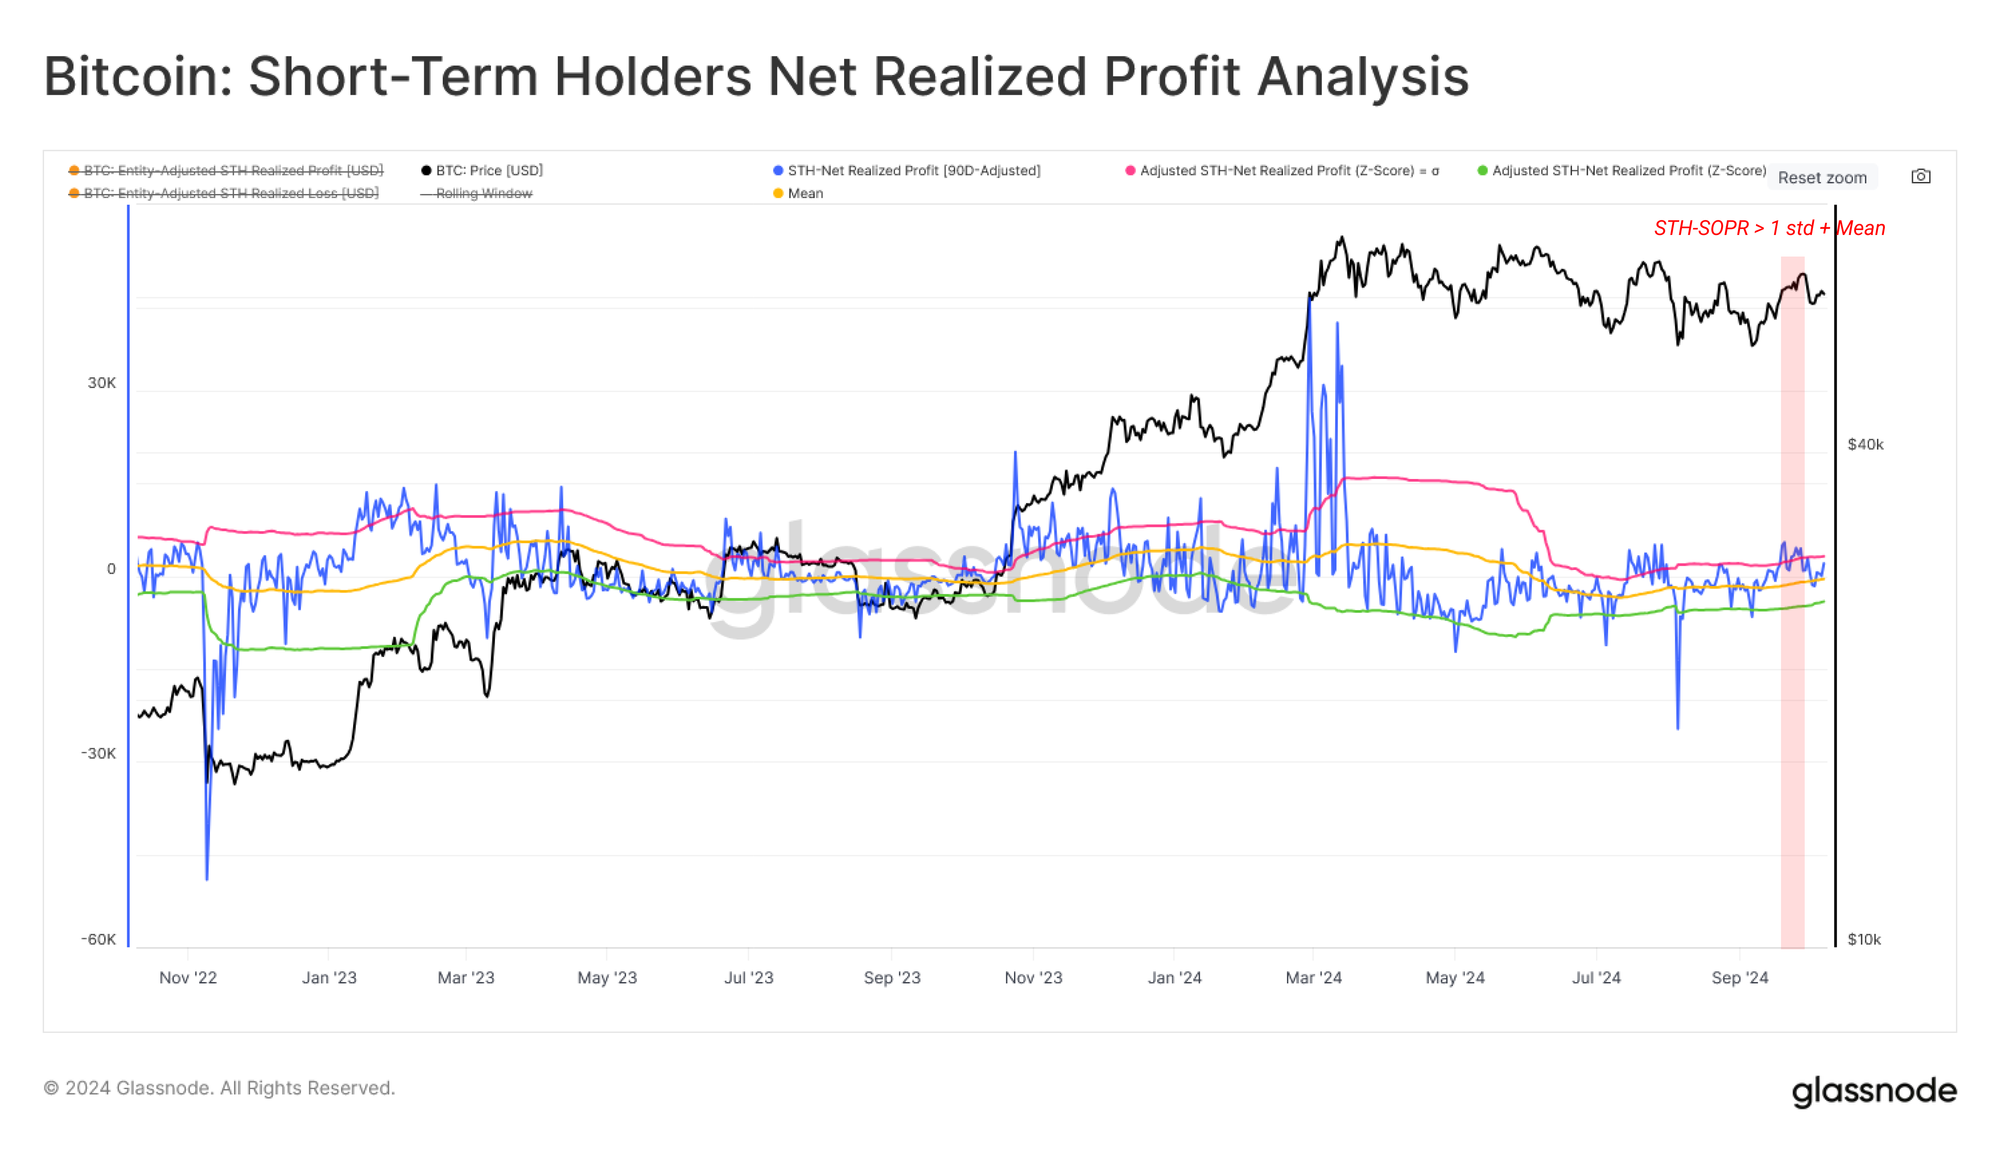
Using the same statistical bands applied to Net Realized Profit/Loss by STHs, it becomes evident that profit-taking has intensified during this rally. The magnitude of profit-taking remains relatively small when compared to the March ATH. However, it is still significant enough to reach the upper statistical band.
Increasing Speculation in Derivatives Markets
Derivative instruments for Bitcoin remain a crucial component of market structure and have grown significantly over recent years. Despite a surge in the usage of calendar expiring futures, primarily via CME Group instruments, the perpetual swap remains the contract of choice amongst crypto-native traders and speculators.
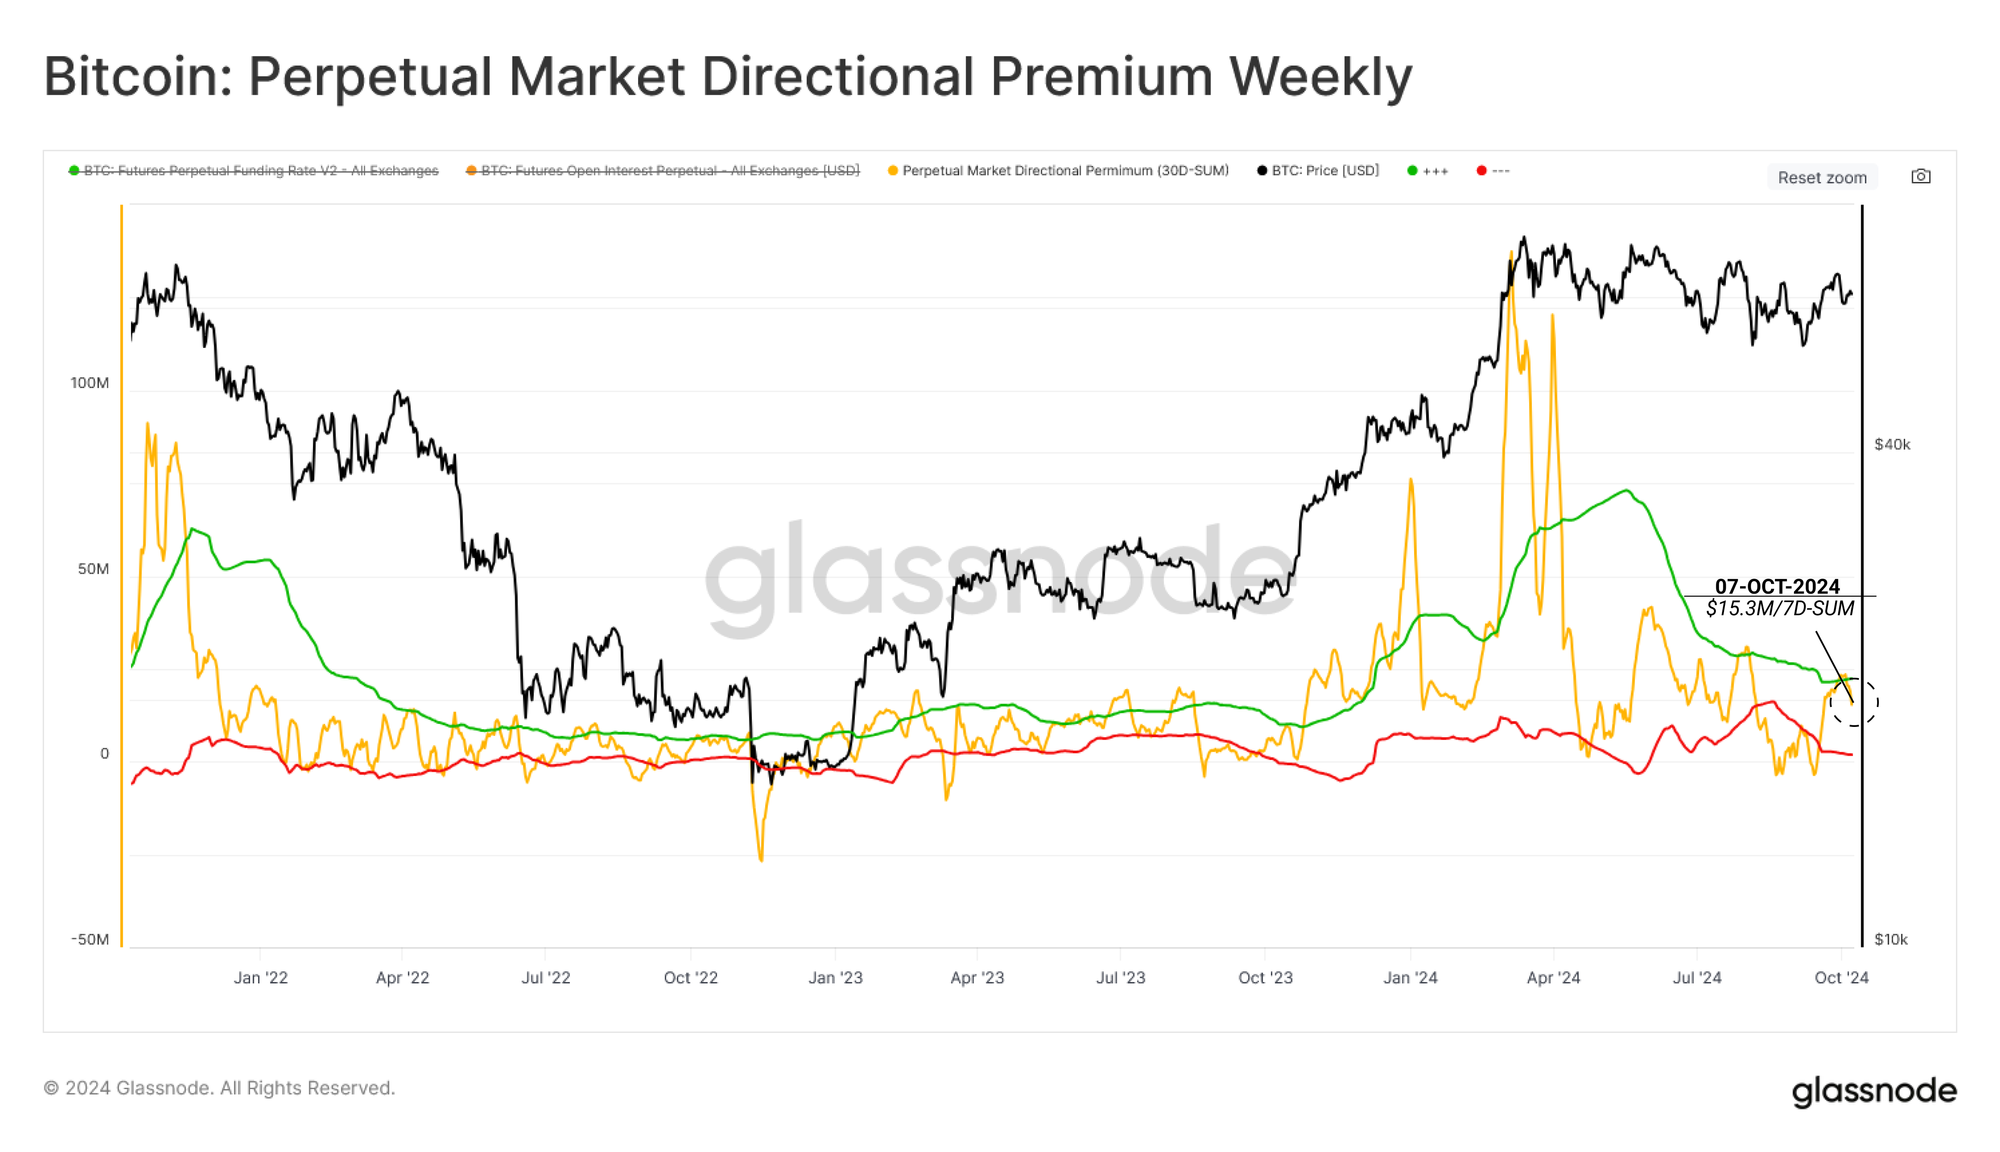
We can gauge speculation by futures investors by assessing the cumulative monthly premium that long-side contracts have paid to the short-side over the last 7 days.
We can see that the total cost of leverage around the March ATH peaked at around ~$120M per week. This has since declined to just $15.3M per week, reflecting a net reduction in long-biased speculation during the recent range-bound market conditions.
However, despite the meaningful reduction in trader long bias, the directional premium has recently exceeded its +1σ band, underscoring a potential return of speculative interest.
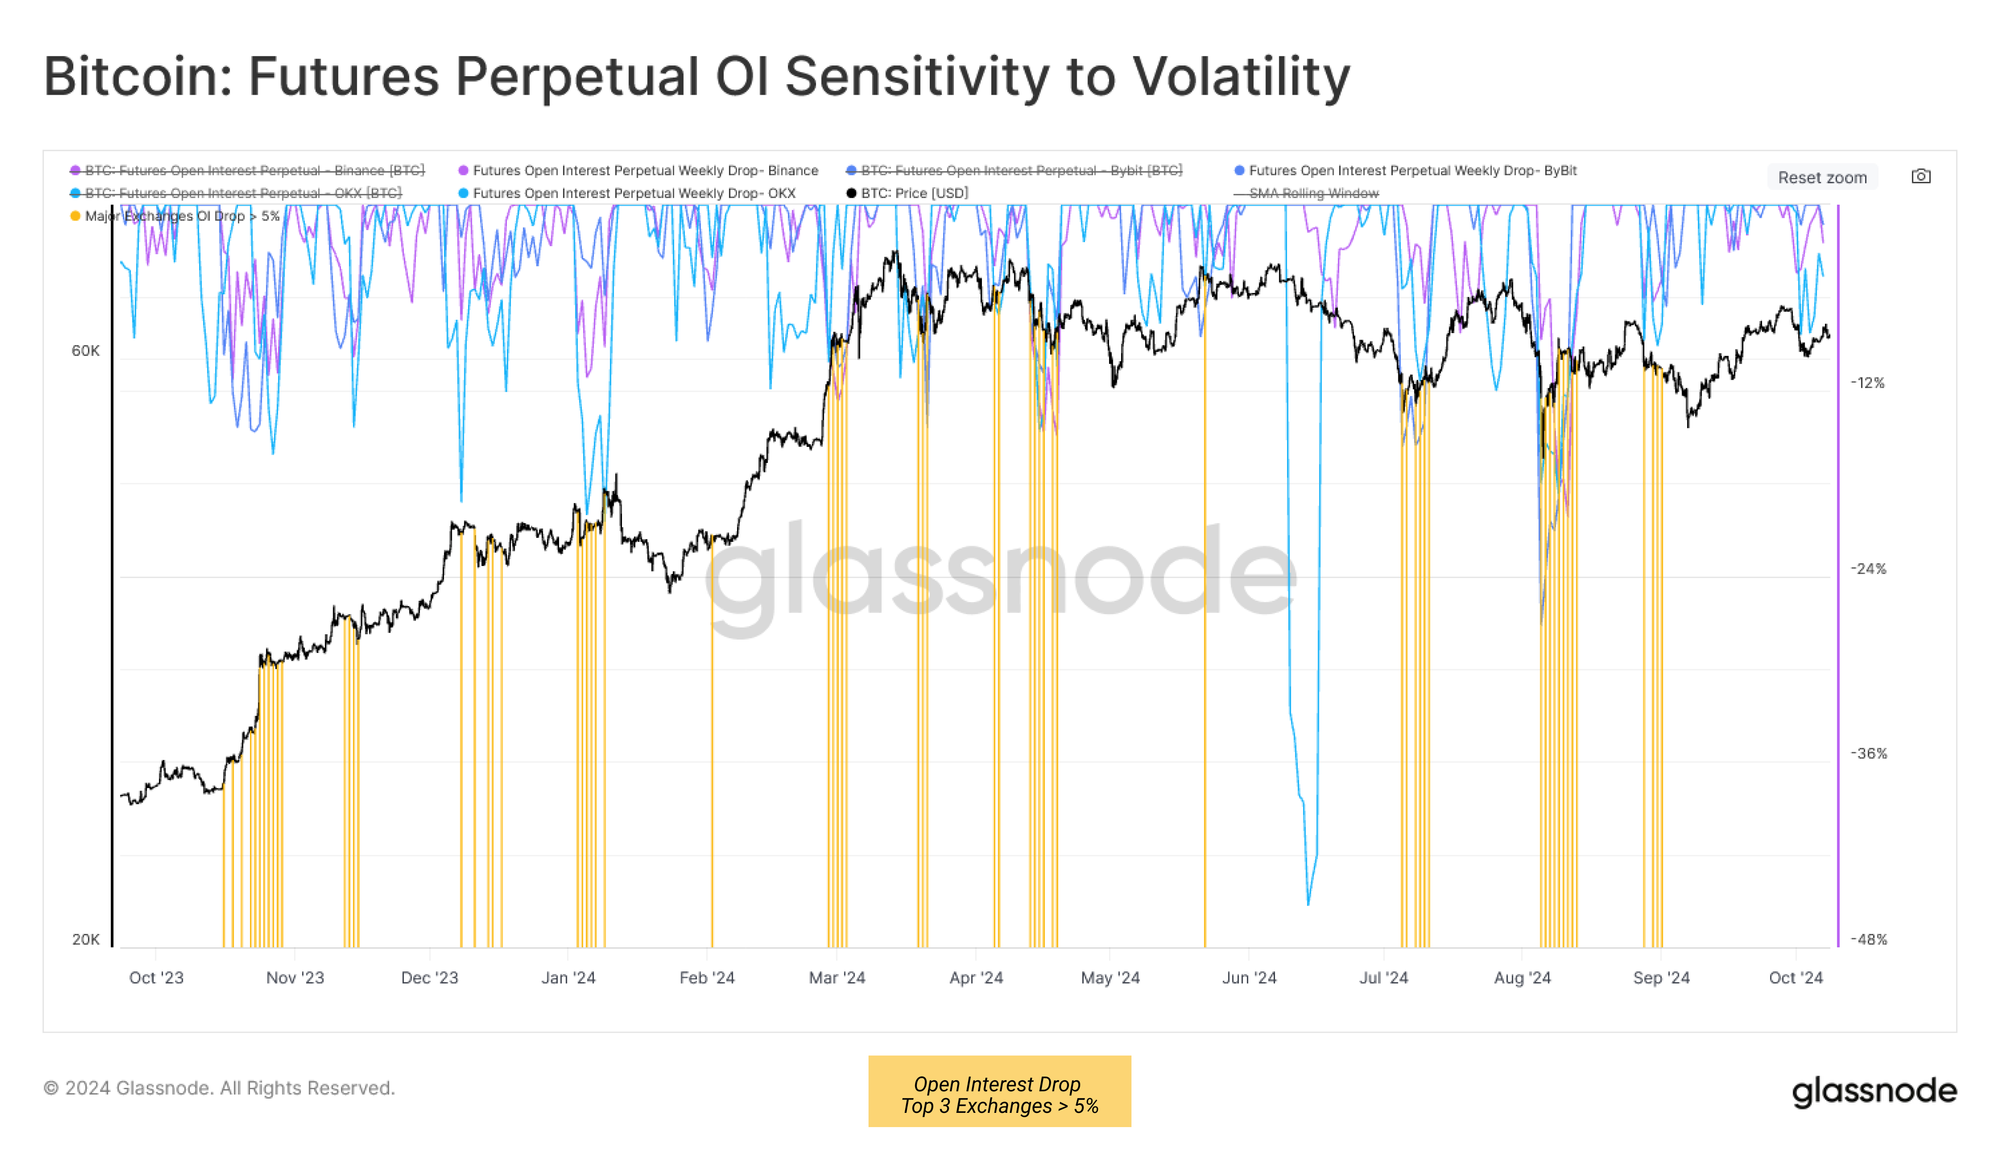
A substantial $2.5B of futures open interest was forcibly closed during the rally, suggesting a flushing out of short sellers. However, the percentage of OI reduction seen across the top three perpetual exchanges did not surpass the 5% threshold value 🟨.
From this, it could be argued that the market remains somewhat susceptible to heightened volatility in either direction, which could squeeze leveraged traders out of their positions.
Summary and Conclusions
Both Short-Term Holder's investment positioning and spending behaviour have seen a boost in profitability over the last month as the spot price rebounds above their cost-basis. Given the delicate position of the spot price relative to the cost basis of a large volume of the circulating supply, this may help tip the balance back in favor of the bulls.
However, speculation appears to be increasing in futures markets, with a significant amount of open interest still in open contracts. With the macro market direction still ambiguous, the market remains vulnerable to heightened volatility, which may fuel the next move in either direction due to deleveraging pressures and liquidations.
Disclaimer: This report does not provide any investment advice. All data is provided for information and educational purposes only. No investment decision shall be based on the information provided here and you are solely responsible for your own investment decisions.
Exchange balances presented are derived from Glassnode’s comprehensive database of address labels, which are amassed through both officially published exchange information and proprietary clustering algorithms. While we strive to ensure the utmost accuracy in representing exchange balances, it is important to note that these figures might not always encapsulate the entirety of an exchange’s reserves, particularly when exchanges refrain from disclosing their official addresses. We urge users to exercise caution and discretion when utilizing these metrics. Glassnode shall not be held responsible for any discrepancies or potential inaccuracies. Please read our Transparency Notice when using exchange data.
- Join our Telegram channel
- For on-chain metrics, dashboards, and alerts, visit Glassnode Studio
- For automated alerts on core on-chain metrics and activity on exchanges, visit our Glassnode Alerts Twitter