Bitstar2
08/21 16:57
Chainlink Price Nears a Key Resistance
Chainlink Price Nears a Key Resistance
The weekly chart of Chainlink price shows the token to have risen above an important resistance at $24.2. Moreover, the weekly open was above this range, which hinted towards the rising dominance of the bulls. Nevertheless, the price is experiencing equal pressures on both sides, suggesting a massive price compression that usually results in a bullish breakout. 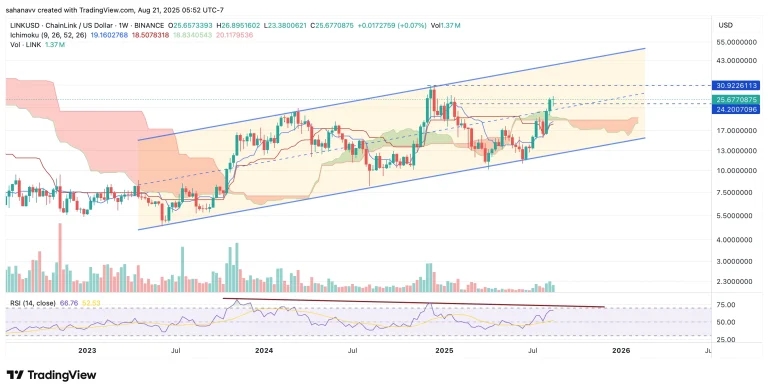
As seen in the above chart, the LINK price is trading within the rising parallel channel and has risen above the average range. The price is trading above the Ichimoku levels but the cloud is still bearish. On the other hand, the weekly RSI is displaying a bearish divergence before entering the overbought zone. This raises some concerns that if RSI continues to drop, the Chainlink price may slide below the average range. Therefore, it appears that the price is expected to retest the resistance-turned-support at $24.2 and squash the selling volume.
Therefore, the Chainlink (LINK) price continues to remain under bearish influence. Until the levels are sustained above the support, there are hopes of a strong rebound that may elevate the levels to $30 in the short term.
全部評論0最新熱門