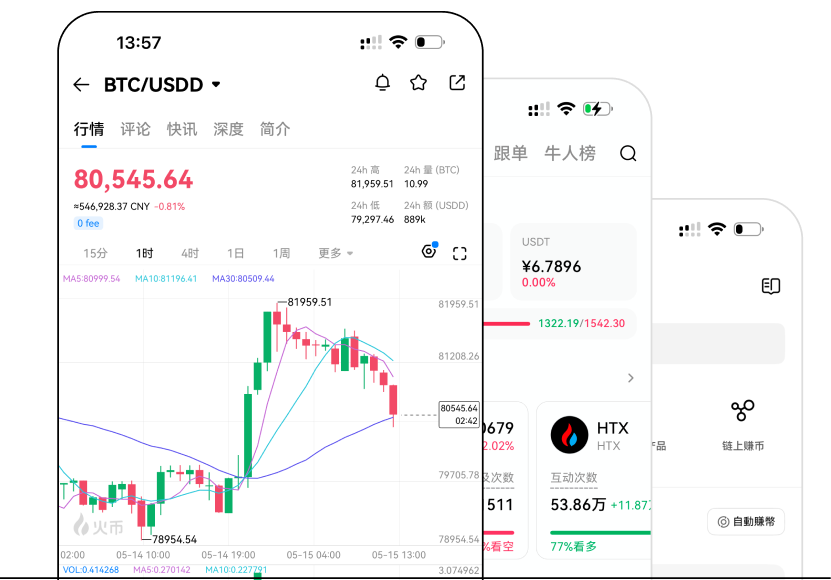
This page displays the daily OHLCV historical price data for Credo Technology Group Holding Ltd (Derivatives) CRDO/USDT, covering the period from -- to --, with a total of 0 complete records. The most recent complete period is --, and the data was generated at --. The highest price in this dataset is -- on --, and the lowest price is -- on --. Historical data does not represent future performance.
Data Snapshot
Historical prices do not represent future returns. The information on this page does not constitute investment advice.
30D Change--
60D Change--
90D Change--
1Y Change--
資料來源HTX Spot Market
Generation Time--
Latest Complete Period--
Time ZoneUTC+8
Quote CurrencyUSDT
Data Coverage--
Search Historical Prices by Period and Date
2026/08/22
$228.96
$234.68
$228.06
$233.87
$0.00
2026/08/21
$230.33
$230.69
$227.76
$228.96
$0.00
2026/08/20
$230.82
$236.49
$224.15
$230.33
$0.00
2026/08/19
$238.79
$241.61
$227.67
$230.82
$0.00
2026/08/18
$242.06
$253.51
$229.57
$238.79
$0.00
2026/08/17
$283.44
$284.76
$241.19
$242.06
$0.00
2026/08/16
$262.95
$286.11
$261.45
$283.44
$0.00
2026/08/15
$261.13
$263.19
$261.06
$262.95
$0.00
2026/08/14
$260.58
$265.74
$259.85
$261.13
$0.00
2026/08/13
$269.33
$273.09
$254.55
$260.58
$0.00
2026/08/12
$268.99
$286.06
$264.46
$269.33
$0.00
2026/08/11
$250.50
$276.80
$249.87
$268.99
$0.00
2026/08/10
$240.12
$250.50
$236.97
$250.50
$0.00
2026/08/09
$252.83
$263.67
$239.73
$240.12
$0.00
2026/08/08
$254.33
$257.19
$252.81
$252.83
$0.00
2026/08/07
$250.12
$256.72
$248.98
$254.33
$0.00
2026/08/06
$232.09
$250.14
$229.50
$250.12
$0.00
2026/08/05
$224.54
$238.64
$211.34
$232.09
$0.00
2026/08/04
$237.42
$245.51
$223.47
$224.54
$0.00
2026/08/03
$221.72
$245.43
$215.82
$237.42
$0.00
2026/08/02
$213.68
$221.76
$197.65
$221.72
$0.00
2026/08/01
$208.28
$216.77
$208.28
$213.68
$0.00
2026/07/31
$205.70
$209.49
$202.54
$208.28
$0.00
2026/07/30
$211.57
$216.83
$201.56
$205.70
$0.00
2026/07/29
$175.88
$211.57
$174.13
$211.57
$0.00
2026/07/28
$195.47
$200.92
$170.30
$175.88
$0.00
2026/07/27
$207.01
$207.64
$185.53
$195.47
$0.00
2026/07/26
$221.20
$225.64
$197.94
$207.01
$0.00
2026/07/25
$220.08
$221.38
$217.31
$221.20
$0.00
2026/07/24
$214.44
$220.81
$214.44
$220.08
$0.00
Credo Technology Group Holding Ltd (Derivatives) 歷史價格簡介
對於加密貨幣投資者來說,關注Credo Technology Group Holding Ltd (Derivatives)價格的隨時變化是非常重要的,這有助於他們了解自己的投資情況。此工具顯示了 Credo Technology Group Holding Ltd (Derivatives)所有相關內容,具體到每天何時開始交易,最高價和最低價的時間,以及何時收盤。它也能夠顯示Credo Technology Group Holding Ltd (Derivatives)的每日交易量。此外,它還能快速告訴投資者某天價格是否發生了顯著變化。所有價格資訊都直接來自htx.com,其數據可靠性是毋庸置疑的。投資者可以獲得Credo Technology Group Holding Ltd (Derivatives)不同時間段的歷史價格數據,例如 1 天、1 週或 1 個月,涵蓋了從開始交易的價格到最高價和最低價以及交易量的所有內容。數據經過嚴格核查,確保其準確性,非常適合用於測試交易策略。投資人可以免費下載這些數據,而且數據一直在更新,這對投資來說真的很有幫助。
Gain a Trading Edge with Credo Technology Group Holding Ltd (Derivatives) Historical Data
Historical data for Credo Technology Group Holding Ltd (Derivatives) provides a foundation for developing effective trading strategies. Here’s how traders can make the most of this data:
- Technical Analysis
Traders use historical Credo Technology Group Holding Ltd (Derivatives) data to identify market trends and patterns. They analyze these patterns using tools such as charts to help them make informed buying and selling decisions. An effective approach is to store historical Credo Technology Group Holding Ltd (Derivatives) data in GridDB and analyze it with Python using visualization tools such as Matplotlib and data analysis libraries such as Pandas, NumPy, and SciPy.
- 價格預測
Analyzing historical data is crucial for forecasting Credo Technology Group Holding Ltd (Derivatives) price movements. By studying historical trends, traders can gain insights into potential future market behavior. HTX provides detailed historical data for Credo Technology Group Holding Ltd (Derivatives), recorded at one-minute intervals and including open, high, low, and close prices. This data is essential for building predictive models and helping investors make informed trading decisions.
- Risk Management
Accessing historical data enables traders to assess the risks associated with investing in Credo Technology Group Holding Ltd (Derivatives). Understanding the volatility of Credo Technology Group Holding Ltd (Derivatives) helps them make more informed investment decisions.
- 投資組合管理
Historical data helps traders track investment performance over time. Traders can identify underperforming assets and adjust their portfolios accordingly to pursue higher returns.
- Training Trading Bots
Historical market data downloaded for Credo Technology Group Holding Ltd (Derivatives) can be used to train Trading Bots for Credo Technology Group Holding Ltd (Derivatives) and help improve their performance in the market. These tools and resources allow traders to analyze the historical data of Credo Technology Group Holding Ltd (Derivatives) in depth, gain valuable insights, and potentially optimize their trading strategies.
How to Analyze CRDO Candlestick Charts
First, understand historical candlestick patterns and market conditions, then learn the intended use cases of different automation tools. This page does not automatically recommend strategies or generate parameters from historical data. The following content does not constitute investment advice, and all Trading Bot products are non-principal-protected.
How to Read CRDO Candlesticks
Candlestick Chart Basics: A Quick Guide
K線圖橫軸為時間、縱軸為價格,與折線圖、柱狀圖一致。每根蠟燭有兩種顏色:綠色表示該週期收盤高於開盤(價格上漲),紅色表示收盤低於開盤(價格下跌)。
Basic Components of Candlesticks
By combining OHLC (open, high, low, close) prices and volume, you can observe volatility ranges, trend directions, and potential trend reversals, which form the foundation of technical analysis.
Use Historical Market Data to Assess Market Conditions
Bullish Trend
Prices continue to rise, with predominantly green candles. Grid bots may still miss one-way market moves depending on the parameters set.
Bearish Trend
Prices continue to fall, with predominantly red candles. Grid bots may keep buying as prices decline, potentially increasing unrealized losses.
Sideways
Prices fluctuate within a range, which is the primary market scenario for range grid trading bots. However, profits are not guaranteed.
Grid Bots Overview
Risk Reminder: Grid and Trading Bot products are non-principal-protected and may result in the total loss of principal. Past market performance and backtest results do not represent future returns. This page does not provide personalized advice for choosing Trading Bots. Please read the product terms before use and make decisions based on your own risk tolerance.
Range-Bound MarketExecutes buy and sell orders automatically within a preset price range. Range breakouts, trading fees, and parameter settings may affect final results.
Profit from Market VolatilityFutures Grid automatically executes batch trades to profit from price fluctuations. Because it uses leverage, it is highly susceptible to liquidation and significant losses during one-way trends.
Rebound After a PullbackAdd positions in batches during pullbacks according to preset rules. Consecutive declines can rapidly increase position exposure and capital risk.
FAQ
htx.com上Credo Technology Group Holding Ltd (Derivatives)的歷史價格資料是什麼樣的?
htx.com提供Credo Technology Group Holding Ltd (Derivatives)的全面歷史價格數據,包括開盤價、最高價、最低價、收盤價和交易量資訊。不同粒度級別的數據可供查看,包括分鐘、小時、日、月等多個粒度級別,這樣可以方便用戶詳細分析 Credo Technology Group Holding Ltd (Derivatives) 的歷史價格。
在htx.com上,Credo Technology Group Holding Ltd (Derivatives)的歷史價格數據多久更新一次?
htx.com即時更新Credo Technology Group Holding Ltd (Derivatives)的歷史價格資料。一旦有新的價格信息,這些信息將自動納入歷史數據,確保用戶可以訪問最新、最準確的 Credo Technology Group Holding Ltd (Derivatives) 價格歷史。
htx.com提供的Credo Technology Group Holding Ltd (Derivatives)的歷史價格資料與其他資料提供者的資料相比如何?
htx.com致力於為Credo Technology Group Holding Ltd (Derivatives)提供最可靠、最準確和最全面的歷史價格數據。我們的數據來自多個值得信賴的交易所,經過嚴格驗證,以確保其品質。與市場上的其他數據提供者相比,我們提供的數據具有更高的粒度級別,更快的更新頻率,更易於存取。
我可以在htx.com上查看Credo Technology Group Holding Ltd (Derivatives)的特定日期範圍的歷史價格數據嗎?
可以, htx.com允許用戶查看Credo Technology Group Holding Ltd (Derivatives)在特定日期範圍內的歷史價格。在 /價格/Credo Technology Group Holding Ltd (Derivatives)/歷史資料頁面上,您可以使用日期篩選功能來選擇所需的開始日期和結束日期,或者您可以手動輸入日期範圍。如此,您便可以查看對應的歷史價格資料。
htx.com上Credo Technology Group Holding Ltd (Derivatives)歷史價格資料的來源是什麼?
htx.com匯總了多個信譽良好的加密貨幣交易所Credo Technology Group Holding Ltd (Derivatives)的歷史價格數據。我們仔細篩選資料來源,以確保資料的完整性和可靠性。我們的數據經過嚴格的驗證和標準化處理,以保持所有來源的一致性和準確性。
我可以以不同的格式(例如,CSV和JSON)從 htx.com下載Credo Technology Group Holding Ltd (Derivatives)的歷史價格資料嗎?
是的,htx.com能夠提供以各種格式下載Credo Technology Group Holding Ltd (Derivatives)的歷史價格資料的選項,包括CSV和CHECKSUM格式。在/價格/Credo Technology Group Holding Ltd (Derivatives)/歷史數據頁面上,您可以找到一個「下載「按鈕,讓您可以選擇所需的格式並下載數據,以便進行進一步分析或與其他工具整合。
我該如何使用htx.com上Credo Technology Group Holding Ltd (Derivatives)的歷史價格資料進行技術分析或回測?
來自htx.com的Credo Technology Group Holding Ltd (Derivatives)歷史價格資料是進行技術分析和回測的寶貴資源。您可以使用這些數據來計算各種技術指標,確定趨勢和模式,並測試交易策略。我們提供資料格式能夠相容於常用的分析工具和函式庫,易於整合到您的工作流程中。
歷史數據的更新頻率是多少?
htx.com即時更新Credo Technology Group Holding Ltd (Derivatives)的歷史價格資料。一旦有新的價格信息,這些信息將自動納入歷史數據,確保您在進行分析或做出交易決策時始終能夠訪問最新和最準確的歷史價格數據。
查看CRDO相關頁面
歷史價格頁只負責歷史數據。即時行情、未來情景、購買、項目認知和兌換分別進入獨立SEO頁面。
即時價格CRDO 價格
當前價格、市場數據、24小時表現和即時行情
查看當前價格 價格預測CRDO 價格預測
查看預測週期、方法假設、情景結果和風險說明
查看價格預測 項目資料CRDO是什麼
了解Credo Technology Group Holding Ltd (Derivatives)網絡、CRDO用途、供應機制與項目風險。
查看代幣頁面 幣幣兌換CRDO兌換USDT
獲取幣市報價或真實Convert報價,勿與匯率混用
進入兌換頁面 購買指南如何購買 CRDO
查看購買步驟、支援方式、帳戶要求和地區能力
前往查看 使用歷史價格數據前需要了解
歷史數據適合研究與比較,但不能替代即時行情、交易確認或未來價格判斷。
歷史表現不代表未來收益
過去的漲跌。最高價和波動率不能保證未來價格或回報。
不是即時成交報價
歷史價格頁只展示已完成週期的記錄;即時價格和深度應查看價格頁或交易市場。
交易所數據可能不同
不同平台的流動性、交易對和聚合口徑可能造成OHLCV差異
可能存在延遲與缺失
數據源超時、停牌或無成交可能造成延遲或N/A,頁面不會以0冒充。
計價幣種影響結果
BTC/USDT與BTC/USD並非同一數據集,比較前應確認計價幣種和時區。
不構成投資建議
本頁僅供資訊與數據研究使用,不構成買賣、持有或收益承諾。
查看 CRDO 當前價格或下載歷史數據
歷史價格頁提供可查詢、可驗證、可下載的數據;即時行情與交易分別進入對應頁面。