Jami
07/04 11:10
Wormhole structure break or liquidity hunt?
Wormhole structure break or liquidity hunt?
On 28 June, the price of W briefly climbed past the $0.08-level. This resistance (orange) had been the previous local high, made in June. After this candlewick broke beyond the resistance, W fell lower to fill the fair value gap (white box) at the $0.07-region.
The volume indicators suggested that the market structure break was real, and not a liquidity hunt. The CMF was at +0.09, and the reading above +0.05 reflected sizeable capital inflows to the Wormhole market. The OBV has also trended higher over the past ten days. To back up the bullish notion, the MFI climbed above 50 and rose to 64 – A sign of greater buying pressure and upward momentum.
Hence, traders can use the retracement of the past four days to buy more Wormhole tokens. A move below the $0.068-level would mean the breakout has failed. Swing traders can use the $0.065-$0.068 area to set their stop-losses, targeting the $0.08 and $0.091 resistances to take profits at.
Disclaimer: The information presented does not constitute financial, investment, trading, or other types of advice and is solely the writer’s opinion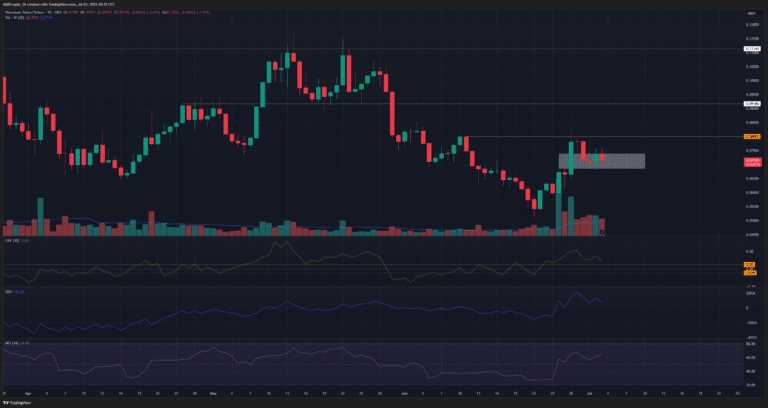
全部評論0最新熱門