The live price of Sonic (S) is $0.02 USD and its current market capitalization is $-- USD.
Get real-time S/USD updates on HTX. Stay informed with the latest data and market trends to make smart trading decisions. HTX, your trusted source for accurate cryptocurrency price information.
Sonic Key Stats
24h Volume (USD)
$--
Price Change Today
-0.82%
Circulating Supply (S)
3.17B
Sign up and trade to win rewards worth up to 1,500 USDT.Join Now
S Price Performance
Track Sonic price movements with chart views spanning 1 day, 30 days, 60 days, 90 days, 1 year, and the period since it was listed on HTX.View more data for the Sonic prices
Time
Change
Change%
Highest Price
Lowest Price
No data
S Market Information
Get the latest Sonic price details on HTX: 24-hour high and low, all-time high (ATH), and daily price change percentage.
24h Low
$0
24h High
$0
All-Time High
$0
Market Cap
$0.00
24h Volume (USD)
$--
Circulating Supply
--
What is S?
Sonic is an L1 blockchain network delivering 10,000 TPS with sub-second finality. The network connects to Ethereum's liquidity through the Sonic Gateway and features unique developer incentives including Fee Monetization that allows developers to earn up to 90% of fees their apps generate. Built by the team behind Fantom Opera, Sonic plans to support dynamic fees, fee subsidization, and native account abstraction while maintaining full EVM compatibility.
Based on the historical performance of Sonic, our prediction tool estimates that the price of Sonic (S) could reach -- by --.
Predicted S Price in --
Our most recent forecast indicates the price of Sonic (S) will increase to -- by --, with a price change of --% and a cumulative ROI of approximately --%.
Buy your first S on HTXSign Up
S FAQs
QWhat is the Sonic (S) price today?
AThe current price of Sonic (S) is $0.02 USD.
QWhat is the Sonic (S) market cap?
AThe current market capitalization of Sonic (S) is $0.00 USD, calculated by multiplying its circulating supply by its current price.
QWhat is the Sonic (S) circulating supply?
AThe current circulating supply of Sonic (S) is -- S.
QWhat is the Sonic (S) all-time high?
AAs of 2026-07-24, the all-time high of Sonic (S) is $0 USD.
QWhat is the Sonic (S) 24h trading volume?
AThe 24-hour trading volume of Sonic (S) is -- USD on HTX.
QCan I buy Sonic (S) on HTX?
AYes, HTX offers industry-leading trading fees and deep liquidity, ensuring a smooth and secure Sonic (S) purchase experience.
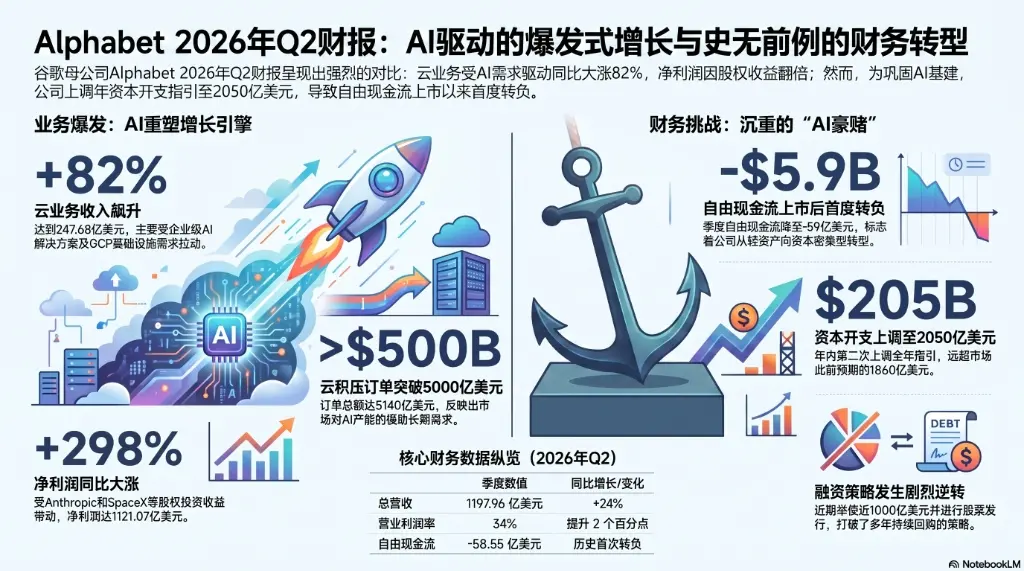
Alphabet (Google's parent) reported its Q2 2026 results. Revenue grew 24% to $119.8B, with Google Cloud revenue surging 82% to $24.8B, significantly exceeding expectations. Cloud backlog also surpassed $500B for the first time. However, the company's capital expenditures soared to $44.9B, leading to negative free cash flow (-$5.86B) for the first time in its history as a public company. Alphabet raised its full-year capex guidance to a range of $195B-$205B, its second upward revision this year. This massive spending on AI infrastructure fueled investor concerns about returns, causing the stock to fall. Despite the cash flow pressure, the results highlight a dual narrative: strong commercial returns from AI in the cloud, but significant financial strain from the ongoing investment race. CEO Sundar Pichai emphasized focus on the next-generation Gemini 4 model and stated that AI is reshaping the entire company.
"Ten Questions Answered: The Complete Guide to Robinhood Chain"
Robinhood Chain, Robinhood's Ethereum Layer 2 network built on Arbitrum Nitro technology, launched its public mainnet on July 1, 2026. Designed for tokenized real-world assets (RWA) like stocks and ETFs, as well as DeFi applications, the network saw rapid initial growth, with over $3.1 billion in DEX volume in its first week. However, memecoin trading dominated this early activity, while the intended RWA use case, with approximately $13 million in tokenized stocks held, remains nascent.
The network is EVM-compatible, uses ETH for gas, and features a permissionless design for users and developers, though its sequencer and validator set are currently permissioned. Its core functionalities include tokenized stocks/ETFs (which provide economic exposure but not legal ownership rights), decentralized trading via Uniswap's dedicated AMM, on-chain lending through Robinhood Earn, perpetual contracts, and support for AI agent-driven applications.
Access to the underlying chain is open, but regulated products like stock tokens have jurisdictional restrictions and are not available in the U.S., Canada, and several other countries. Users can connect via Robinhood Wallet or compatible wallets like MetaMask.
Key risks include over-reliance on speculative memecoin trading, limited adoption and liquidity for stock tokens, regulatory hurdles, centralization in core infrastructure, and standard cross-chain and smart contract risks. The network's long-term success in bridging traditional finance with DeFi hinges on developing its RWA ecosystem beyond initial speculation.
(Note: All data referenced is as of mid-July 2026.)
Dogecoin (DOGE) fell to $0.068, hitting lows last seen in November 2023, after breaching the $0.07 support level amid a broader crypto market pullback. The decline triggered significant liquidations, with $8.2 million in long positions wiped out, indicating disproportionate pressure on bullish traders. Market data showed selling activity overwhelmingly outpaced buying in the perpetual and futures markets, with capital outflows intensifying downward momentum. The RSI dropped to 31.34, nearing oversold territory. However, negative spot netflows suggested some coins were being withdrawn from exchanges, potentially reducing immediate sell pressure. The coin's near-term direction hinges on whether it can reclaim $0.07 or if continued weakness pushes it toward $0.065.
The o1.exchange (O) token rallied significantly following its listing on South Korea's largest exchange, Upbit, which introduced trading pairs against KRW, Bitcoin, and USDT. The price surged from around $0.5733 to an intraday high near $0.853, supported by a 29.92% increase in 24-hour trading volume. However, the rally faced profit-taking, causing the price to retreat and stabilize near $0.6460, just above a key support level at $0.639. For bullish momentum to continue, the token needs to decisively break through the resistance cluster between $0.681 and $0.694. Meanwhile, derivatives data shows caution, with open interest rising but funding rates turning negative, indicating growing bearish bets among leveraged traders. The token's sustained movement will depend on whether spot demand can absorb this selling pressure or if the initial listing momentum fades.
The Ethereum validator exit queue has fallen to zero, eliminating any waiting time for withdrawals. This contrasts sharply with late last year's market crash, which saw a peak of 2.6M ETH waiting to exit with a 44-day delay. Meanwhile, the entry queue for new stakers remains significant, with approximately 2.5M ETH waiting to enter and a 44-day processing time. This imbalance indicates strong, long-term staking demand and supports tighter ETH supply dynamics, with the staking ratio hitting a record 33.97% of total supply.
Additional demand is driven by the U.S. spot ETH ETF inflows and institutional activity. Option market data shows dominant bullish bets targeting $2K and $2.4K price levels. While ETH's price has risen towards $2K, its near-term movement is tied to the potential passage of the CLARITY Act, with regulatory developments remaining a key catalyst for Q3.
ambcrypto1分钟前
Threads
Welcome to the HTX Community. Here, you can stay informed about the latest platform developments and gain access to professional market insights. Users' opinions on the price of Sonic (S) are presented below.
Related Questions
Welcome to the Crypto FAQ. Users' questions and answers on Sonic (S) are presented below.