Editor's Note: On February 5th, the crypto market experienced another sharp decline, with over $2.6 billion in liquidations within 24 hours. Bitcoin briefly flash-crashed to $60,000. However, the market seems to lack a clear consensus on the cause of this drop. Jeff Park, an advisor at Bitwise, offers a new analytical framework from the perspective of options and hedging mechanisms.

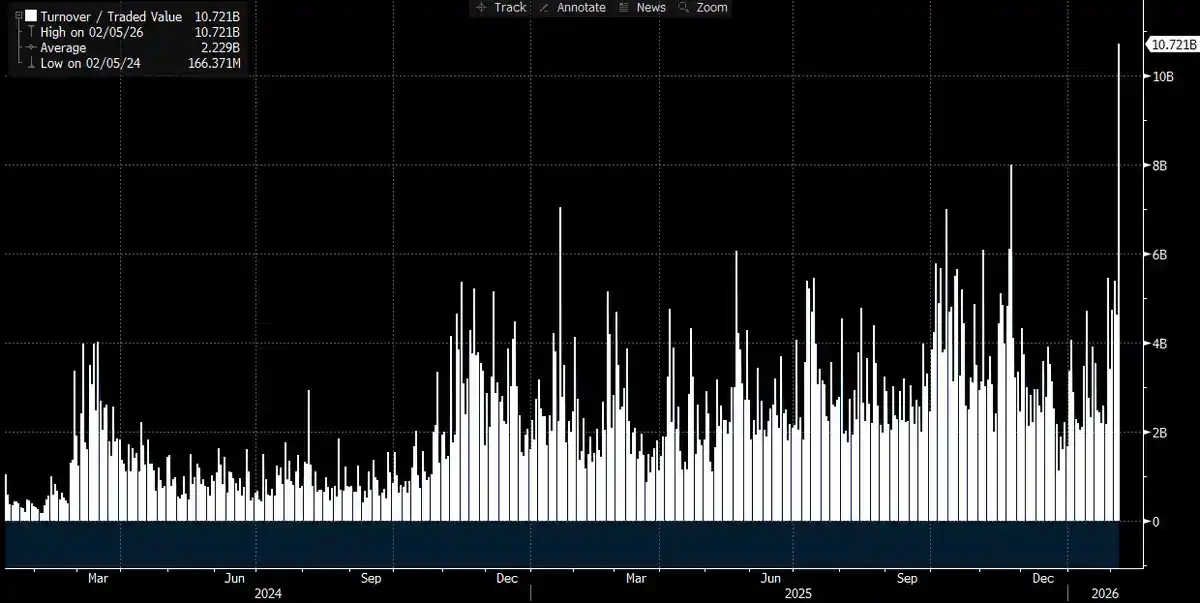
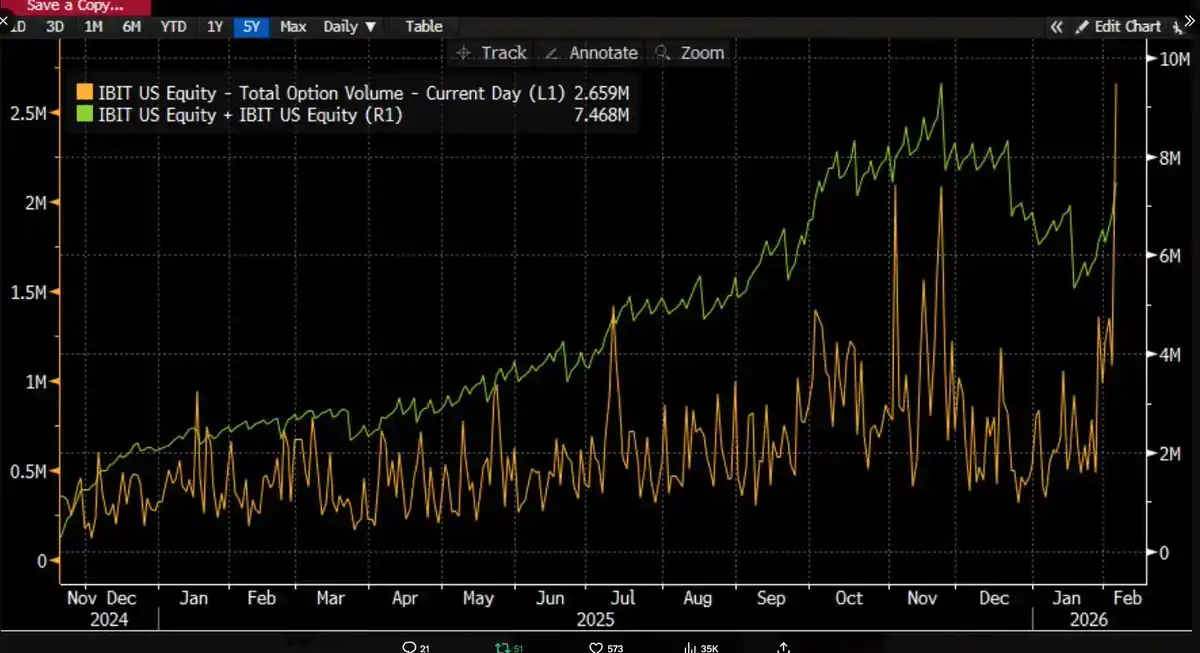
As time passes and more data becomes available, the picture is becoming clearer: this severe sell-off was likely related to Bitcoin ETFs, and the day itself was one of the most volatile trading days in recent capital market history. We can draw this conclusion because IBIT's trading volume hit a record high that day—exceeding $10 billion, double the previous record (a truly staggering number). Option volume also reached a record high (see chart below, showing the highest number of contracts since the ETF's launch). Somewhat反常的是, the volume structure showed that this time, option trading was clearly dominated by puts, not calls (more on this later).
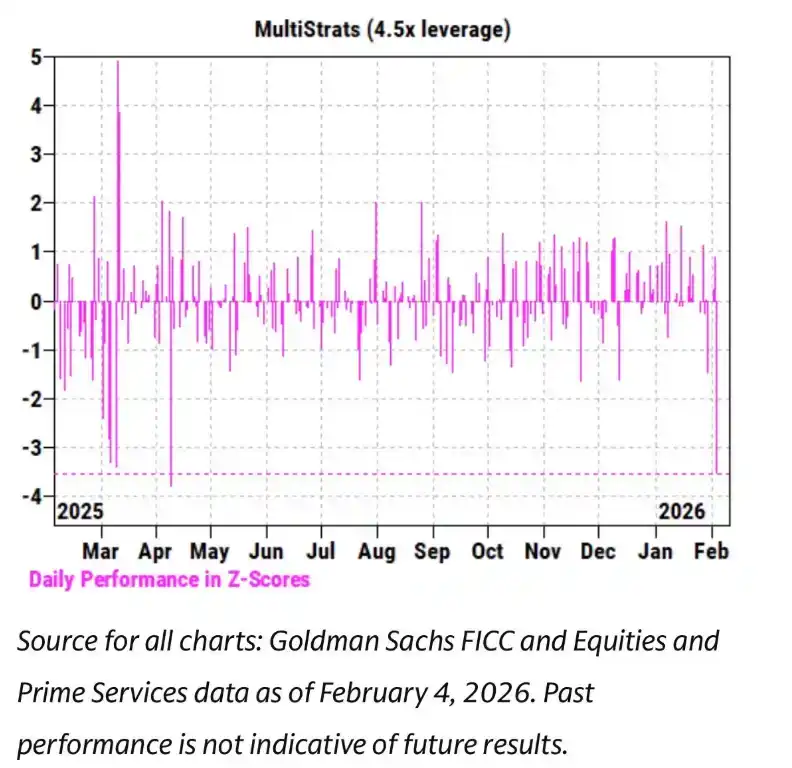
Meanwhile, over the past few weeks, we have observed an extremely tight correlation between IBIT's price movements and software stocks, as well as other risk assets. Goldman Sachs' Prime Brokerage (PB) team also reported that February 4th was one of the worst single days on record for multi-strategy funds, with a Z-score as high as 3.5. This means it was an extreme event with a probability of only 0.05%, making it 10 times rarer than a 3-sigma event (the classic "black swan" threshold, probability ~0.27%). It was, by all accounts, a catastrophic shock. It is precisely after such events that risk managers at multi-strategy funds (pod shops) quickly step in, demanding all trading teams immediately, indiscriminately, and urgently deleverage. This explains why February 5th also turned into a bloodbath.
With so many records broken and a clear downward price direction (a 13.2% single-day drop), we initially expected a high likelihood of seeing net outflows from the ETFs. This judgment is not far-fetched based on historical data: for example, on January 30th, after a 5.8% drop the previous day, IBIT saw a record $530 million in outflows; or on February 4th, IBIT saw about $370 million in outflows amid consecutive declines. Therefore, expecting at least $500 million to $1 billion in outflows on a day like February 5th was entirely reasonable.
But the opposite happened—we saw widespread net inflows. IBIT added approximately 6 million shares that day, corresponding to an increase in Assets Under Management (AUM) of over $230 million. Meanwhile, other Bitcoin ETFs also recorded inflows, with the entire ETF system attracting over $300 million in net inflows.
This result is somewhat puzzling. Theoretically, one could勉强设想 that the strong price rebound on February 6th somewhat reduced redemption pressure, but turning "potentially reduced outflows" into "net inflows" is a completely different matter. This suggests that multiple factors were likely at play simultaneously, but these factors do not form a single, linear narrative framework. Based on the information we currently have, several reasonable preliminary assumptions can be made, and on these assumptions, I will present my overall inference.
First, this round of Bitcoin selling likely affected a type of multi-asset portfolio or strategy that is not purely crypto-native. This could be the multi-strategy hedge funds mentioned earlier, or it could be funds like those in BlackRock's model portfolio business, which allocate between IBIT and IGV (a software ETF) and were forced into automatic rebalancing during the sharp volatility.
Second, the acceleration of the Bitcoin sell-off was likely related to the options market, particularly structures related to the downside.
Third, this sell-off did not ultimately translate into capital outflows at the Bitcoin asset level, meaning the main driving force behind the market move came from the "paper money system," namely the position adjustment behavior dominated by dealers and market makers, which was largely in a hedged state.
Based on the above facts, my core hypothesis is as follows.
1. The direct catalyst for this sell-off was a broad deleveraging triggered by multi-asset funds and portfolios after the downside correlation of risk assets reached a statistically anomalous level.
2. This process then triggered an extremely violent deleveraging, which also included Bitcoin exposure, but a significant portion of this risk was actually in "Delta neutral" hedged positions, such as basis trades, relative value trades (e.g., Bitcoin vs. crypto stocks), and other structures where the residual Delta risk is typically "boxed" by the dealer system.
3. This deleveraging then triggered a short Gamma effect, further amplifying the downward pressure, thus forcing dealers to sell IBIT. However, because the selling was so fierce, market makers had to net short Bitcoin regardless of their own inventory. This process反而 created new ETF inventory, thereby reducing the market's original expectation of large-scale outflows.
Subsequently, on February 6th, we observed positive inflows into IBIT. Some IBIT buyers (the question is, what type of buyers were these) chose to buy the dip after the decline, which further offset what might have been a small net outflow.
First, I personally lean towards the view that the initial catalyst for this event came from the sell-off in software stocks, especially considering the high correlation exhibited between Bitcoin and software stocks, even higher than its correlation with gold. Please refer to the two charts below.
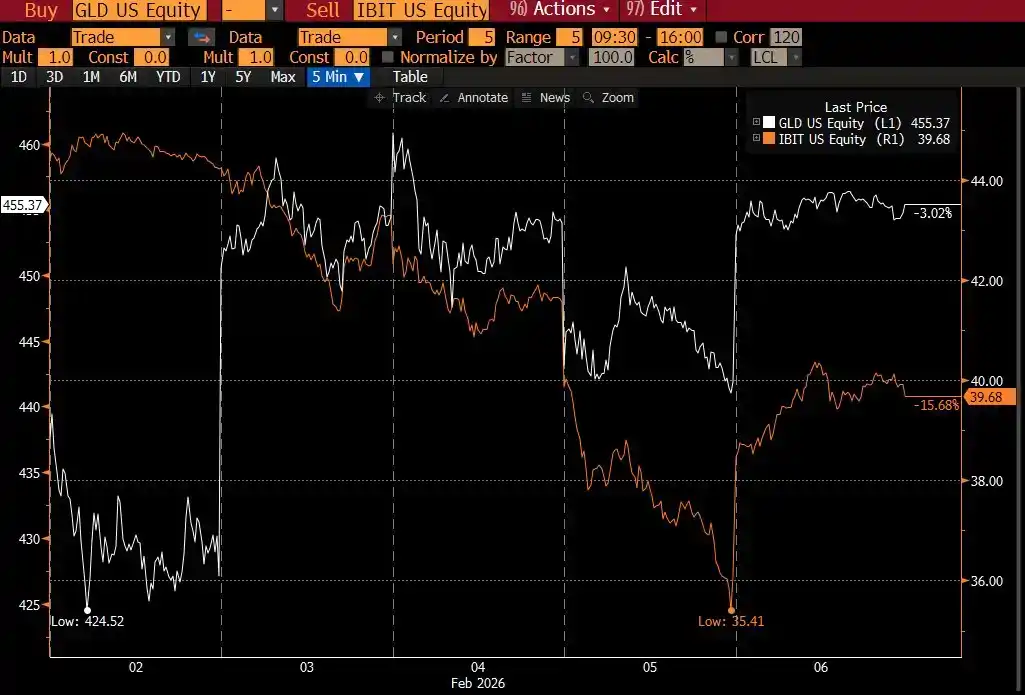
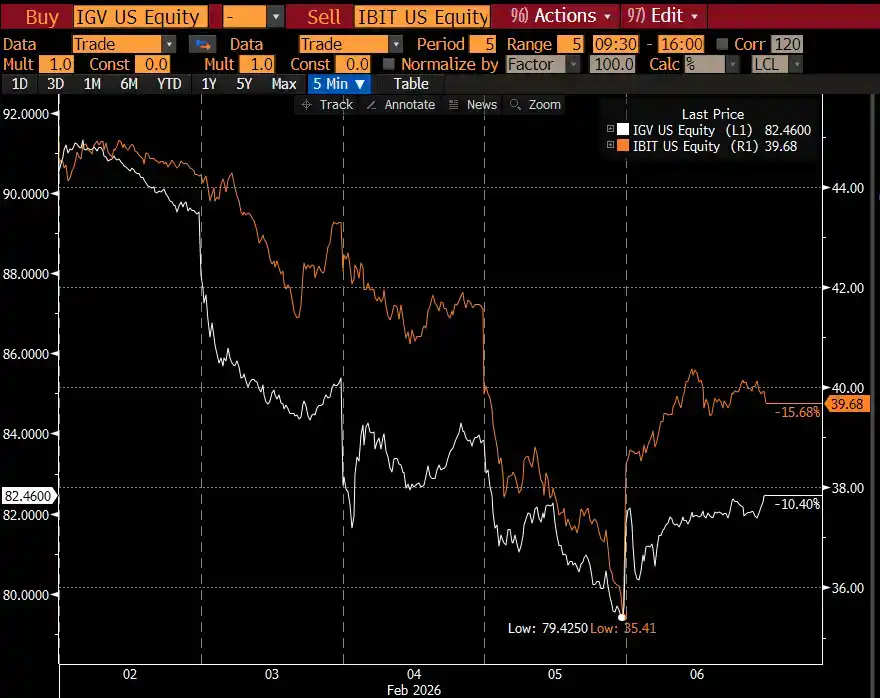
This is logically sound because gold is typically not an asset held in large quantities by multi-strategy funds engaged in financing trades, although it may appear in RIA model portfolios (pre-designed asset allocation plans). Therefore, in my view, this further confirms the judgment: the epicenter of this turmoil is more likely located within the multi-strategy fund system.
This makes the second judgment seem more reasonable, namely that this violent deleveraging process did indeed include hedged risk exposure to Bitcoin. Take the CME Bitcoin basis trade as an example; this has long been one of the most favored strategies by multi-strategy funds.

Looking at the complete data from January 26th to yesterday, covering the CME Bitcoin basis movements for 30, 60, 90, and 120-day tenors (thanks to top-tier industry expert @dlawant for the data), one can clearly see that the near-month basis jumped from 3.3% to as high as 9% on February 5th. This is one of the largest jumps we have personally observed in the market since the ETF launch, which almost unequivocally points to one conclusion: basis trades were massively liquidated under指令.
Imagine institutions like Millennium, Citadel, being forced to liquidate basis trade positions (sell spot, buy futures). Considering their size within the Bitcoin ETF ecosystem, it's easy to understand why this operation would cause剧烈冲击 to the overall market structure. I have previously written about my own deductions on this point.
Editor's补充: Currently, a significant portion of this indiscriminate selling in the US likely comes from multi-strategy hedge funds. These funds often employ delta hedging strategies or run some form of relative value (RV) or factor-neutral trades, which are currently widening spreads, possibly accompanied by spillover from growth stock equity correlations.
A rough estimate: About 1/3 of Bitcoin ETF holdings are institutional types, and roughly 50% (possibly more) of that is believed to be held by hedge funds. This is a considerable amount of fast money flow, which can easily capitulate and liquidate once financing costs or margin requirements rise in the current high-volatility environment and risk managers intervene, especially when the basis return is no longer worth the risk premium. It's worth mentioning that MSTR's USD trading volume today was among the highest in its history.
This is why the biggest factor最容易导致对冲基金倒闭 is the notorious "common holder risk": multiple seemingly independent funds hold highly similar exposures, and when the market turns down, everyone rushes for the same narrow exit, causing all downside correlations to tend towards 1. Selling in such poor liquidity is typical "risk-off" behavior, which we are seeing today. This will eventually be reflected in the ETF flow data. If this hypothesis holds, I suspect prices will reprice quickly once this all clears, though it will take some time to rebuild confidence afterwards.
This leads to the third clue. Now that we understand why IBIT was sold amid broad deleveraging, the question becomes: What was accelerating the decline? A potential "accelerant" is structured products. Although I don't believe the structured products market is large enough to trigger this sell-off on its own, when all factors align异常且完美地 in a way that exceeds any VaR (Value at Risk) model's expectations, they can certainly act as an acute event triggering连锁清算 behavior.
This immediately reminds me of my experience working at Morgan Stanley. There, structured products with knock-in put barriers (options that only "activate" and become effective puts if the underlying asset price touches/crosses a specific barrier level) often had highly destructive consequences. In some cases, the change in option Delta could even exceed 1, a phenomenon not even considered in the standard Black-Scholes model—because in the standard Black-Scholes framework, for plain vanilla options (the most basic European call/put options), the delta can never exceed 1.
Take a note priced by J.P. Morgan last November as an example; its knock-in barrier was set exactly at 43.6. If these notes continued to be issued in December and the Bitcoin price fell another 10%, one can imagine a large accumulation of knock-in barriers in the 38–39 range, the so-called "eye of the storm".
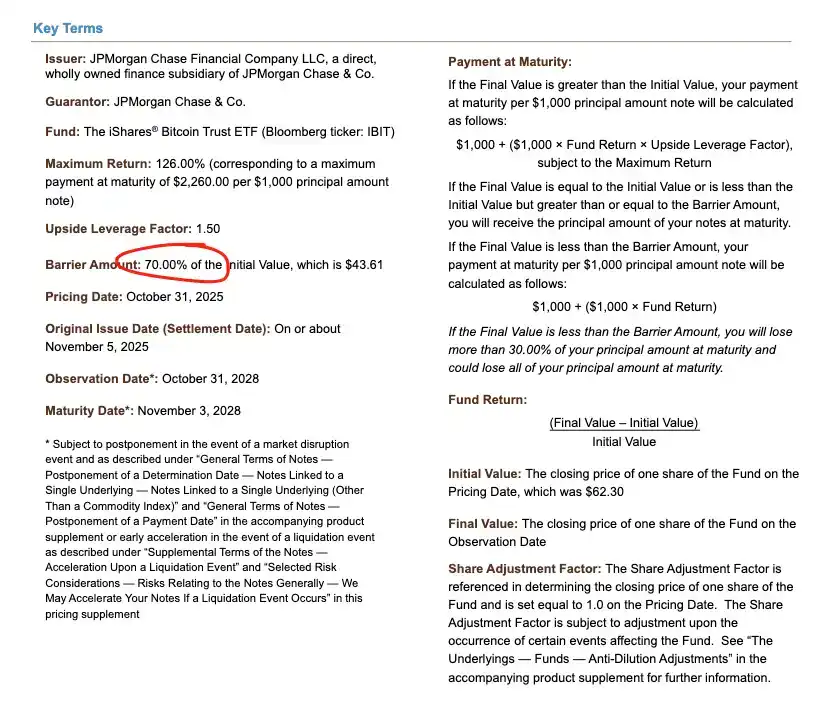
In cases where these barriers are breached, if dealers hedged the knock-in risk by selling puts, etc., the rate of change in Gamma under negative Vanna dynamics can be extremely rapid. At this point, the only viable response for a dealer is to aggressively sell the underlying asset as the market weakens. This is exactly what we observed: Implied Volatility (IV) collapsed to near 90%, approaching historical extremes, almost a disaster-level squeeze. In this situation, dealers had to expand their IBIT short positions to the extent that they ultimately created net new ETF shares. This part确实 requires some degree of deduction and is difficult to fully confirm without more detailed spread data, but given the record volume that day and the deep involvement of Authorized Participants (APs), this scenario is entirely possible.
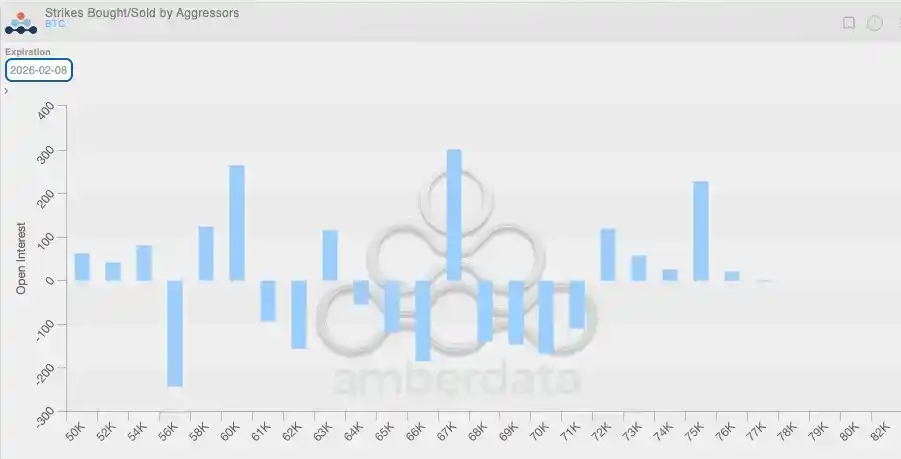
Combining this negative Vanna dynamic with another fact makes the logic clearer. Due to the overall low volatility in the previous period, clients in the crypto-native market普遍倾向于买入看跌期权 over the past few weeks. This means crypto dealers were naturally in a short Gamma state and had underpriced the potential for outsized moves. When the big move finally came, this structural imbalance further amplified the downward pressure. The position distribution chart below also clearly shows this, with dealers heavily concentrated in short Gamma positions on puts in the $64k to $71k range.

This brings us back to February 6th, when Bitcoin staged a strong rebound of over 10%. A notable phenomenon was that the Open Interest (OI) expansion速度明显快于 on CME compared to Binance (again, thanks to @dlawant for aligning the hourly data to 4 PM ET). From February 4th to 5th, a clear坍塌 of CME OI can be seen,再次印证了 the判断 that basis trades were massively liquidated on February 5th; on February 6th, these positions were likely re-established to take advantage of higher basis levels, thereby offsetting the impact of potential outflows.
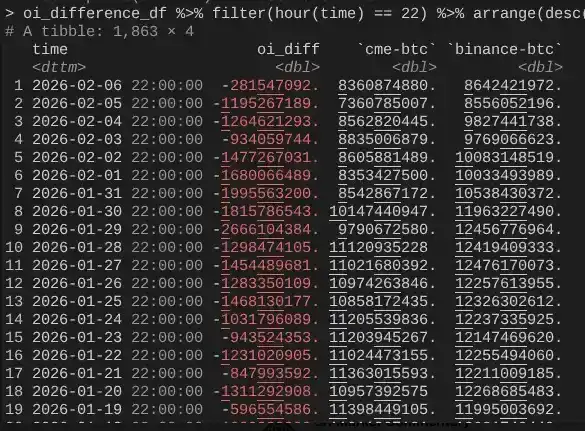
At this point, the entire logical chain closes: IBIT was roughly flat in terms of creations and redemptions because CME basis trades had recovered; but prices remained偏低 because Binance OI showed a clear坍塌, meaning a significant portion of the deleveraging pressure came from short Gamma positions and liquidations within the crypto-native market.
The above is my best explanation for the market performance on February 5th and subsequently on February 6th. This deduction is based on several assumptions and is not entirely satisfactory because it lacks a clear "culprit" to blame (like the FTX incident). But the core conclusion is this: The trigger for this sell-off came from de-risking behavior in traditional finance outside crypto, and this process恰好 pushed the Bitcoin price into a range where short Gamma hedging行为会加速下行. This decline was not driven by directional bearishness but by hedging需求, and ultimately reversed quickly on February 6th (unfortunately, this reversal primarily benefited market-neutral capital in traditional finance, rather than crypto-native directional strategies). Although this conclusion may not be exciting, it is at least somewhat reassuring that: the previous day's sell-off likely has nothing to do with a 10/10 event.
Yes, I don't believe what happened last week was a continuation of the 10/10 deleveraging process. I read an article suggesting this turmoil might have originated from a non-US, Hong Kong-based fund involved in a failed JPY carry trade. But this theory has two obvious flaws. First, I don't believe a non-crypto prime broker would be willing to service such complex multi-asset trades while also providing a 90-day margin buffer, without becoming insolvent first when the risk framework tightened. Second, if the carry trade funds were "escaping" by buying IBIT options, then the Bitcoin price drop itself would not accelerate risk release—these options would simply go out-of-the-money, their Greeks rapidly decaying to zero. This means the trade itself must have contained genuine downside risk. If someone was long USD/JPY carry and simultaneously selling IBIT puts, then frankly, that prime broker doesn't deserve to exist.
The next few days will be crucial, as we get more data, to judge whether investors are using this dip to build new demand. If so, that would be a very bullish signal. For now, I am quite encouraged by the potential for ETF inflows. I still firmly believe that true RIA-style ETF buyers (not relative value hedge funds) are savvy investors, and at the institutional level, we are seeing substantial, real, and profound progress, evident throughout the industry's advancement and among my friends at Bitwise. For this reason, I am focusing on net inflows that are not accompanied by basis trade expansion.
Finally, all this also shows once again that Bitcoin has integrated into the global financial capital markets in an extremely complex and mature way. This also means that when the market finds itself on the other side of a future squeeze, the upside move will be steeper than ever before.
The fragility of traditional finance's margin rules is Bitcoin's antifragility. Once the rebound comes—which I believe is inevitable, especially after Nasdaq raised the options OI cap—it will be a spectacular sight to behold.