We take a look at the reserves backing Tether’s USDT stablecoin and compare it to other similar holdings both in DeFi (decentralised finance) and TradFi (traditional finance). The collapse of TerraUSD (UST) has increased skepticism in all stablecoins, algorithmic or not, and raised fresh questions about what reserves, if any, are actually backing these stablecoins. These concerns are being voiced by both investors and users but also politicians and regulatory agencies. Many believe that stablecoins pose risks to both consumers and the broader economy.
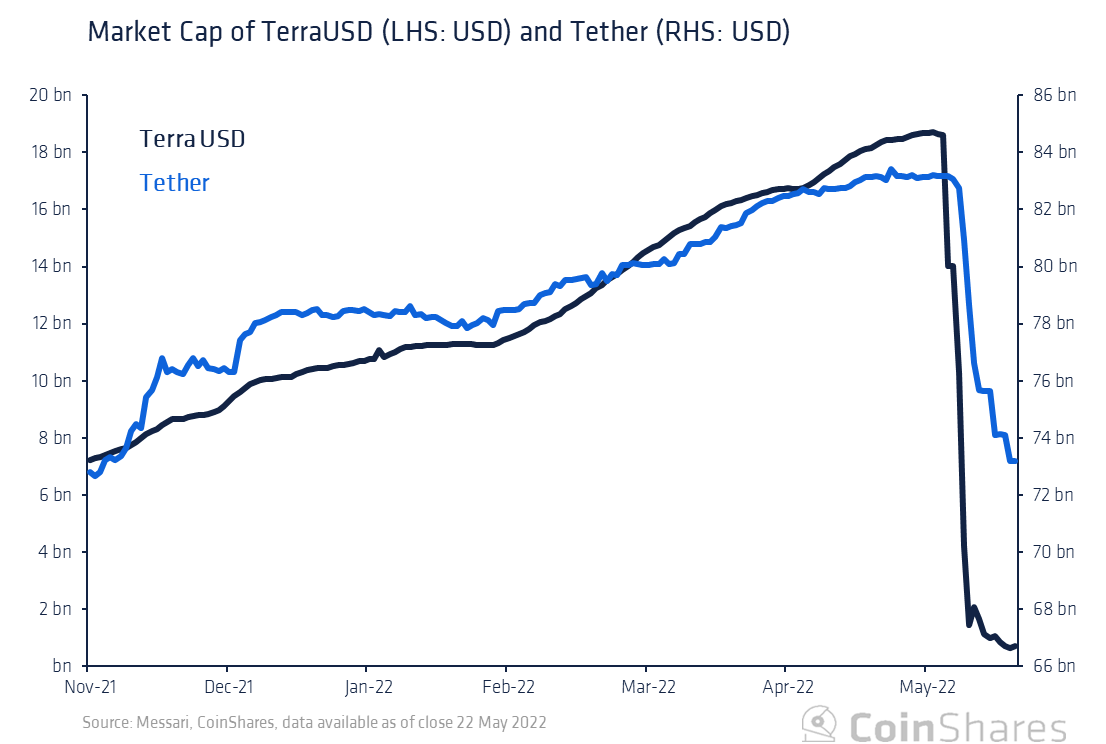
The value of all UST in circulation before the infamous meltdown was around $18.6bn, of which over $17bn (90%) was deposited into Anchor (a savings dApp on the Terra blockchain). While the value wiped out from the Terra ecosystem was substantial (over $40bn) it was not systemic to the wider crypto space as it only represented less than 2% of the market (1,2). The case for Tether’s USDT is sizeably different. The circulating supply for USDT currently stands at $74bn, four times more than UST at its peak. Below we show the relative market caps of TerraUSD (UST) and Tether (USDT) over the last 180 days.
Chart, line chart Description automatically generated
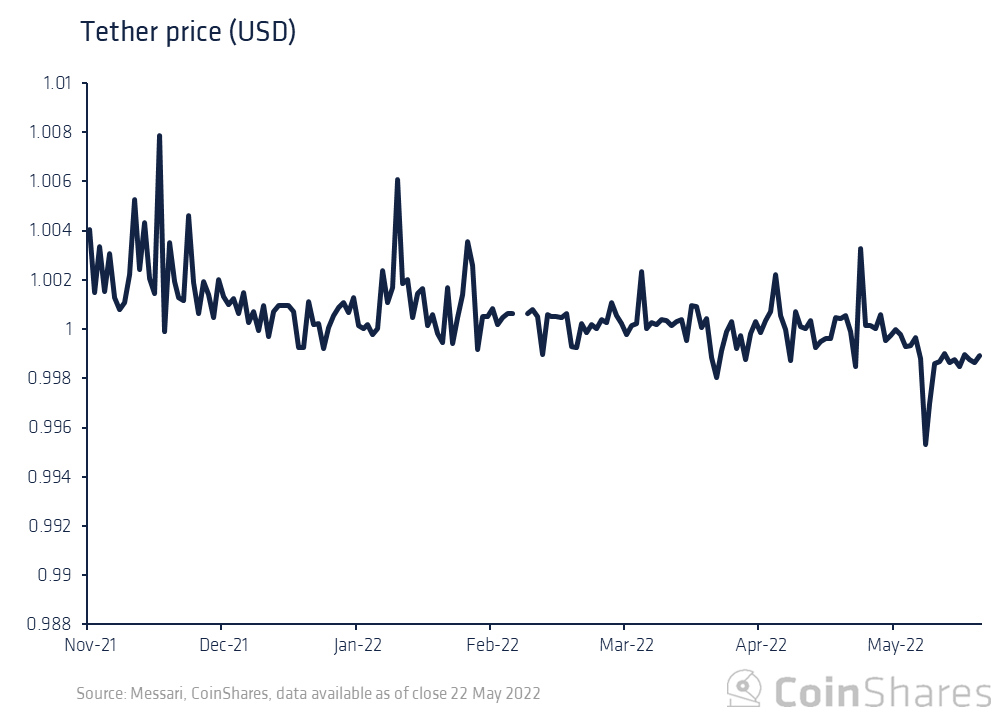
The market cap of UST quickly declined as it lost its peg against the US Dollar (currently at ~$0.06). This event spooked some holders of Tether and led to the redemption of their tokens for US dollars to the tune of $10 billion. For context, Tether redeemed over half of UST’s entire circulating supply in just over a week and didn’t lose its peg (didn’t drop below $0.99). This was by far the largest batch of redemptions ever, yet there weren't any systemic issues.
Chart, timeline Description automatically generated
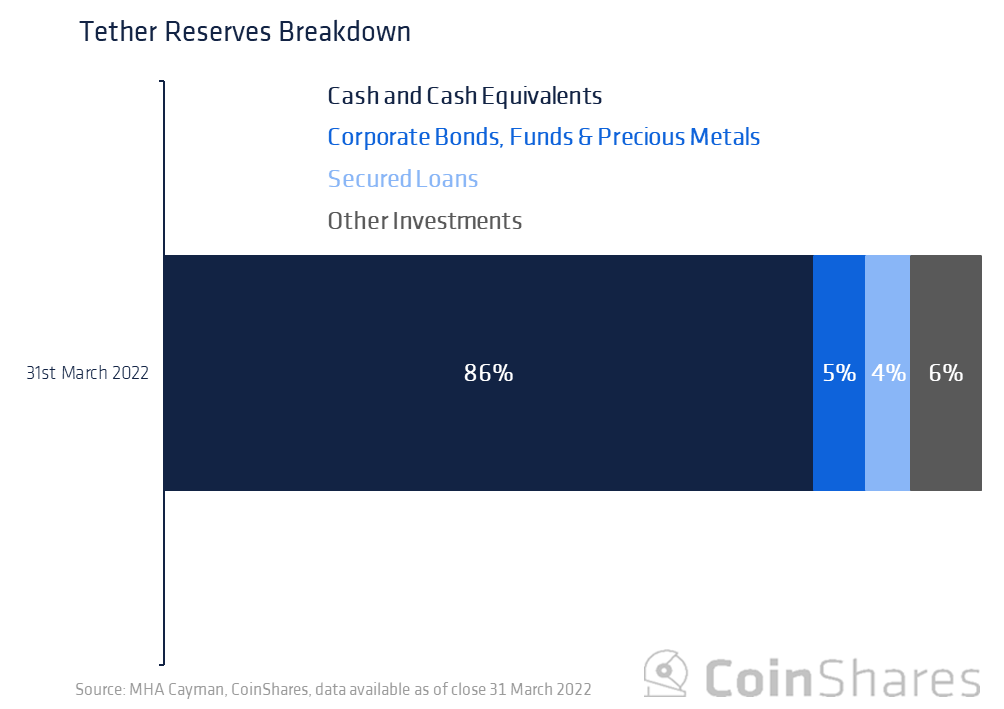
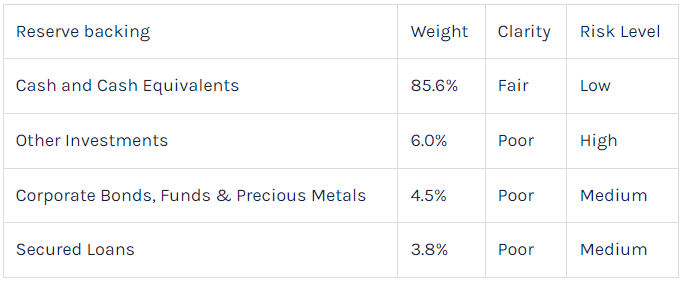
Volatility and redemptions aside, what is the Tether stablecoin (USDT) directly backed by, and is it secure? Well, these questions have prompted Tether to release an audited quarterly report on the breakdown of its reserves. These reserves are currently audited by the Cayman-based accountancy firm, MHA Cayman. We highlight the most recent audited breakdown below.
Graphical user interface, application Description automatically generated
We see that USDT is not financially backed 1:1 by cash (or cash equivalents) but more like 0.85:1. A closer look at cash and cash equivalents shows that just over half is allocated to U.S. Treasury Bills and ~30% is allocated to Commercial Paper (CP) and CDs. The remaining 16% is split between Money Market Funds (~10%), Cash & Bank Deposits (~6%), Non-U.S. Treasury Bills (~0.4%), and Reverse Repos (0.15%).
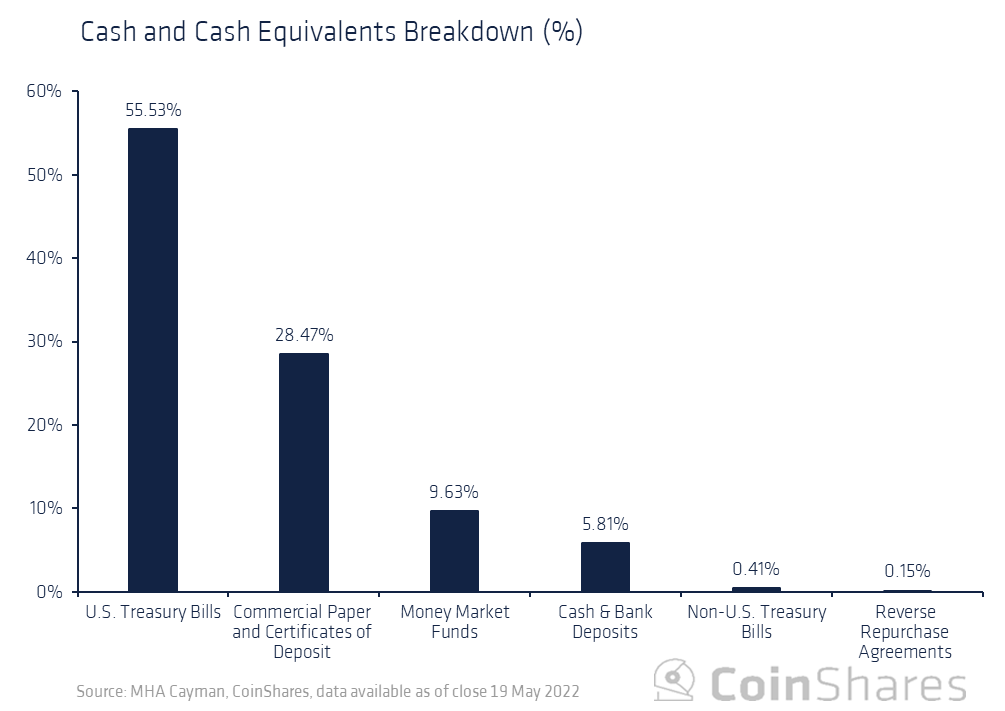
Chart, bar chart Description automatically generated
As for the remaining 14.36%, the audit does not provide much further clarity. The allotment to corporate bonds, funds & precious metals (4.52%) provides no detail on the type of corporate bonds (investment rating, country) nor the type of funds. The type of precious metals is also excluded and the percentage breakdown of these three categories is also opaque. There aren’t any disclosures on the secured loans (3.82%) however it is mentioned that other investments (6.02%) do include digital assets but to what extent is also unknown.
History
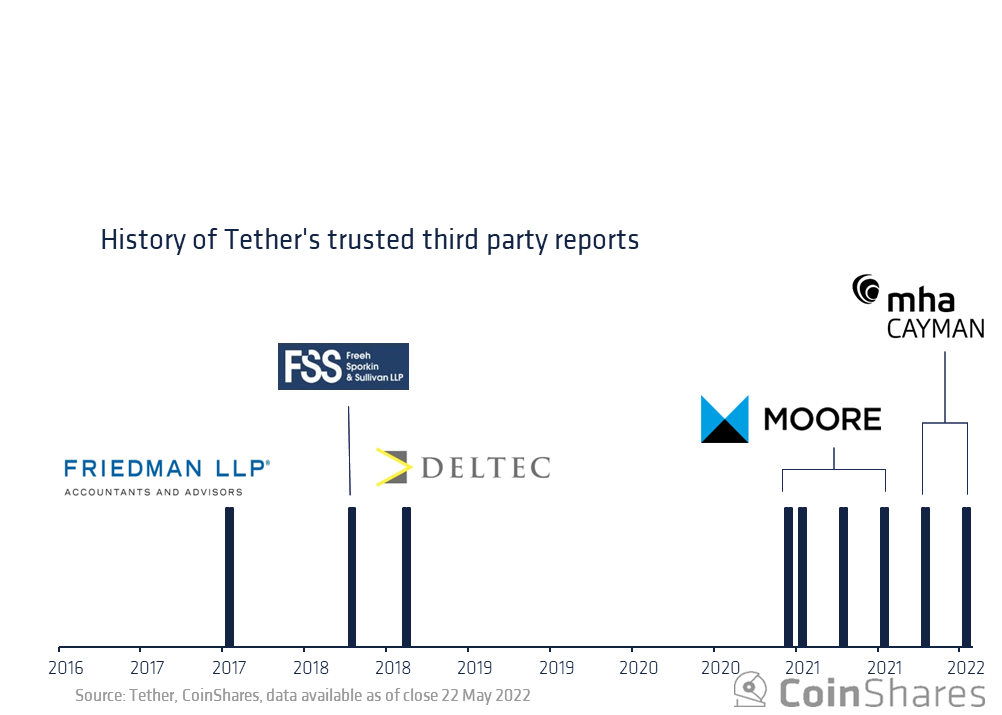
Tether has engaged the services of several different banks, legal firms, and accounting firms since 2017 to attest to the size and validity of its reserves. These firms included MHA Cayman, Moore Cayman, Deltec Bank, FSS, and Friedman LLP. We touch on a brief history of these relationships below.
In 2017, as pressure mounted in relation to USDT reserves, Tether enlisted the services of the accounting firm, Friedman LLP to perform reserve audits, but critics highlighted that the study had methodological flaws and did not represent a complete audit (3,4). Not too long after the first audit, Tether reported that the Friedman company was not performing the audit work, in what they considered a "reasonable period of time” and ended the relationship. Tether then turned to the Washington-based law firm, FSS. The FSS report was not a full audit of Tether but stated the law firm received sworn and notarized statements from Tether’s two (unnamed) banks. To help build confidence, Tether had Bahamas-based bank, Deltec, release a report confirming the amount of cash in Tether’s account with them but again this did not provide the full picture as it was only the cash value from one of its banks. In 2021 the New York Attorney General’s office finished an investigation stating that Tether was overstating its reserves and hiding losses of approximately $850m. This led to an $18.5m fine and a mandate to publish quarterly reports of its holdings for 2 years (5). Around the same time, Tether announced a partnership with the Cayman-based accounting firm, Moore Cayman. Moore provided assurance reports, attesting to the full backing of USDT and later provided reports breaking down the reserves in more detail. However, since January 2022, MHA MacIntyre Hudson stated that its Cayman Islands branch, MHA Cayman, will be handling the customers of Moore Cayman. It should be noted that MHA MacIntyre Hudson is currently under investigation by the U.K. Financial Reporting Council for previous audits of an unrelated firm (6).
A picture containing chart Description automatically generated
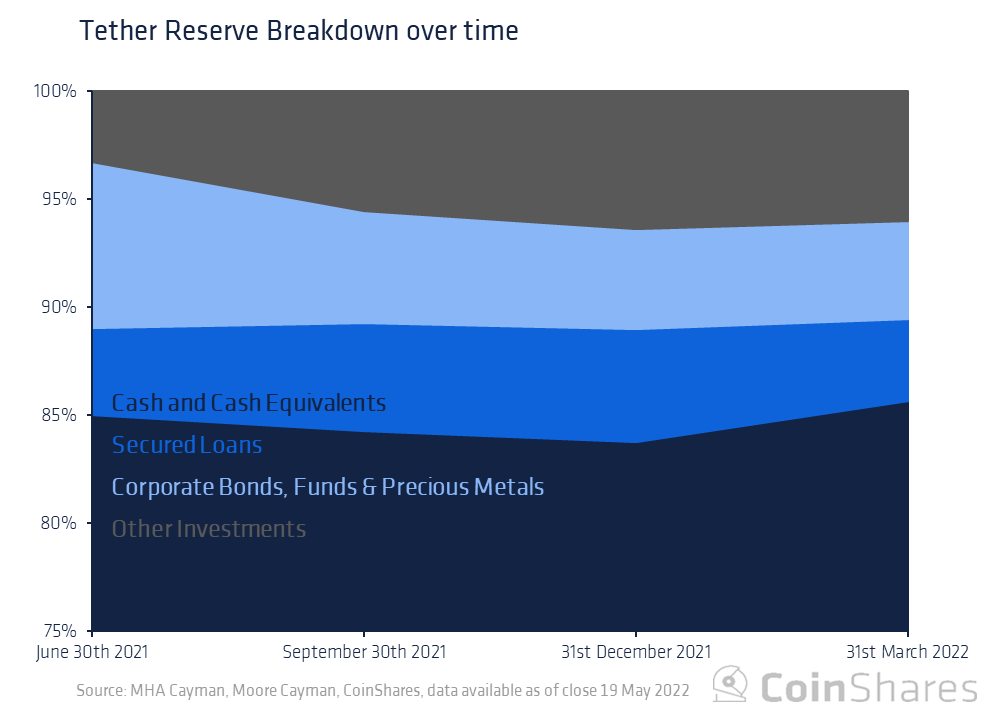
As mentioned above, the breakdowns of the reserve were only provided from June 30th, 2021 (after other stablecoins began to release theirs). For the most part, the allotted weights have remained relatively steady since June 2021 with Cash and Cash Equivalents slightly rising from 85% to 86% while Secured loans remain at 4%. However, Other Investments (which include digital assets) have doubled from 3% to 6%, increasing the risk level of the reserves. The rise in Other Investments has come at the expense of Corporate Bonds, Funds & Precious Metals which declined from 8% to 5% over the period. In US dollar terms, for the latest quarter, Cash and Cash Equivalents have increased by 7% while Secured Loans decreased by 24%.
A picture containing graphical user interface Description automatically generated
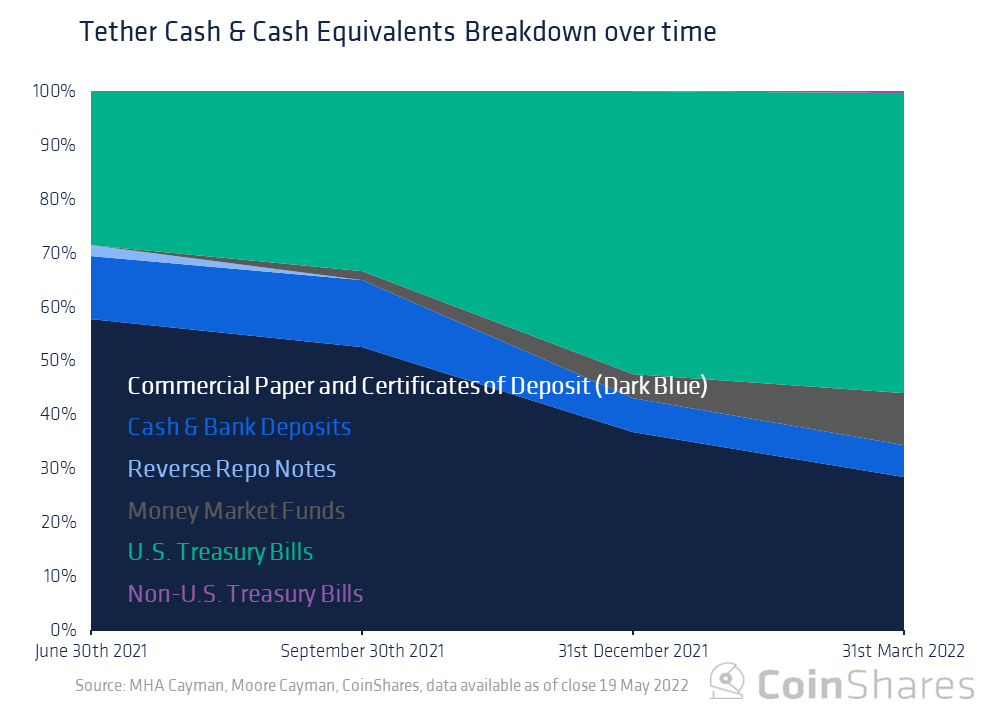
Looking deeper at Cash and Cash Equivalents, we show below that U.S. Treasury Bills have started to become a larger part of the reserves (24% to 48%) thereby replacing the dominance of Commerical Paper and CDs (49% to 24%). This reduction in commercial paper holdings has somewhat eased concerns over the riskiness of these instruments. Cash & Bank Deposits were reduced from 10% to 5% and Reverse Repo Notes decreased from 2% to 0.1%. There has also been an addition of Money Market Funds which now make up 8%, and in the most recent quarter, Non-U.S. Treasury Bills have been added (0.3%).
Graphical user interface, chart Description automatically generated
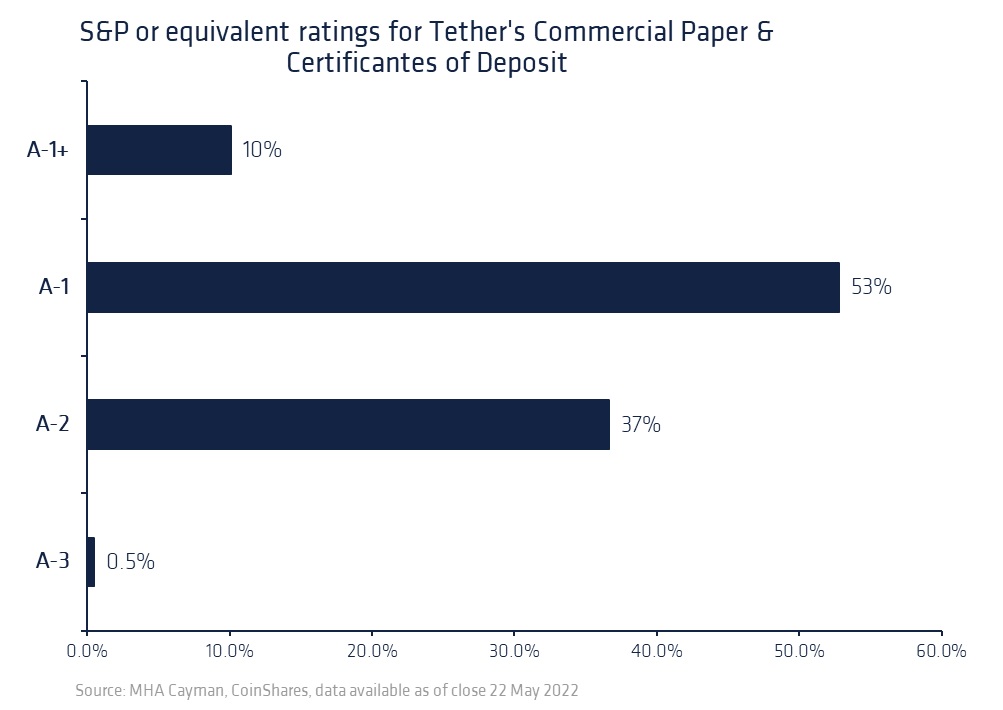
The quality of Tether’s commercial paper continues to be questioned even as its allocation is reduced. Below we show a breakdown of the ratings of Tether’s commercial paper as of March 2022.
Chart, timeline, bar chart Description automatically generated
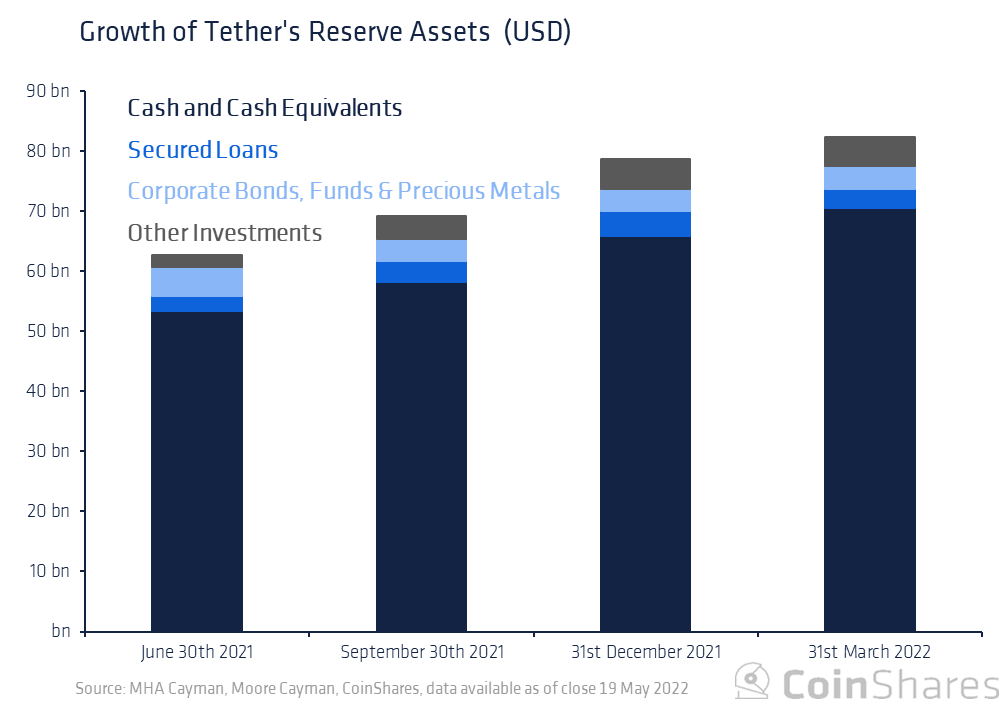
From June 2021, (when Tether started to report its reserve breakdowns) to March 2022, Tether’s reserve has grown 31% from $63bn to $83bn. This growth comprised a 32% increase in cash and cash equivalents, a 25% increase in secured loans, a 23% decrease in corporate bonds et. al, and a 141% increase in other investments (likely due to a rise in digital asset prices).
Chart, bar chart Description automatically generated
However, since March 31st 2022, there have been around $10bn in redemptions (~$84bn to ~$74bn) without any detrimental effects. The process for redeeming involves a one-time $150 verification process as well as a fee of 0.1%, while the minimum redemption amount currently stands at $100,000. These constraints can slow down a run on assets if one were to materialise, but as evidenced Tether can already handle a 10-figure redemption in just over a week.
Comparisons
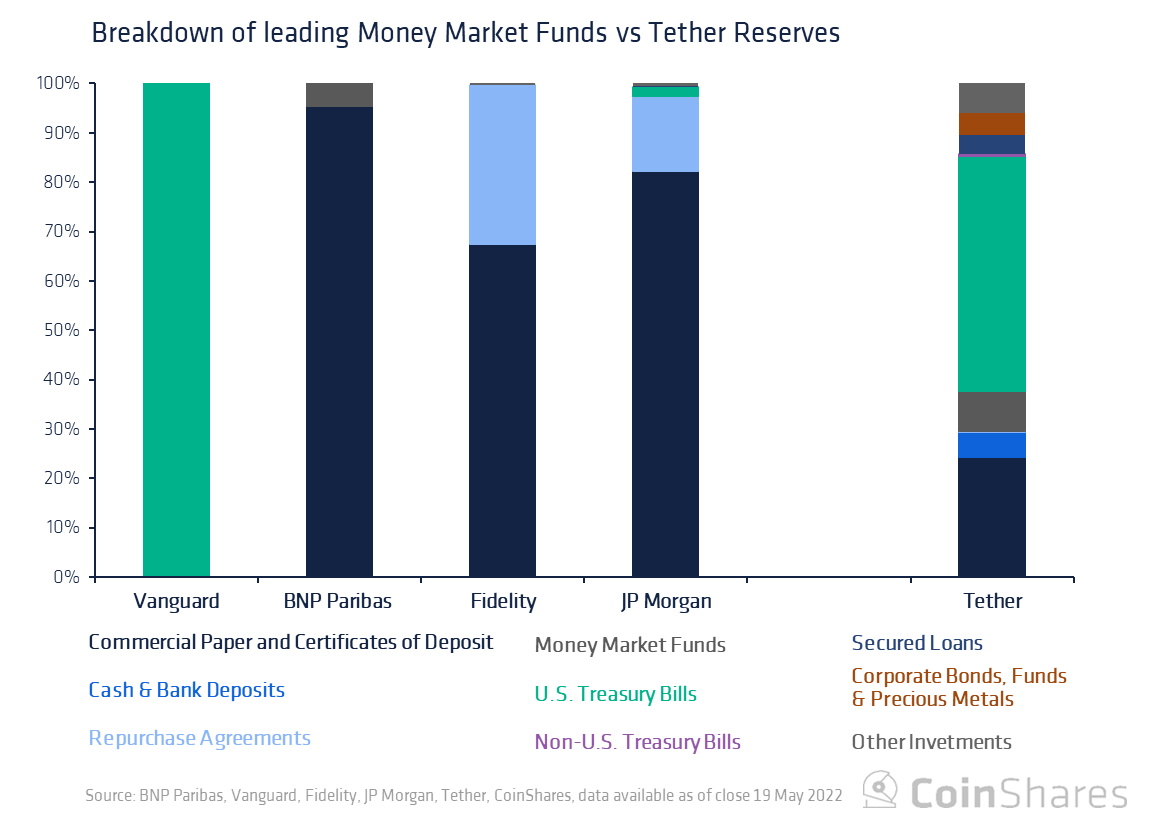
So how do Tether’s reserves compare against leading money market funds? As outlined in the audit report, 8% of Tether’s reserves comprise money market funds although the details of these funds are not disclosed. We examine the portfolio breakdown of a few top money market funds by AUM and compare the holdings as of the last quarter. We see below that mutual funds can vary widely in terms of fixed income holdings although commercial paper repurchase agreements and certificates of deposit appear to be popular choices.
Chart, bar chart Description automatically generated
While it’s useful to contrast the differences between money market funds and a stablecoin reserve it’s not exactly an apples-to-apples comparison. Below we highlight the reserve breakdown for the next two largest stablecoins by market capitalization, Circle’s USDC, and Binance’s BUSD.
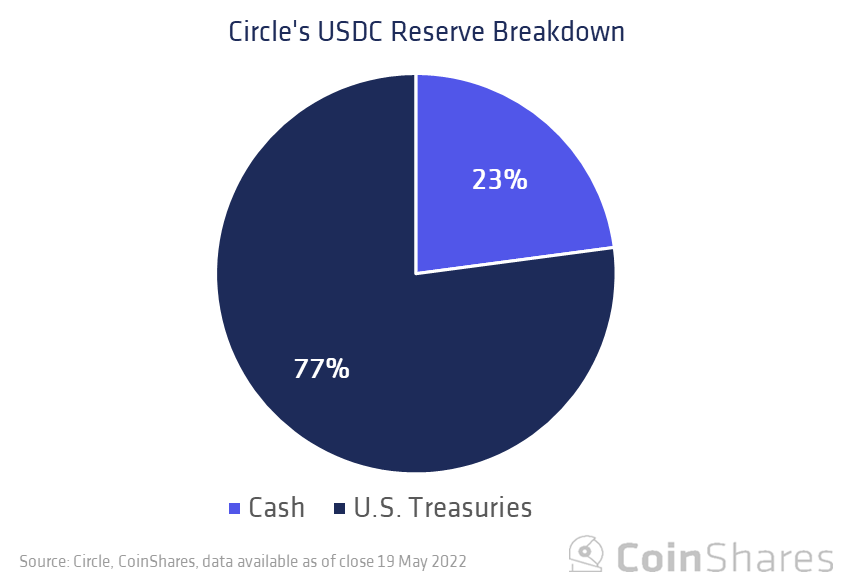
Chart, pie chart Description automatically generated
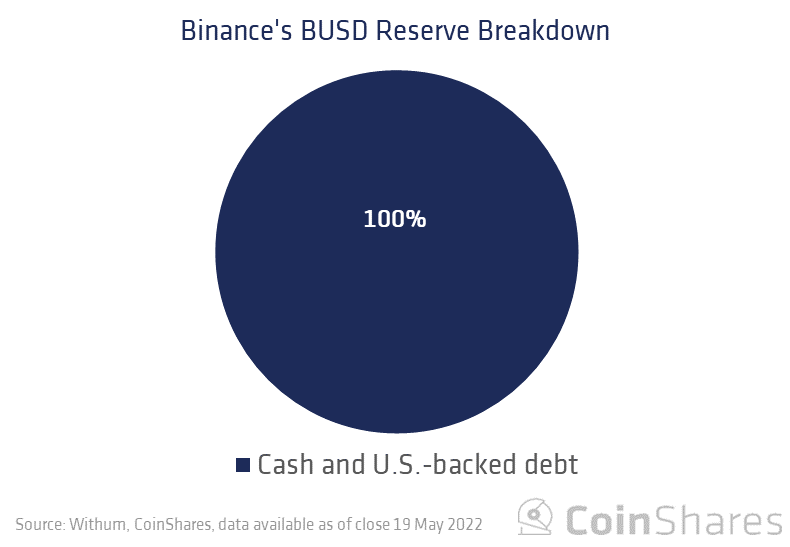
BUSD, which was founded by Binance and Paxos, does not break out the weights between cash and U.S.-backed debt. BUSD reserves are audited by Withum (who also performs audits of other stablecoins).
Chart, pie chart, bubble chart Description automatically generated
Tether was the first major stablecoin and had market dominance for a few years. However, in recent times, Circle’s USDC and Binance’s BUSD have gained significant market share among the leading stablecoins (~37% and ~13% respectively).
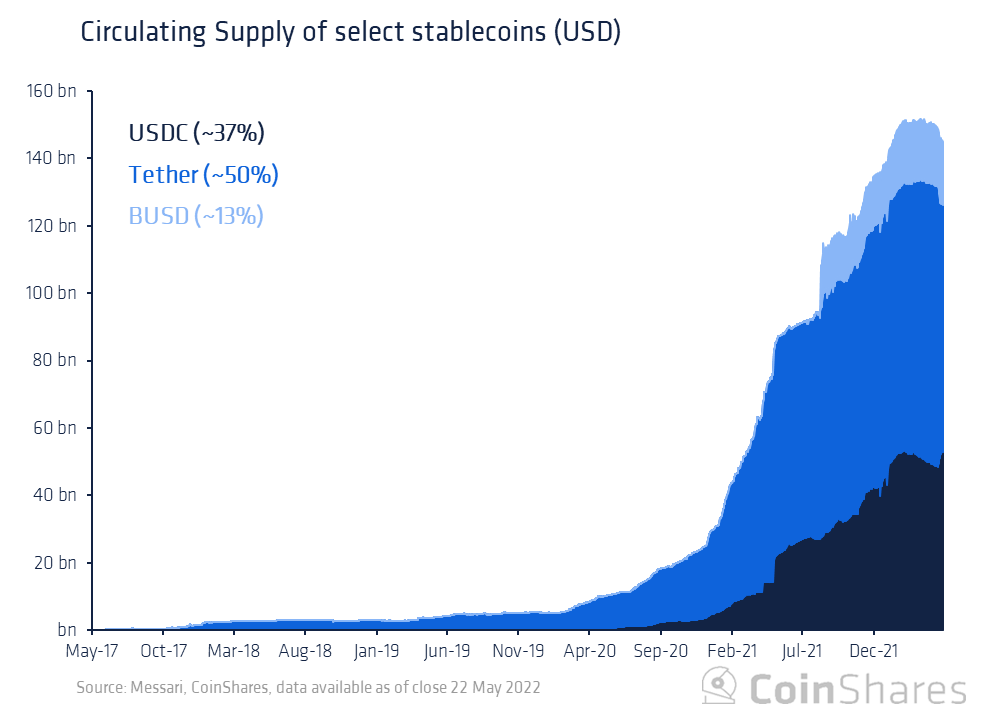
A picture containing chart Description automatically generated
Furthermore, Tether commands a ~33% market share of all stablecoin/BTC trading volumes on trusted exchanges though this too is also waning. The relative importance of USDT is evidently in decline.
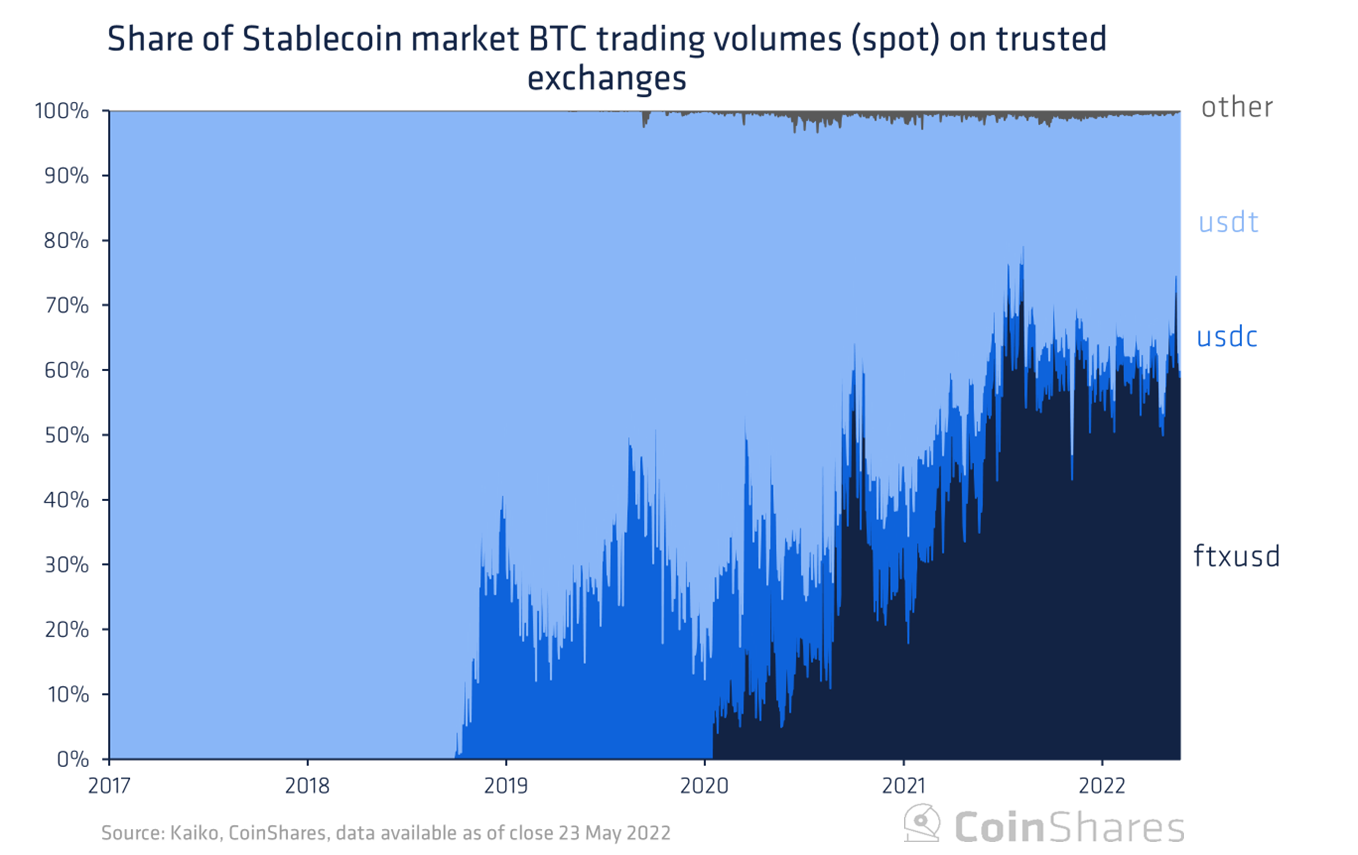
Chart, histogram Description automatically generated
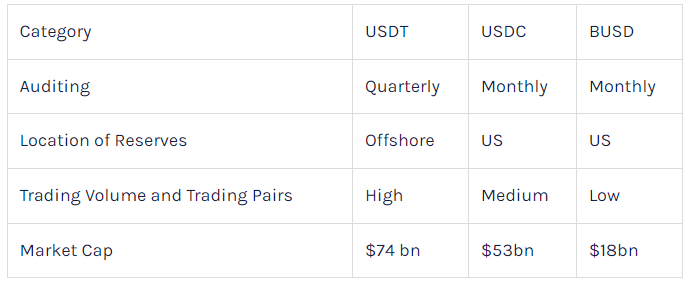
All three coins are pegged to the US dollar at a 1:1 ratio and both Circle and Binance/Paxos undergo and publish monthly audits as opposed to Tether’s quarterly reports. While USDT always shows its reserves, it doesn’t provide public information on auditing which may be a concern for investors. Despite the differences in transparency reporting, there is some variation in the reserves among these stablecoins. We highlight some more differences between the three stablecoins below.
The world’s most popular stablecoin, Tether, has been around since early 2015 and has withstood many tests and a few black swan events. The first mover’s advantage plus the real-world tests have increased confidence in USDT as evidenced by the growth in circulating supply. However, the real test may be yet to come and renewed concerns over stablecoin reserves have caused a 12% reduction in USDT circulation through recent redemptions. Furthermore, competitors such as Circle have more transparent reporting in a more trustworthy regulatory environment. This perceived safety of USDC (and others) continues to lead to a decline in Tether’s market share. As seen before, this trend may result in Tether adopting more sturdy reserves, greater transparency, and more diligent auditing practices. The alternative seems to be a reduction in trust, market share, and outstanding coins which will result in a materially less important market player. A path toward the former reduces the risk for all while a path toward the latter makes the question “Is Tether a systemic risk to the crypto market?” a less relevant question
https://www.coingecko.com/en/coins/tether
https://defillama.com/chain/Terra
https://bitfinexed.medium.com/the-so-called-tether-audit-that-isnt-an-audit-at-all-5a40cfcc2a75
https://bennettftomlin.com/2021/07/17/a-history-of-tether-and-bitfinexs-audits-attestations-memos-and-letters-both-promised-and-actual/
https://ag.ny.gov/press-release/2021/attorney-general-james-ends-virtual-currency-trading-platform-bitfinexs-illegal
https://www.frc.org.uk/news/january-2022-(1)/investigation-regarding-the-audit-of-mrg-finance-b
Disclosure
The information contained in this document is for general information only. Nothing in this document should be interpreted as constituting an offer of (or any solicitation in connection with) any investment products or services by any member of the CoinShares Group where it may be illegal to do so. Access to any investment products or services of the CoinShares Group is in all cases subject to the applicable laws and regulations relating thereto.
This document is directed at professional and institutional investors. Investments may go up or down in value and you may lose some or all of the amount invested. Past performance is not necessarily a guide to future performance. This document contains historical data. Historical performance is not an indication of future performance and investments may go up and down in value. You cannot invest directly in an index. Fees and expenses have not been included.
Although produced with reasonable care and skill, no representation should be taken as having been given that this document is an exhaustive analysis of all of the considerations which its subject-matter may give rise to.This document fairly represents the opinions and sentiments of CoinShares, as at the date of its issuance but it should be noted that such opinions and sentiments may be revised from time to time, for example in light of experience and further developments, and this document may not necessarily be updated to reflect the same.
The information presented in this document has been developed internally and / or obtained from sources believed to be reliable; however, CoinShares does not guarantee the accuracy, adequacy or completeness of such information. Predictions, opinions and other information contained in this document are subject to change continually and without notice of any kind and may no longer be true after the date indicated. Third party data providers make no warranties or representation of any kind in relation to the use of any of their data in this document. CoinShares does not accept any liability whatsoever for any direct, indirect or consequential loss arising from any use of this document or its contents.
Any forward-looking statements speak only as of the date they are made, and CoinShares assumes no duty to, and does not undertake, to update forward-looking statements. Forward-looking statements are subject to numerous assumptions, risks and uncertainties, which change over time. Nothing within this document constitutes (or should be construed as being) investment, legal, tax or other advice. This document should not be used as the basis for any investment decision(s) which a reader thereof may be considering. Any potential investor in digital assets, even if experienced and affluent, is strongly recommended to seek independent financial advice upon the merits of the same in the context of their own unique circumstances.
This document is directed at, and only made available to, professional clients and eligible counterparties. For UK investors: CoinShares Capital Markets (UK) Limited is an appointed representative of Strata Global Limited which is authorised and regulated by the Financial Conduct Authority (FRN 563834). The address of CoinShares Capital Markets (UK) Limited is 82 Baker Street, London, W1U 6TE. For EU investors: Napoleon AM (napoleon-am.com) is a French asset management company regulated by the Autorité des Marchés Financiers (AMF), registered under number GP-19000015 since 27/03/2019. Its office is located at 11 rue Paul Lelong, 75002 Paris, France.