PI Token Shows Signs of Reversal as Technical Indicators Turn Bullish

TheNewsCryptoXuất bản vào 2025-05-05Cập nhật gần nhất vào 2025-05-06

Tóm tắt

However, prudent investors should note that for a complete trend reversal, PI would need to break above the descending trendline that has capped its price since April 12. Until this resistance is definitively broken, the token remains in a technical downtrend despite the encouraging indicators.

  • PI token trading below descending trendline since April 12 after $3 peak.
  • On-balance volume indicator signals growing buying interest.
  • BBTrend histogram contraction points to weakening selling pressure.

The PI token has been caught in a persistent downtrend since reaching its all-time high of $3 on February 26, with prices consistently trading below a descending trendline since April 12. This extended decline has created a negative market sentiment around the altcoin, but several technical indicators now suggest that a bullish reversal may be forming.


According to a recent analysis, the PI/USD one-day chart displays early signals of a potential rally following this extended period of price weakness. Most telling among these indicators is the on-balance volume (OBV), which has shown a noticeable uptick over the past two trading days.


The OBV indicator is a technical analysis tool that uses volume flow to predict changes in price movement. It works by adding volume on days when prices close higher and subtracting volume on days when prices close lower. In PI’s case, the rising OBV even as price remains subdued creates a bullish divergence – typically a reliable signal that market sentiment is shifting beneath the surface.


Current data shows buyers are accumulating PI tokens


The current reading indicates that buyers are quietly accumulating PI tokens despite the ongoing price weakness. This accumulation phase frequently precedes price breakouts, particularly when combined with other supportive technical factors. One such factor is the visible contraction in PI’s BBTrend indicator histogram, where the red bars have progressively shortened in recent trading sessions.
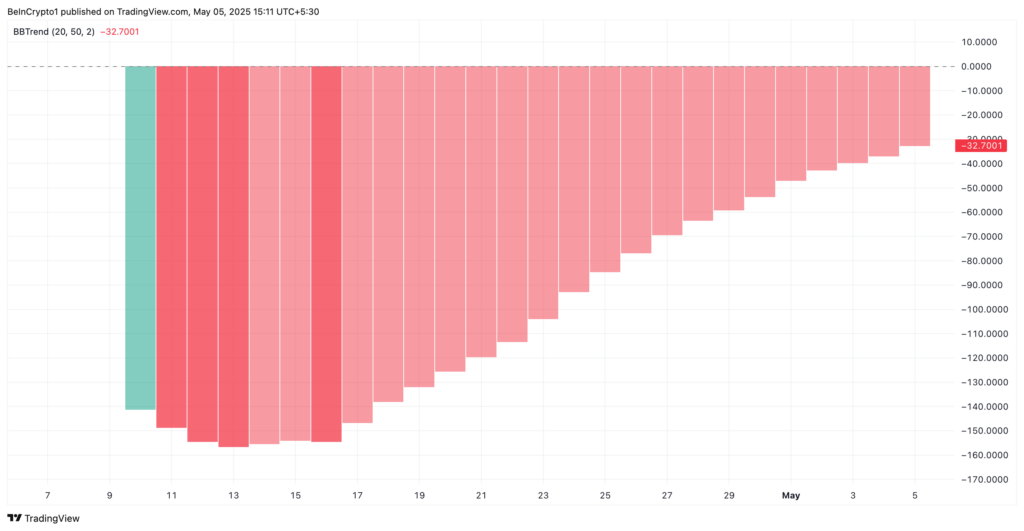
PI BBTrend. Source: TradingView The BBTrend tool measures the relationship between price and Bollinger Bands, with contracting histogram bars indicating a reduction in selling pressure. This pattern often serves as an early warning signal that a prevailing downtrend is losing momentum and may soon reverse.


For traders monitoring PI, the convergence of these technical signals suggests that the token may be approaching a significant turning point. The combination of rising buying interest (as indicated by OBV) with diminishing selling pressure (shown by BBTrend) often precedes a bullish breakout, particularly after an extended downtrend has pushed prices to potentially oversold levels.


However, prudent investors should note that for a complete trend reversal, PI would need to break above the descending trendline that has capped its price since April 12. Until this resistance is definitively broken, the token remains in a technical downtrend despite the encouraging indicators.


Nội dung Liên quan

Glassnode: Thị trường tiền điện tử bước vào giai đoạn cuối xây đáy

Thị trường tiền mã hóa đang bước vào giai đoạn cuối hình thành đáy. Bitcoin liên tục giao dịch dưới giá trung bình thực và chi phí của nhà đầu tư ngắn hạn suốt năm tháng, cho thấy vùng định giá thấp sâu. Áp lực bán chính đến từ việc chốt lỗ của nhà đầu tư dài hạn, với khối lượng lỗ thực hiện trong ngày đạt đỉnh 280 triệu USD, mức cao nhất kể từ tháng 12/2022, chiếm 43% tổng lỗ trên chuỗi. Dù quy mô dòng tiền ra từ ETF tiền mã hóa Mỹ đã chậm lại, nhưng vẫn duy trì trạng thái ròng âm hàng tháng và khối lượng giao dịch hàng ngày chỉ bằng khoảng 20% so với đỉnh tháng 10/2025, cho thấy nhu cầu mua của tổ chức chưa ổn định. Trên thị trường phái sinh, cơ cấu vị thế đã chuyển sang thận trọng thiên tăng, với tỷ lệ quyền chọn bán/mua giảm xuống mức thấp nhất trong năm 2026. Tuy nhiên, đường cong biến động vẫn định giá cao cho các công cụ phòng ngừa rủi ro giảm giá, và giá giao ngay hiện tại vẫn thấp hơn mức "giá đau khổ tối đa". Mặc dù các điều kiện cần thiết để hình thành đáy đã xuất hiện, thị trường vẫn cần ba tín hiệu then chốt để xác nhận sự đảo chiều: áp lực chốt lỗ của nhà đầu tư dài hạn giảm nhiệt, dòng vốn tổ chức ổn định trở lại, và giá Bitcoin phục hồi vững chắc trên mức giá trung bình thực của thị trường.

marsbit1 giờ trước

Glassnode: Thị trường tiền điện tử bước vào giai đoạn cuối xây đáy

marsbit1 giờ trước

Shiba Inu giảm 5% bất chấp đợt đốt token lớn nhất trong 6 tháng - Đây là lý do!

Shiba Inu (SHIB) đã ghi nhận đợt đốt token lớn nhất trong vòng 6 tháng vào ngày 8 tháng 7, với hơn 110 triệu SHIB bị loại bỏ vĩnh viễn khỏi lưu thông. Hoạt động đốt token hàng tuần cũng tăng lên 152 triệu SHIB, cho thấy nhịp độ đang tăng tốc. Tuy nhiên, điều này không ngăn được giá SHIB giảm khoảng 5%, tiếp tục xu hướng đi xuống. Lý do chính là mặc dù đã đốt hơn 410 nghìn tỷ SHIB kể từ khi ra mắt, nhưng vẫn còn khoảng 585,6 nghìn tỷ token đang lưu hành. Lượng token bị đốt gần đây chỉ là một phần rất nhỏ so với tổng nguồn cung, không đủ để thắt chặt đáng kể nguồn cung lưu hành. Trong bối cảnh nhu cầu đối với memecoin nói chung đang suy yếu – với tỷ trọng vốn hóa của memecoin trong thị trường altcoin giảm từ hơn 10% xuống còn 3,7% – thì việc giảm nguồn cung một cách biên này là chưa đủ. Do đó, SHIB hiện nhạy cảm hơn với dòng vốn rút ra khỏi toàn bộ lĩnh vực memecoin hơn là tốc độ đốt token của chính nó. Cho đến khi thanh khoản quay trở lại ngành, nhu cầu, chứ không phải cơ chế giảm phát token, sẽ vẫn là yếu tố chính quyết định giá của SHIB.

ambcrypto1 giờ trước

Shiba Inu giảm 5% bất chấp đợt đốt token lớn nhất trong 6 tháng - Đây là lý do!

ambcrypto1 giờ trước

Giao dịch

Giao ngay
活动图片