Zcash surges 20% after breakout – ZEC traders, watch THIS for next move

ambcryptoОпубліковано о 2026-03-17Востаннє оновлено о 2026-03-17

Анотація

Zcash (ZEC) surged over 20% in 24 hours, breaking out of a descending wedge pattern and signaling a potential bullish shift. The price moved from the $194.90 support level toward the $300 resistance zone, with RSI strengthening to 58, indicating growing buying interest without overbought conditions. However, underlying metrics present mixed signals: Spot Taker CVD remains sell-dominant, suggesting persistent selling pressure, and the funding rate is negative (-0.032%), reflecting heavy short positioning. This sets the stage for potential short squeezes and increased volatility near key resistance. While the breakout shows strength, the sustainability of the rally depends on overcoming layered resistance and resolving conflicting market dynamics.

Zcash has surged over 20% in 24 hours as trading volume rises over 76%, reflecting a sharp increase in participation and aggressive positioning.

This expansion in activity signals renewed interest after a prolonged decline. Zcash [ZEC] has pushed upward from the $194.90 support zone, showing buyers stepping in with conviction.

However, underlying metrics still present mixed signals that require careful interpretation.

While price continues climbing, structural resistance remains nearby, which could influence short-term direction.

Breakout from wedge signals recovery push for Zcash

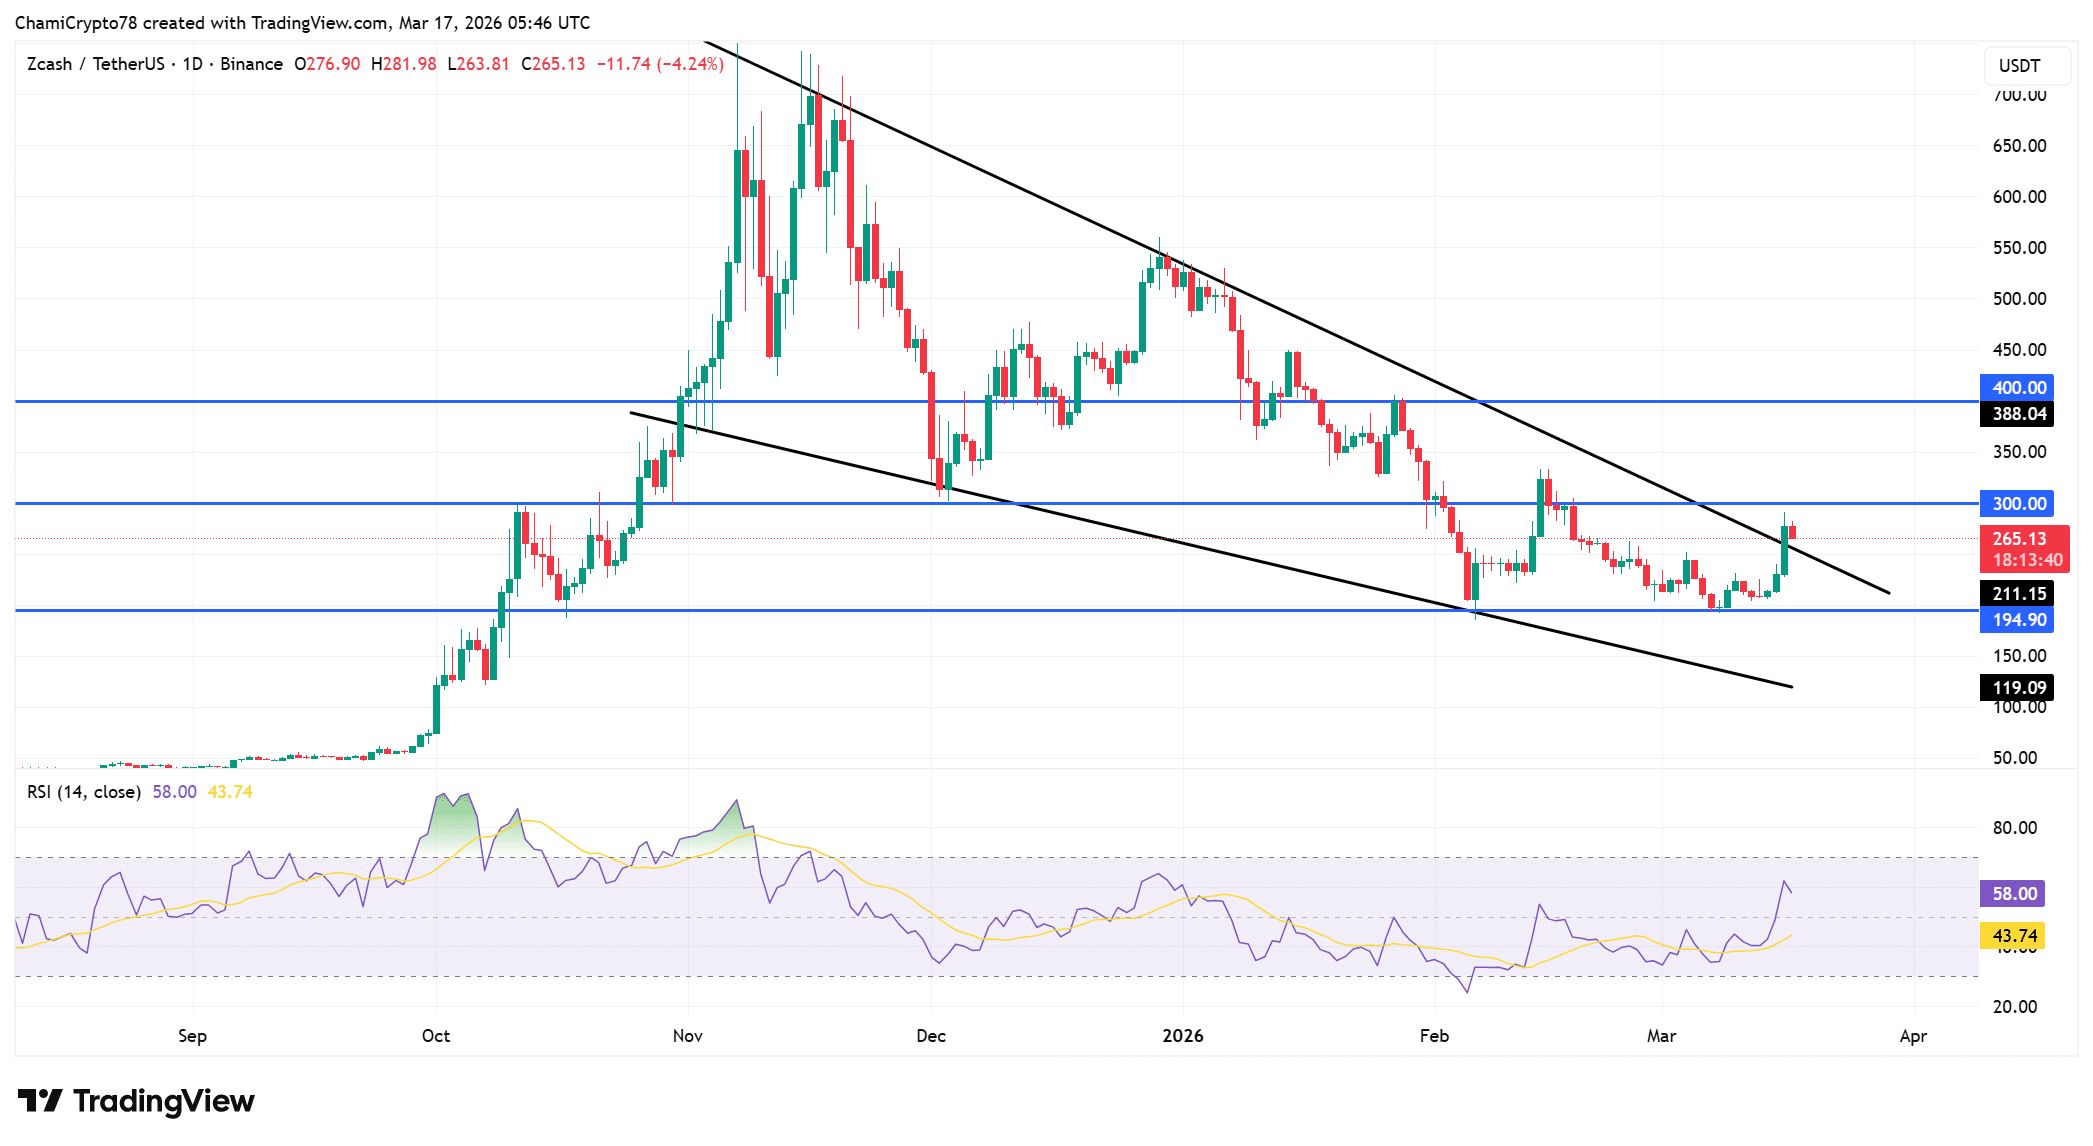
Zcash has broken out of a descending wedge, shifting its short-term structure toward bullish territory.

This breakout follows a sustained compression phase where price respected lower highs within the wedge formation.

After rebounding from $194.90, the price has advanced toward the $300 resistance zone, which now acts as the immediate barrier.

However, the broader trendline from previous highs still looms above, suggesting that upside continuation must overcome layered resistance.

The breakout itself indicates improving market strength, yet the proximity to resistance introduces friction.

As a result, price now tests a critical decision zone where continuation or rejection could define the next directional phase.

RSI has climbed toward 58, reflecting strengthening buyer activity without entering overbought territory.

This positioning suggests that buying pressure has increased steadily rather than accelerating into exhaustion.

Earlier, RSI remained suppressed during the downtrend, which aligned with weakening ZEC price action.

Now, the shift toward neutral-bullish levels highlights improving sentiment among participants.

Source: TradingView

Sell-dominant CVD signals hidden pressure

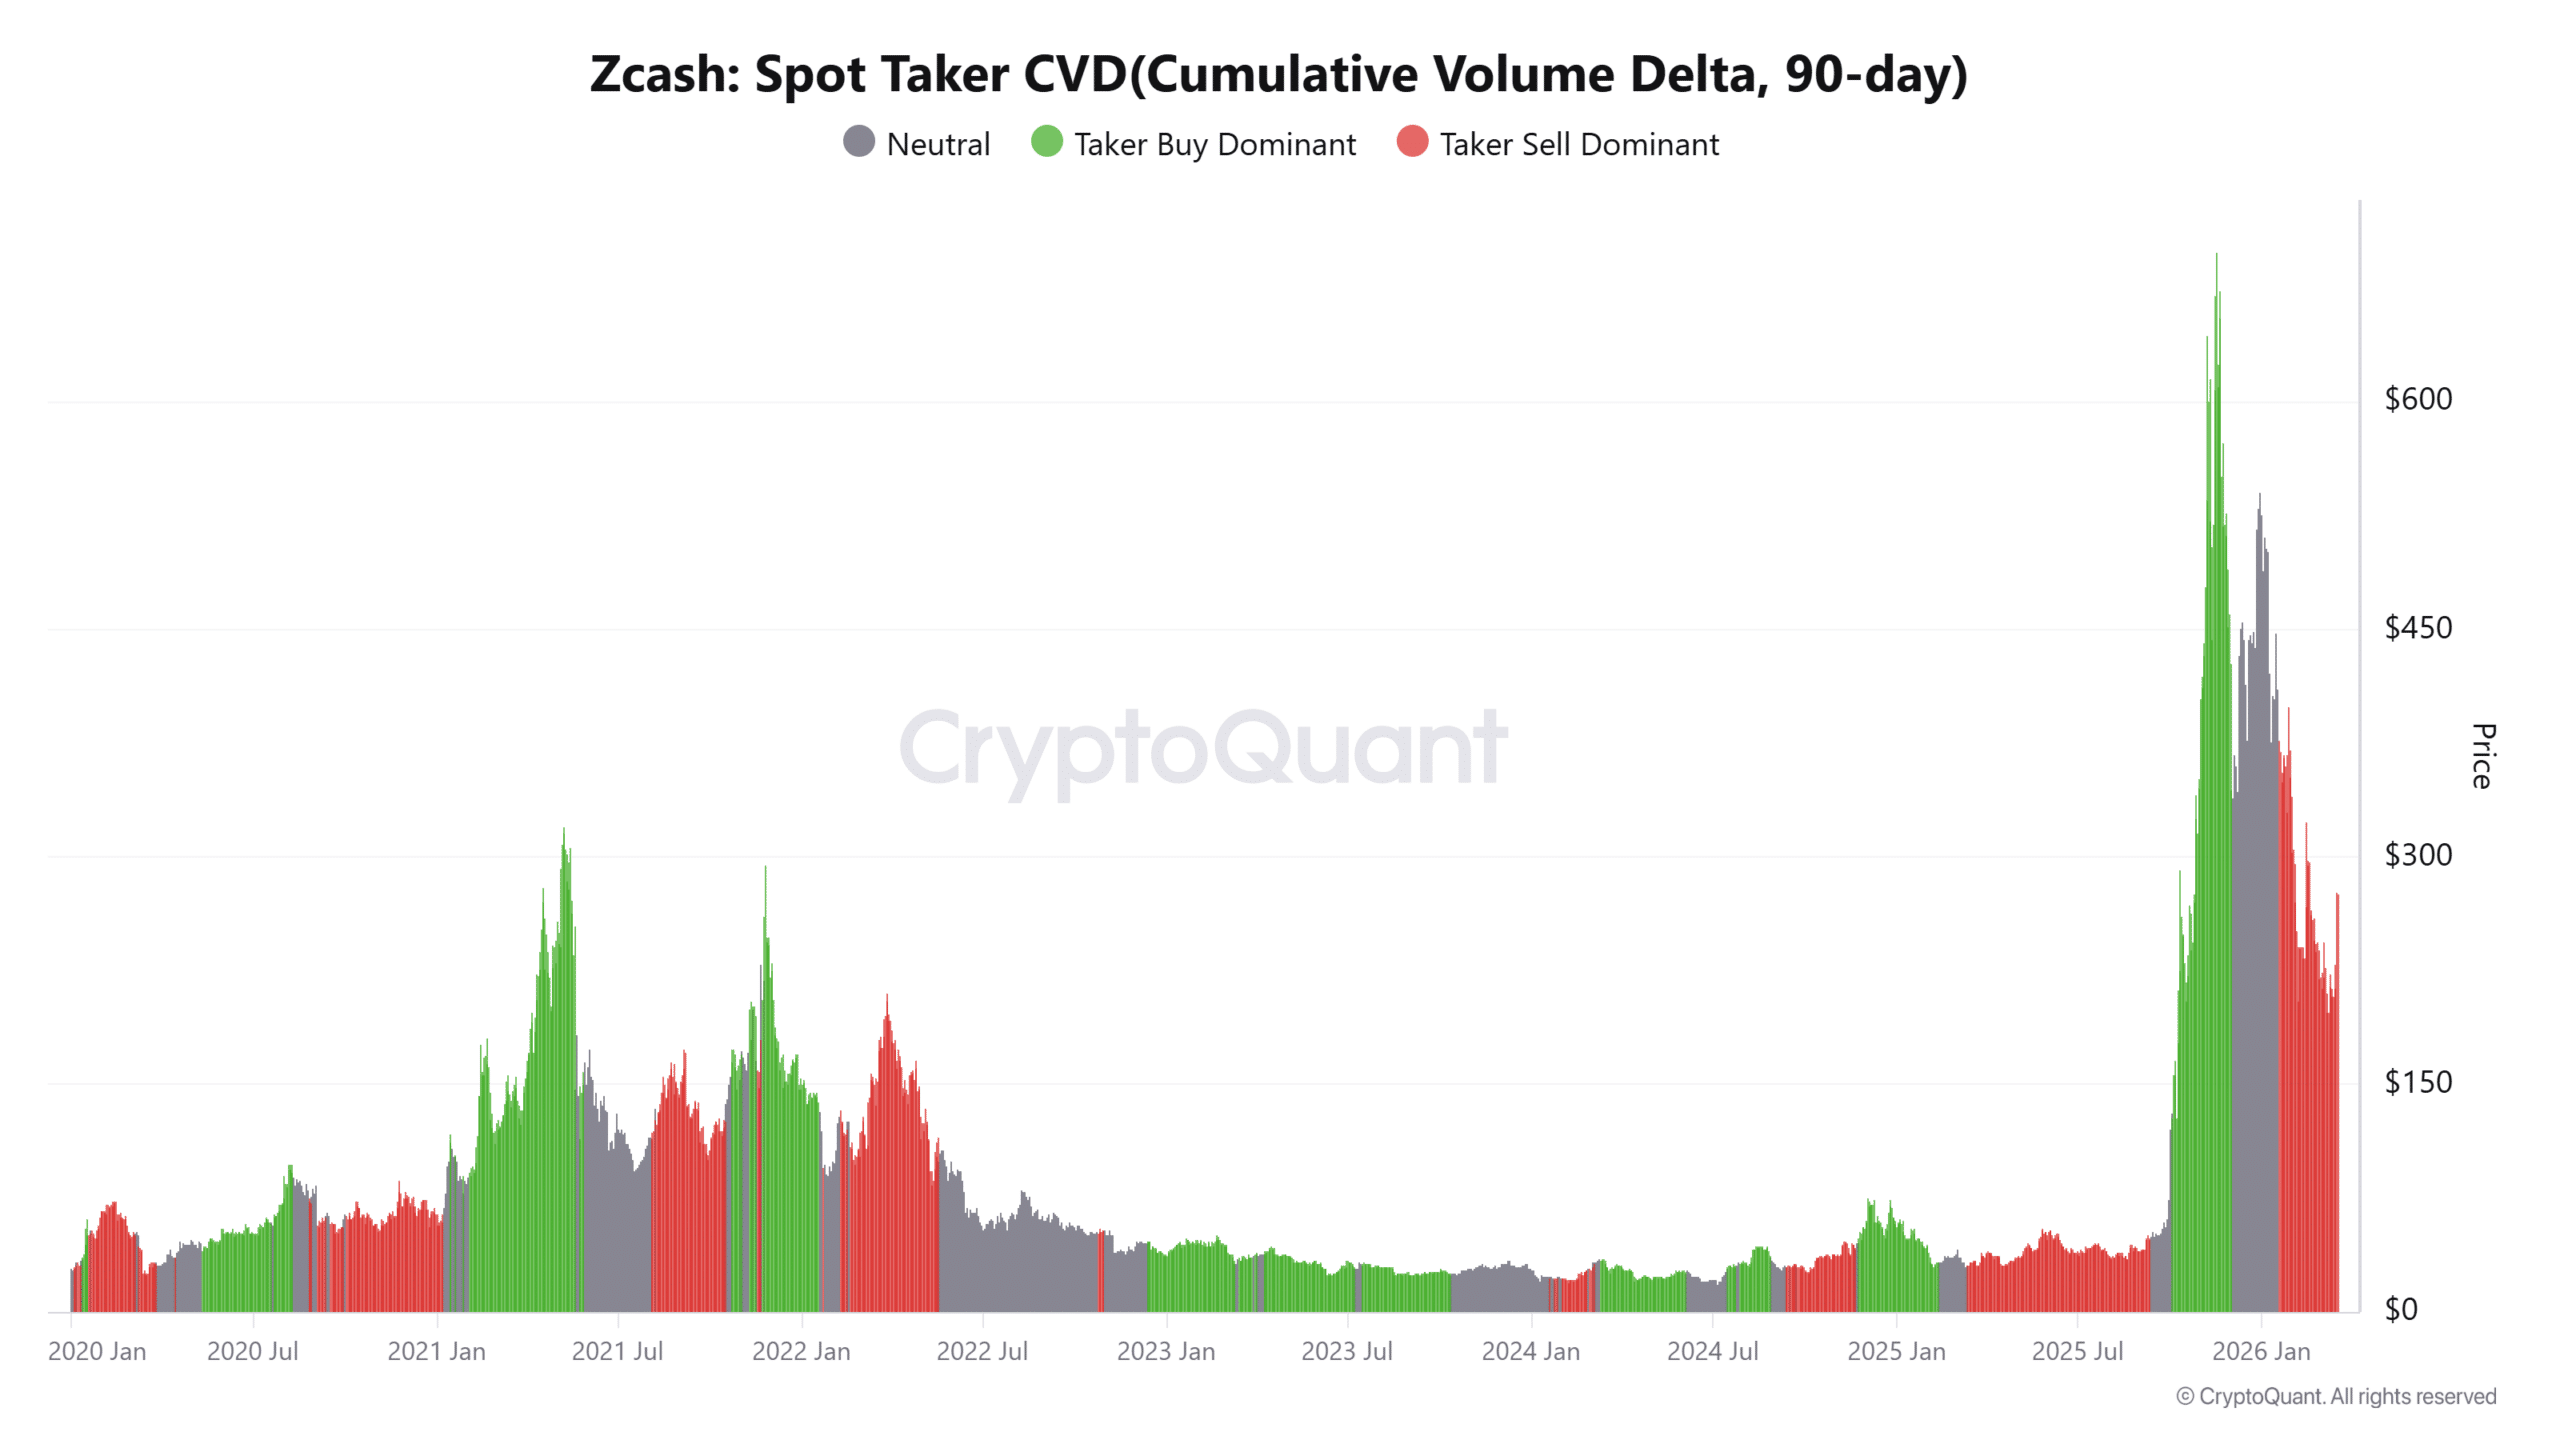
At the time of writing, Spot Taker CVD over the 90-day period remained sell-dominant, indicating that market sell orders have continued to outweigh buy orders despite the recent rally.

This divergence creates an important contrast between visible price strength and underlying order flow dynamics.

While price has moved upward, aggressive sellers have maintained influence in the broader structure.

However, such conditions can also reflect absorption, where buyers gradually take supply without immediate price collapse.

This dynamic suggests that the rally may not rely purely on organic demand.

Instead, it highlights a complex interaction between accumulation and distribution, which introduces uncertainty around the sustainability of the current move.

Negative funding reveals crowded short positioning on Zcash

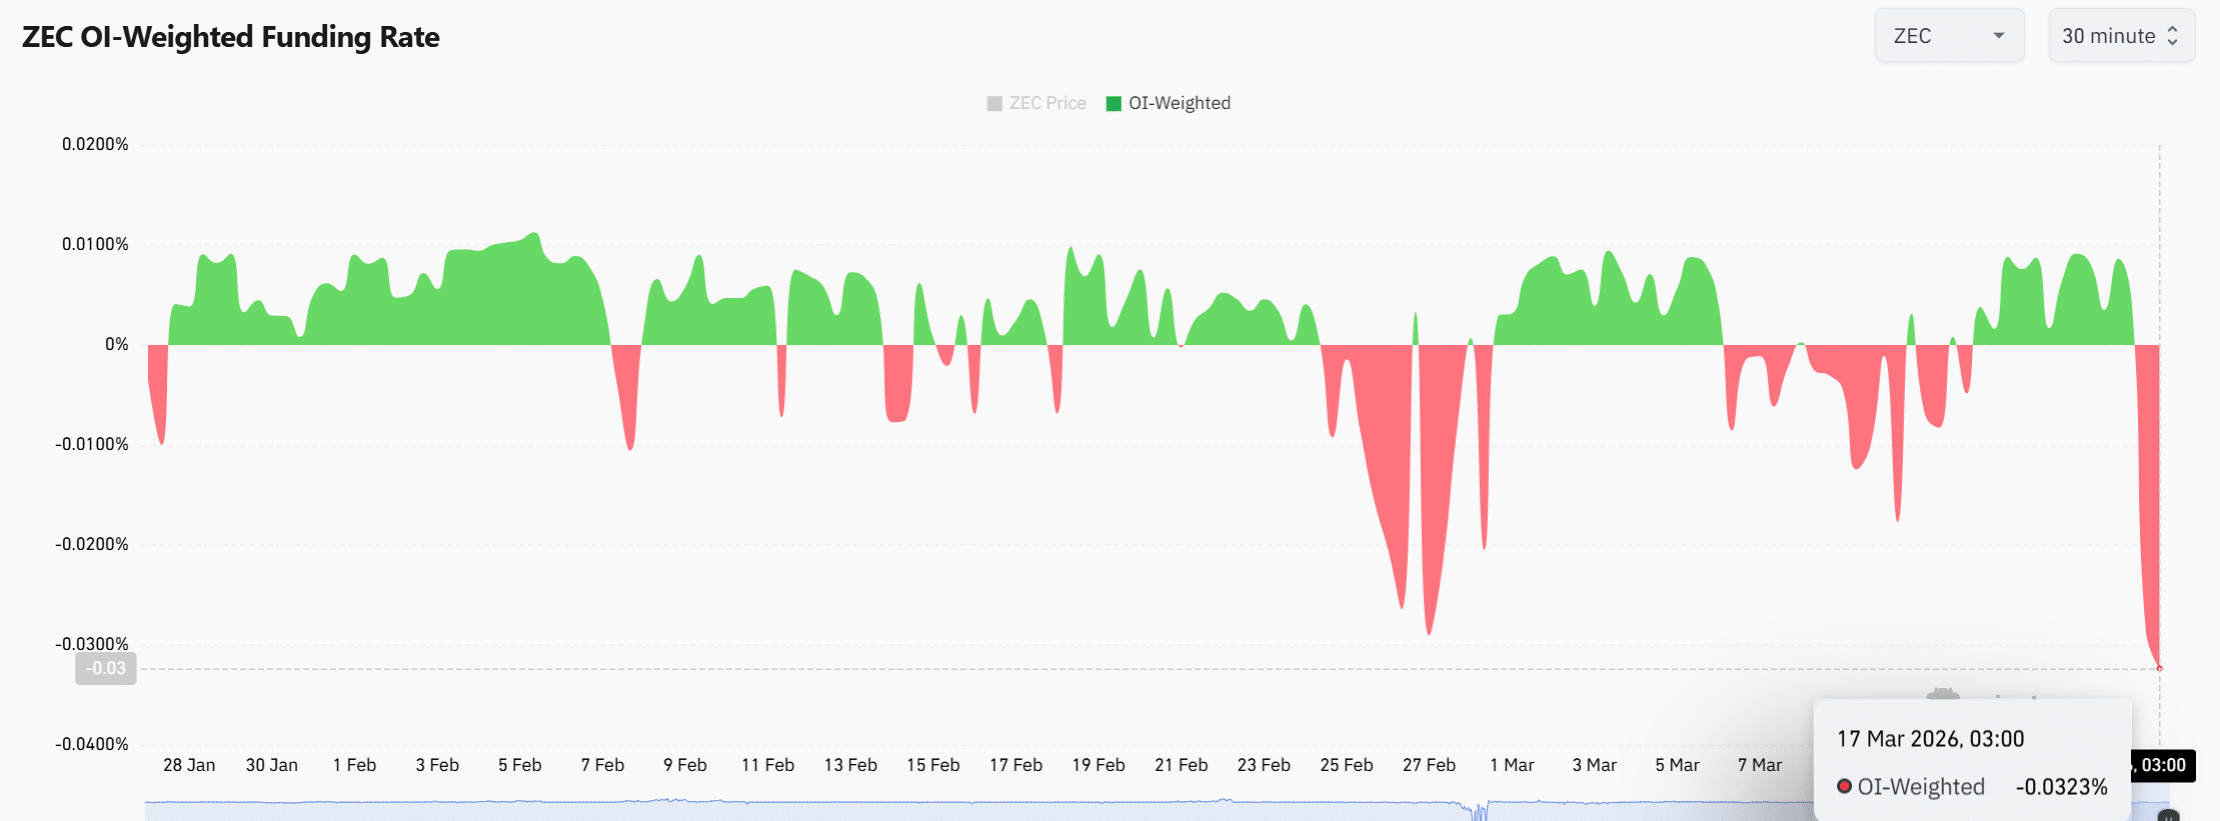
OI-Weighted Funding Rate has dropped to approximately -0.032%, signaling that short positions dominate the Derivatives market.

This shift reflects growing bearish positioning even as price trends upward in the short term. When funding turns deeply negative, it often indicates that traders expect downside continuation.

However, this imbalance can create conditions for sharp upside moves if shorts begin to unwind. As the price approaches the $300 resistance zone, this positioning becomes increasingly relevant.

A continued upward push could force short liquidations, amplifying volatility. Therefore, the derivatives landscape currently supports heightened price sensitivity around key resistance levels.

Source: CoinGlass

Zcash’s rally showed clear strength after breaking out of the descending wedge, supported by rising RSI and strong volume expansion.

However, persistent sell pressure in Spot Taker CVD and heavy short positioning introduces conflicting signals beneath the surface.

While short squeezes could extend upside moves, the $300 resistance remains a decisive barrier, meaning the rally would likely continue with volatility rather than a smooth trend.


Final Summary

  • Zcash showed an improving structure, but resistance pressure could still challenge continuation despite current breakout strength holding firm.
  • Short positioning imbalance may drive volatility higher, potentially extending gains while increasing risk of sharp reversals near resistance.

Пов'язані питання

QWhat was the percentage surge in Zcash's price and the increase in trading volume mentioned in the article?

AZcash surged over 20% in 24 hours, and its trading volume rose over 76%.

QFrom which key support level did ZEC price rebound, and what is the immediate resistance it is approaching?

AZEC rebounded from the $194.90 support level and is now approaching the $300 resistance zone.

QWhat does the negative OI-Weighted Funding Rate of approximately -0.032% indicate about market positioning?

AIt indicates that short positions dominate the derivatives market, reflecting growing bearish positioning among traders.

QWhat technical pattern did Zcash break out of, and what does this breakout signal?

AZcash broke out of a descending wedge pattern, which signals a shift in short-term structure toward bullish territory.

QAccording to the article, what two underlying metrics present mixed signals despite the price rally?

AThe Spot Taker CVD, which remains sell-dominant, and the negative funding rate, which indicates heavy short positioning, present mixed signals.

Пов'язані матеріали

Will the Next Crypto Bull Run Start with On-Chain Trading of SpaceX?

This article presents a scenario-based forecast for the crypto industry from 2026 to 2029, arguing that the next major cycle will be driven not by technological narratives but by legal access to real-world assets. The author predicts that by mid-2026, pre-IPO perpetual contracts for top private companies like SpaceX, OpenAI, and Anthropic on platforms like Hyperliquid will become the primary gateway for accessing quality assets, as most crypto-native tokens fail to capture real value. The much-hyped AI x Crypto intersection largely fails except for prediction markets, which thrive on betting on AI model supremacy. By 2027, public blockchain foundations are forced to choose between catering to retail speculation or building compliant infrastructure for institutions, with many opting for the latter. Growth in stablecoins and tokenized private credit/equity hits a "triple ceiling" due to regulatory and political uncertainty rather than market demand. The pivotal shift is forecast for 2028. A major liquidation event in pre-IPO perpetuals exposes the structural flaw of synthetic markets lacking a real underlying asset anchor. In response, regulatory changes finally allow the public solicitation of private securities resales to verified accredited investors. This creates a legitimate secondary market for real company equity, which then becomes the core asset class of the new bull market, relegating synthetic perps to a niche role. By 2029, the industry becomes "boring" but foundational. Tokens without claims on real cash flows or assets cease trading. Stablecoin growth is steady but politically capped. Crypto infrastructure fades from view as it gets absorbed into traditional finance backends. The article's central thesis is that the key bottleneck for crypto's next phase is legal and regulatory channels for real asset ownership, not technology.

marsbit1 год тому

Will the Next Crypto Bull Run Start with On-Chain Trading of SpaceX?

marsbit1 год тому

The Value Distribution of Stablecoins

**Summary: The Value Distribution of Stablecoins** The article argues that stablecoins are evolving from mere trading tools into broader channels for dollar access. It divides the stablecoin ecosystem into four layers to analyze how value is distributed: 1. **Issuance Layer:** Mints stablecoins, holds reserve assets, and captures the spread between reserve yield and user costs (e.g., Tether, Circle). This layer currently earns the largest profit margin. 2. **Infrastructure Layer:** Connects stablecoins to the traditional financial system, handling fiat on/off-ramps, banking integration, compliance (KYC/AML), and asset management (e.g., Bridge, BVNK). This is the "unglamorous" but critical work, building the essential bridges between crypto and real-world finance. 3. **Acquiring/Distribution Layer:** Integrates stablecoins into merchant systems, manages payment flows, and provides enterprise financial software (e.g., Stripe, Coinbase). They act as the access point for businesses. 4. **Application Layer:** The end-users and businesses that ultimately use stablecoins for payments, settlements, or as a store of value. They benefit from convenience but have little pricing power. The core thesis is that while the issuance layer currently dominates profits, the often-overlooked **infrastructure layer holds significant long-term potential**. The real challenge and barrier to mass adoption is not the on-chain transfer of stablecoins (which is simple), but the complex "last mile" integration into existing business workflows, banking systems, and regulatory frameworks across different countries. Companies in this layer are currently in a "land grab" phase, investing heavily to build networks, secure bank partnerships, and establish compliance pathways. While their position is currently pressured by the profitable issuers above and distribution platforms below, the article suggests that if stablecoins become a default financial rail for businesses, the infrastructure providers who have done the hard work of integration will ultimately gain strong pricing power and become entrenched, essential players.

marsbit7 год тому

The Value Distribution of Stablecoins

marsbit7 год тому

The Value Distribution of Stablecoins

The Value Distribution of Stablecoins The article argues that stablecoins are evolving from a mere trading tool into a broad "dollar channel." It analyzes the industry's value chain through four layers: 1. **Issuance Layer (e.g., Tether, Circle):** The top layer that mints stablecoins, holds reserve assets, and captures the thickest interest rate spread. 2. **Infrastructure Layer (e.g., Bridge, BVNK):** Connects stablecoins to the traditional financial system, handling critical but complex "dirty work" like fiat on/off-ramps, banking integration, compliance (KYC/AML), and cross-border settlement. 3. **Acquiring/Distribution Layer (e.g., Stripe, Coinbase):** Embeds stablecoins into merchant systems, manages payment flows, and integrates with enterprise software. 4. **Application Layer:** End-users and businesses that ultimately use stablecoins for payments, settlement, or storing value. The author posits that while the issuance layer currently captures the most profit, the most overlooked and potentially critical layer is infrastructure. The core challenge for stablecoin adoption isn't the on-chain transfer (which is simple), but bridging the gap between blockchain and the real-world financial system. This involves solving practical problems for businesses: fiat conversion, reconciliation, tax handling, and user onboarding. Infrastructure companies are currently in a difficult "land-grab" phase—building networks, securing banking relationships, and achieving compliance country-by-country. They face pressure from both the profitable issuance layer above and distribution platforms below. However, the author suggests this layer is building a crucial moat. Once stablecoins become a default business rail, the infrastructure players who have done the hard work of integration may gain significant, durable value and pricing power.

链捕手7 год тому

The Value Distribution of Stablecoins

链捕手7 год тому

Торгівля

Спот
Ф'ючерси

Популярні статті

Як купити ZEC

Ласкаво просимо до HTX.com! Ми зробили покупку Zcash (ZEC) простою та зручною. Дотримуйтесь нашої покрокової інструкції, щоб розпочати свою криптовалютну подорож.Крок 1: Створіть обліковий запис на HTXВикористовуйте свою електронну пошту або номер телефону, щоб зареєструвати обліковий запис на HTX безплатно. Пройдіть безпроблемну реєстрацію й отримайте доступ до всіх функцій.ЗареєструватисьКрок 2: Перейдіть до розділу Купити крипту і виберіть спосіб оплатиКредитна/дебетова картка: використовуйте вашу картку Visa або Mastercard, щоб миттєво купити Zcash (ZEC).Баланс: використовуйте кошти з балансу вашого рахунку HTX для безперешкодної торгівлі.Треті особи: ми додали популярні способи оплати, такі як Google Pay та Apple Pay, щоб підвищити зручність.P2P: Торгуйте безпосередньо з іншими користувачами на HTX.Позабіржова торгівля (OTC): ми пропонуємо індивідуальні послуги та конкурентні обмінні курси для трейдерів.Крок 3: Зберігайте свої Zcash (ZEC)Після придбання Zcash (ZEC) збережіть його у своєму обліковому записі на HTX. Крім того, ви можете відправити його в інше місце за допомогою блокчейн-переказу або використовувати його для торгівлі іншими криптовалютами.Крок 4: Торгівля Zcash (ZEC)Легко торгуйте Zcash (ZEC) на спотовому ринку HTX. Просто увійдіть до свого облікового запису, виберіть торгову пару, укладайте угоди та спостерігайте за ними в режимі реального часу. Ми пропонуємо зручний досвід як для початківців, так і для досвідчених трейдерів.

558 переглядів усьогоОпубліковано 2024.12.12Оновлено 2026.06.02

Як купити ZEC

Обговорення

Ласкаво просимо до спільноти HTX. Тут ви можете бути в курсі останніх подій розвитку платформи та отримати доступ до професійної ринкової інформації. Нижче представлені думки користувачів щодо ціни ZEC (ZEC).

活动图片