Why Do Memes Only Cut You? An Article That Explains Their True Growth Mechanism

比推Опубліковано о 2026-01-21Востаннє оновлено о 2026-01-21

Анотація

The article "Why Do Meme Coins Only 'Cut' You? Clarifying Their True Growth Mechanism" offers a fresh, analytical perspective on meme coin dynamics, framing their growth not as irrational speculation but as a mathematically explainable phenomenon. The core argument is that a meme coin’s market capitalization isn't just driven by price increases (Z-axis), but is fundamentally supported and "propped up" by two underlying factors: narrative density (X-axis) and the network of传播 nodes (Y-axis). Together, these form the base radius of a "Wealth Cone." A meme with only height (price) but no base (narrative and community) is like a thin needle—easily toppled. A strong, expanding base is necessary to support sustainable, exponential growth. The proposed XYZ three-dimensional growth spiral model explains the interaction: * **X-axis (Narrative Density):** The meme's core idea, cultural resonance, originality, and the richness of community-created content. * **Y-axis (Propagation Network):** The transmission pipelines, from major influencers (e.g., Elon Musk) to KOLs and finally to retail investors. * **Z-axis (Capital Flow):** The monetization of attention, measured by market cap, trading volume, and crucially, liquidity depth. The lifecycle of a successful meme is a reflexive, spiral ascent through stages: **Ignition** (a Y-axis spike from a KOL callout lifts the Z-axis), **Spin** (price growth attracts more discussion, enriching the narrative), and **Ascension** (an expande...

Author: danny

Original Title:

Why Do the Memes You Buy Only Fall? — Deconstructing the Growth Spiral and Volume of Memes Using First Principles


In the eyes of most people, Meme coins are irrational狂欢, a fool's赌场. But from a mathematical perspective, the birth of every ten-thousand-fold myth is not accidental; it is actually a middle school spatial geometry evolution word problem.

This article proposes a颠覆性的 perspective: The market value of Meme coins is not "grown" but "propped up." The value of Memes can be calculated!

We are accustomed to focusing on the fluctuations of the Z-axis (price height), but we overlook that what determines life and death is the base radius constructed by the X (narrative density) and Y (propagation nodes) axes. A Meme with only height and no base is just a very thin "needle" that topples with the wind; only by continuously expanding the consensus radius can it support a stable, geometrically growing wealth cone under the gravity of capital.

Note: This article is a popular science article on "financial physics," not a rigorous econometric paper, and is only intended to provide a new perspective for viewing Memes.

1. The Beginning of the Theory: The Three-Dimensional Coordinate System of Memes

In the current cryptocurrency market, Meme coins are often seen as irrational狂欢. But is that really the case?

If we strip away the noise of emotions, KOL shilling, and community bandwagoning, we will find that the birth and death of every phenomenal Meme follows a strict mathematical logic.

The essence of Meme coins is the tokenization of the attention economy. Their market value is not determined by traditional discounted cash flow (DCF) but is jointly constructed by the breadth of the narrative, community resonance, and the explosive power of funds.

For better discussion, we define these factors as the XYZ three-dimensional growth spiral model.

These three axes are not just independent variables; there is a strong reflexivity between them—that is, a change in one variable reinforces another, forming a positive feedback loop.

Let's explain these parameters:

X-axis: Narrative Density and Cultural Memes

Definition: The "genes" of a Meme. Includes the core梗 (e.g., Doge), origin story (e.g., CZ's pet name), cultural symbols (e.g., Pepe the Frog), and the richness of community二次创作.

Key metrics: Narrative originality, replicability, emotional resonance.

Y-axis: Propagation Potential and Node Network

Definition: The transmission pipeline of information. From top-tier nodes (CZ, Elon Musk) to secondary nodes (Alpha Callers, KOLs), and then to end nodes (ordinary retail investors).

Key metrics: Node weight, propagation coverage, shilling frequency.

Z-axis: Fund Flow and Liquidity Carrier

Definition: The monetization result of attention. Includes on-chain fund inflows, liquidity depth—i.e., the沉淀的价值 or the total amount of sell orders that can be承接.

Key metrics: Market capitalization, trading volume, turnover rate, and liquidity (the most important metric).

2. Diagram of the Growth Curve of XYZ Axis Interaction

If we plot these three axes in three-dimensional space, the growth trajectory of a successful Meme will generally show a spiral upward trend: (as shown in the figure below)
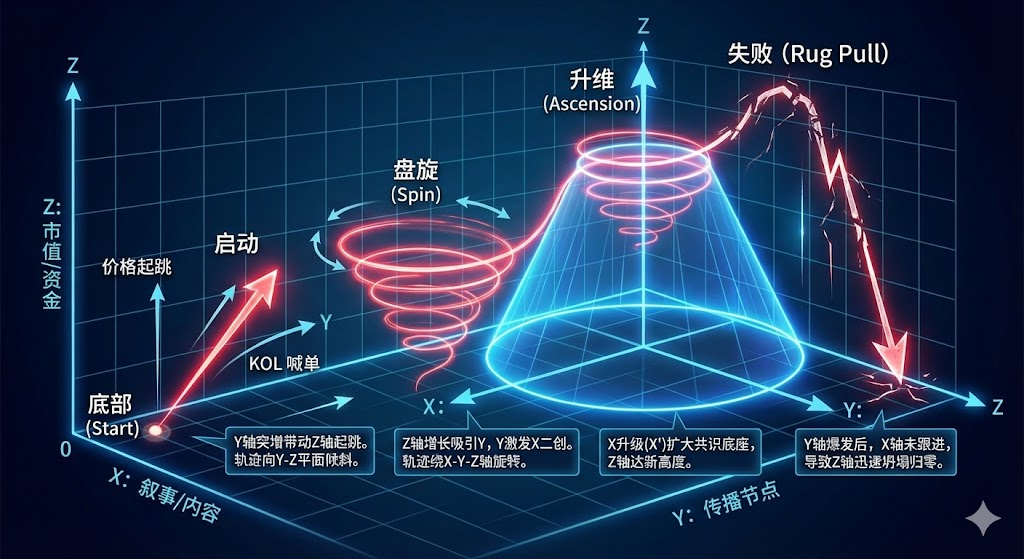
Bottom (Start): X, Y, Z are all close to zero.

Ignition: The Y-axis surges (KOL shilling), driving the Z-axis (price) to jump. The trajectory line tilts toward the Y-Z plane.

Spin: The growth of the Z-axis attracts more Y (more people discussing), and Y stimulates X's二次创作 (enriching content). The trajectory line begins to rotate around the X-Y-Z axes.

Ascension: As X is upgraded (X'), the base area of the cone expands (broader consensus range), and the Z-axis (market capitalization) reaches a new height.

Failed Meme (Rug Pull): Usually表现为 the Y-axis爆发后, the Z-axis briefly rises, but the X-axis fails to follow up with an upgrade (narrative scarcity), causing the Z-axis to quickly collapse to zero. The trajectory line shows an inverted V-shaped fall.

3. Evolution of the Growth Curve: The Spiral Ascension of Four Stages

From the previous section, we know that the lifecycle of a Meme is not linear but a vortex that continuously expands around the Z-axis (fund flow). In this section, we will analyze it based on the four development stages of Memes.

The figure below shows its standard evolution path: (I was also shocked at how cool AI drew it?!)


Original link:https://www.bitpush.news/articles/7604686

Пов'язані питання

QWhat is the core perspective proposed in the article regarding the growth of Meme coins?

AThe article proposes that Meme coin market capitalization is not simply 'rising' but is 'propped up' by a mathematical model involving narrative density (X-axis) and propagation nodes (Y-axis), which together form the base supporting the value (Z-axis).

QHow does the article define the X-axis in its Meme growth model?

AThe X-axis is defined as 'Narrative Density and Cultural Memes,' which includes the core meme, origin story, cultural symbols, and the richness of community-created content.

QAccording to the article, what is the role of the Y-axis in the Meme coin growth spiral?

AThe Y-axis represents 'Propagation Potential and Node Network,' which refers to the information transmission pipelines, from top nodes like influencers to secondary and end nodes like ordinary retail investors.

QWhat does the Z-axis represent in the XYZ model for Meme coins?

AThe Z-axis represents 'Capital Flow and Liquidity Carrier,' which is the monetization result of attention, including on-chain capital inflow, liquidity depth, and the total value that can absorb selling pressure.

QWhat is the key difference between a successful Meme and a failed one (Rug Pull) according to the model?

AA successful Meme undergoes a spiral ascent where narrative (X) and propagation (Y) expand to support the value (Z). A failed Meme (Rug Pull) sees a brief spike in Y and Z, but a lack of narrative development (X) causes the value to collapse back to zero.

Пов'язані матеріали

Platform Token Soars 15x in Half a Month, Pons Tops Robinhood Chain Charts for Both Token Launches and Trading

In just half a month, the Pons platform token (PONS) surged over 15x in value as Pons solidified its position as the leading token launch and trading platform on Robinhood Chain, capturing both the highest daily token creation volume and transaction volume. Following the exit of previous leader NOXA, competition initially favored Flap before Pons emerged dominant around mid-July. By July 26th, Pons accounted for 77.1% of total trading volume across all Robinhood Chain launchpads. Pons's success is attributed to its streamlined, one-transaction process for deploying a token contract and its corresponding Uniswap V3 liquidity pool simultaneously, eliminating the need for bonding curves or complex migrations. This simplicity, combined with low creation costs and immediate tradability, attracted significant creation activity and speculative trading. The meteoric rise of its native token, PONS, further fueled platform growth. A tokenomics model directing 80% of protocol fees to buy back and burn PONS created a reinforcing cycle: platform usage boosted PONS value, which in turn attracted more users. Looking ahead, Pons V2 aims to expand beyond meme tokens by integrating support for paying fees in stablecoins (USDG) and RWA assets, aligning with Robinhood Chain's broader focus on on-chain finance and stock tokens.

Odaily星球日报1 год тому

Platform Token Soars 15x in Half a Month, Pons Tops Robinhood Chain Charts for Both Token Launches and Trading

Odaily星球日报1 год тому

Qualcomm Chip Price Hike Deals a Blow to Android Phones

Qualcomm has officially announced a new round of price increases for its entire chip portfolio, effective September 1. The hikes, reaching up to 18% for the flagship Snapdragon 8 Elite Gen 6 Pro, follow similar moves by MediaTek, intensifying cost pressures on the already strained smartphone industry. CEO Cristiano Amon confirmed the plan, citing the need to offset rising industry-wide costs and restore declining profit margins. Qualcomm's Q3 FY2026 results showed a 25% drop in net profit, with mobile revenue plunging 20% year-over-year, hitting its lowest level since 2021. The surge in AI computing demand has led memory manufacturers to prioritize HBM production, creating a shortage in general-purpose DRAM and NAND Flash chips. Their prices soared by 93%-98% and 55%-60% respectively in Q1 2026, causing the memory cost share in smartphones to jump from 10%-15% to over 30%. Coupled with the soaring cost of advanced nodes like TSMC's 2nm and packaging, overall chip costs have reached historic highs. These upstream pressures are forcing downstream smartphone brands like Xiaomi, OPPO, and vivo to cut orders for mid-to-low-end models by up to 20% and use cost-saving measures like older chipsets. Reportedly, the Snapdragon 8E5 will be repurposed as a "long-lasting" chip for sub-brand phones in H2 2026. Amid this cost crisis, the Android market remains sluggish. Q2 2026 smartphone shipments in China fell 4.3% year-over-year, marking five consecutive quarters of decline. Major Android brands saw market share drop, while Huawei and Apple, with their in-house chip advantages, gained share. Qualcomm is diversifying into automotive and IoT sectors to reduce reliance on smartphones, but these new segments cannot yet fill the mobile revenue gap. Industry observers warn that the full impact of component cost hikes will hit in the second half of 2026, likely leading to higher-than-expected price increases for Android flagships and a further contraction in the Chinese smartphone market.

marsbit1 год тому

Qualcomm Chip Price Hike Deals a Blow to Android Phones

marsbit1 год тому

Торгівля

Спот
活动图片