What Does Ethena's Trend Reveal About the Cryptocurrency Market?

marsbitОпубліковано о 2026-03-09Востаннє оновлено о 2026-03-09

Анотація

The article analyzes the perpetual futures market structure and risk sentiment in the cryptocurrency market using Ethena's transparency dashboard as a key indicator. It reveals that Ethena's deployed capital has dropped to $791 million, only 71% of its 2025 low and 12.9% of its peak, reflecting extremely low net long demand in the market. A key insight is that directional long positions are nearly equal to directional short positions—a rare and historically unsustainable balance in crypto. The analysis breaks down perpetual contract holders into four categories: directional longs, directional shorts (including hedgers), basis traders (like Ethena), and arbitrageurs. Ethena’s role as a basis trader provides a proxy for excess long demand. The sharp decline in its deployed capital—over 60% since February 2026—suggests either the unwinding of unprofitable basis trades, increased hedging activity from directional shorts, or weak leveraged long demand. Current negative funding rates and stable open interest indicate growing short or hedge demand, possibly from VC firms and crypto companies managing risk in a bearish market. This equilibrium between longs and shorts is unusual and may signal a market regime change, though it remains uncertain whether this balance can persist.

Article Author: Kyle Soska

Article Translation: Block unicorn

The cryptocurrency market has been in a risk-off state for several consecutive months, and I have been carefully studying various market data, looking for signs of a potential market turnaround. In this article, I will delve into the market structure of perpetual futures and, combined with data from the Ethena transparency dashboard, analyze market risk appetite.

In short: Ethena's deployed capital is at a multi-year low, only 71% of the 2025 low. This is not a criticism of Ethena, but rather a reflection of the current market conditions. Directional short positions are almost on par with directional long positions, an extremely rare and historically unsustainable balance in the cryptocurrency space.

The cryptocurrency market has long been characterized by the extreme volatility of its assets and the heavy use of leverage by traders. My previous research, "Understanding Cryptocurrency Derivatives: The BitMEX Case Study," explored the novel 100x perpetual contracts offered on BitMEX.

Since the BitMEX era, cryptocurrency futures have become the highest-volume product in the cryptocurrency market, with trading volumes 5 to 20 times that of the spot market. As a center for leveraged trading for retail investors, perpetual contracts can reflect the risk appetite of the cryptocurrency market and are therefore worthy of our attention.

Ethena provides us with an extremely unique perspective, allowing us to gain deep insights into the cryptocurrency derivatives market. As shown in the figure below, Ethena implements a cryptocurrency arbitrage trade. The strategy is simple: when cryptocurrency traders go long, Ethena acts as their counterparty and goes short. Ethena ensures it buys exactly the same amount of assets as the traders are shorting. In a sense, Ethena provides a leverage service. Traders want to profit from rising cryptocurrency prices but lack capital; while Ethena has capital but limited risk tolerance. Therefore, traders use perpetual contracts to borrow funds from Ethena at the basis plus the funding cost of the perpetual contract.

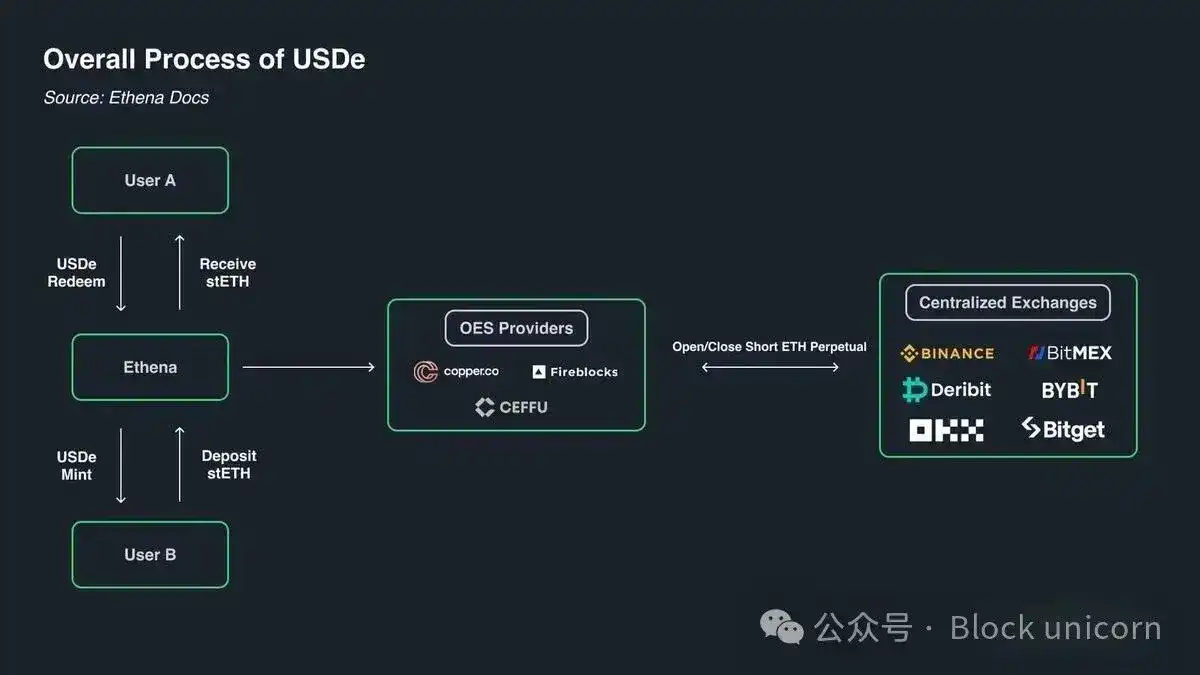
(Chart: Ethena Mechanism Illustration)

By construction, each long contract corresponds to a short contract in a 1:1 ratio. Each open interest in perpetual contracts represents a cash flow agreement between two parties. The exchange's role is to facilitate the matching of these contracts, ensuring that each contract always has a sufficiently funded long and short holder. The table below shows the four possible outcomes facilitated by the exchange.

Perpetual Contract Matching Matrix

Every trade has a buyer and a seller. When both the buyer and seller of a contract are long or both are short, the exchange merely transfers ownership of the contract from one party to the other. This transfer does not create or destroy any contracts. When the buyer is long and the seller is short, a new contract must be created, with the buyer taking the long position and the seller taking the short position, increasing the open interest by 1 contract. On the other hand, if the seller is long and the buyer is short, the exchange can directly unwind the contracts of the buyer and seller and delete the newly released contract, decreasing the open interest by 1 contract.

So, who are the actual holders of these contracts in a typical market? I believe contract holders can be broadly categorized into four types:

  • [Long] Directional Longs

  • [Short] Directional Shorts / Hedgers

    • a. Direct Asset Shorts / Hedges

    • b. Structured Product Hedges

  • [Short] Basis Traders (e.g., Ethena, etc.)

  • [Hybrid] Perpetual Arbitrageurs

Directional Longs seek exposure. They are risk-takers, and their demand for risk depends on their level of risk appetite.

Directional Shorts include both investors who wish to take on the downside risk of an asset and investors who wish to hedge their assets in a tax-efficient manner. Venture capital firms and company employees compensated with tokens often wish to hedge tokens that vest at current prices. For altcoins, many markets are too small for effective direct hedging, or may not even exist. In such cases, companies like Cumberland, Wintermute, FalconX, Flowdesk, and Amber can construct dynamically managed synthetic positions, using short sales of Bitcoin and Ethereum and other highly correlated assets to hedge exposure to less liquid markets (e.g., Monad). Projects like Neutrl also employ this strategy, offering such hedging as a yield strategy.

Basis Traders are opportunistic shorts. They are not interested in directional risk but actively fill the excess demand from directional longs when market supply and demand are imbalanced. Under most market mechanisms, long demand exceeds short demand, and the basis traders' role is to bridge the gap. Their position sizes are usually highly elastic.

Perpetual Arbitrageurs hold both long and short positions in perpetual contracts simultaneously. Their role is to connect different perpetual contracts and correct any minor price discrepancies, at a cost not exceeding transaction fees. Their long positions perfectly match their short positions at any given moment.

By construction, all perpetual contracts are in a 1:1 ratio, with long positions perfectly matched by short positions, so we know:

Directional Longs + Arbitrage Longs = Directional Shorts + Basis Shorts + Arbitrage Shorts

Furthermore, the structure of perpetual arbitrage tells us:

Arbitrage Longs = Arbitrage Shorts

Canceling this term from the first equation yields:

Directional Longs = Directional Shorts + Basis Shorts

Ethena provides us with a proxy for all basis shorts, which helps us gain insight into the difference between directional longs and shorts.

The chart below is Ethena's self-reported balance sheet, divided into cash and deployed capital, for the period from December 27, 2024, to March 7, 2026:

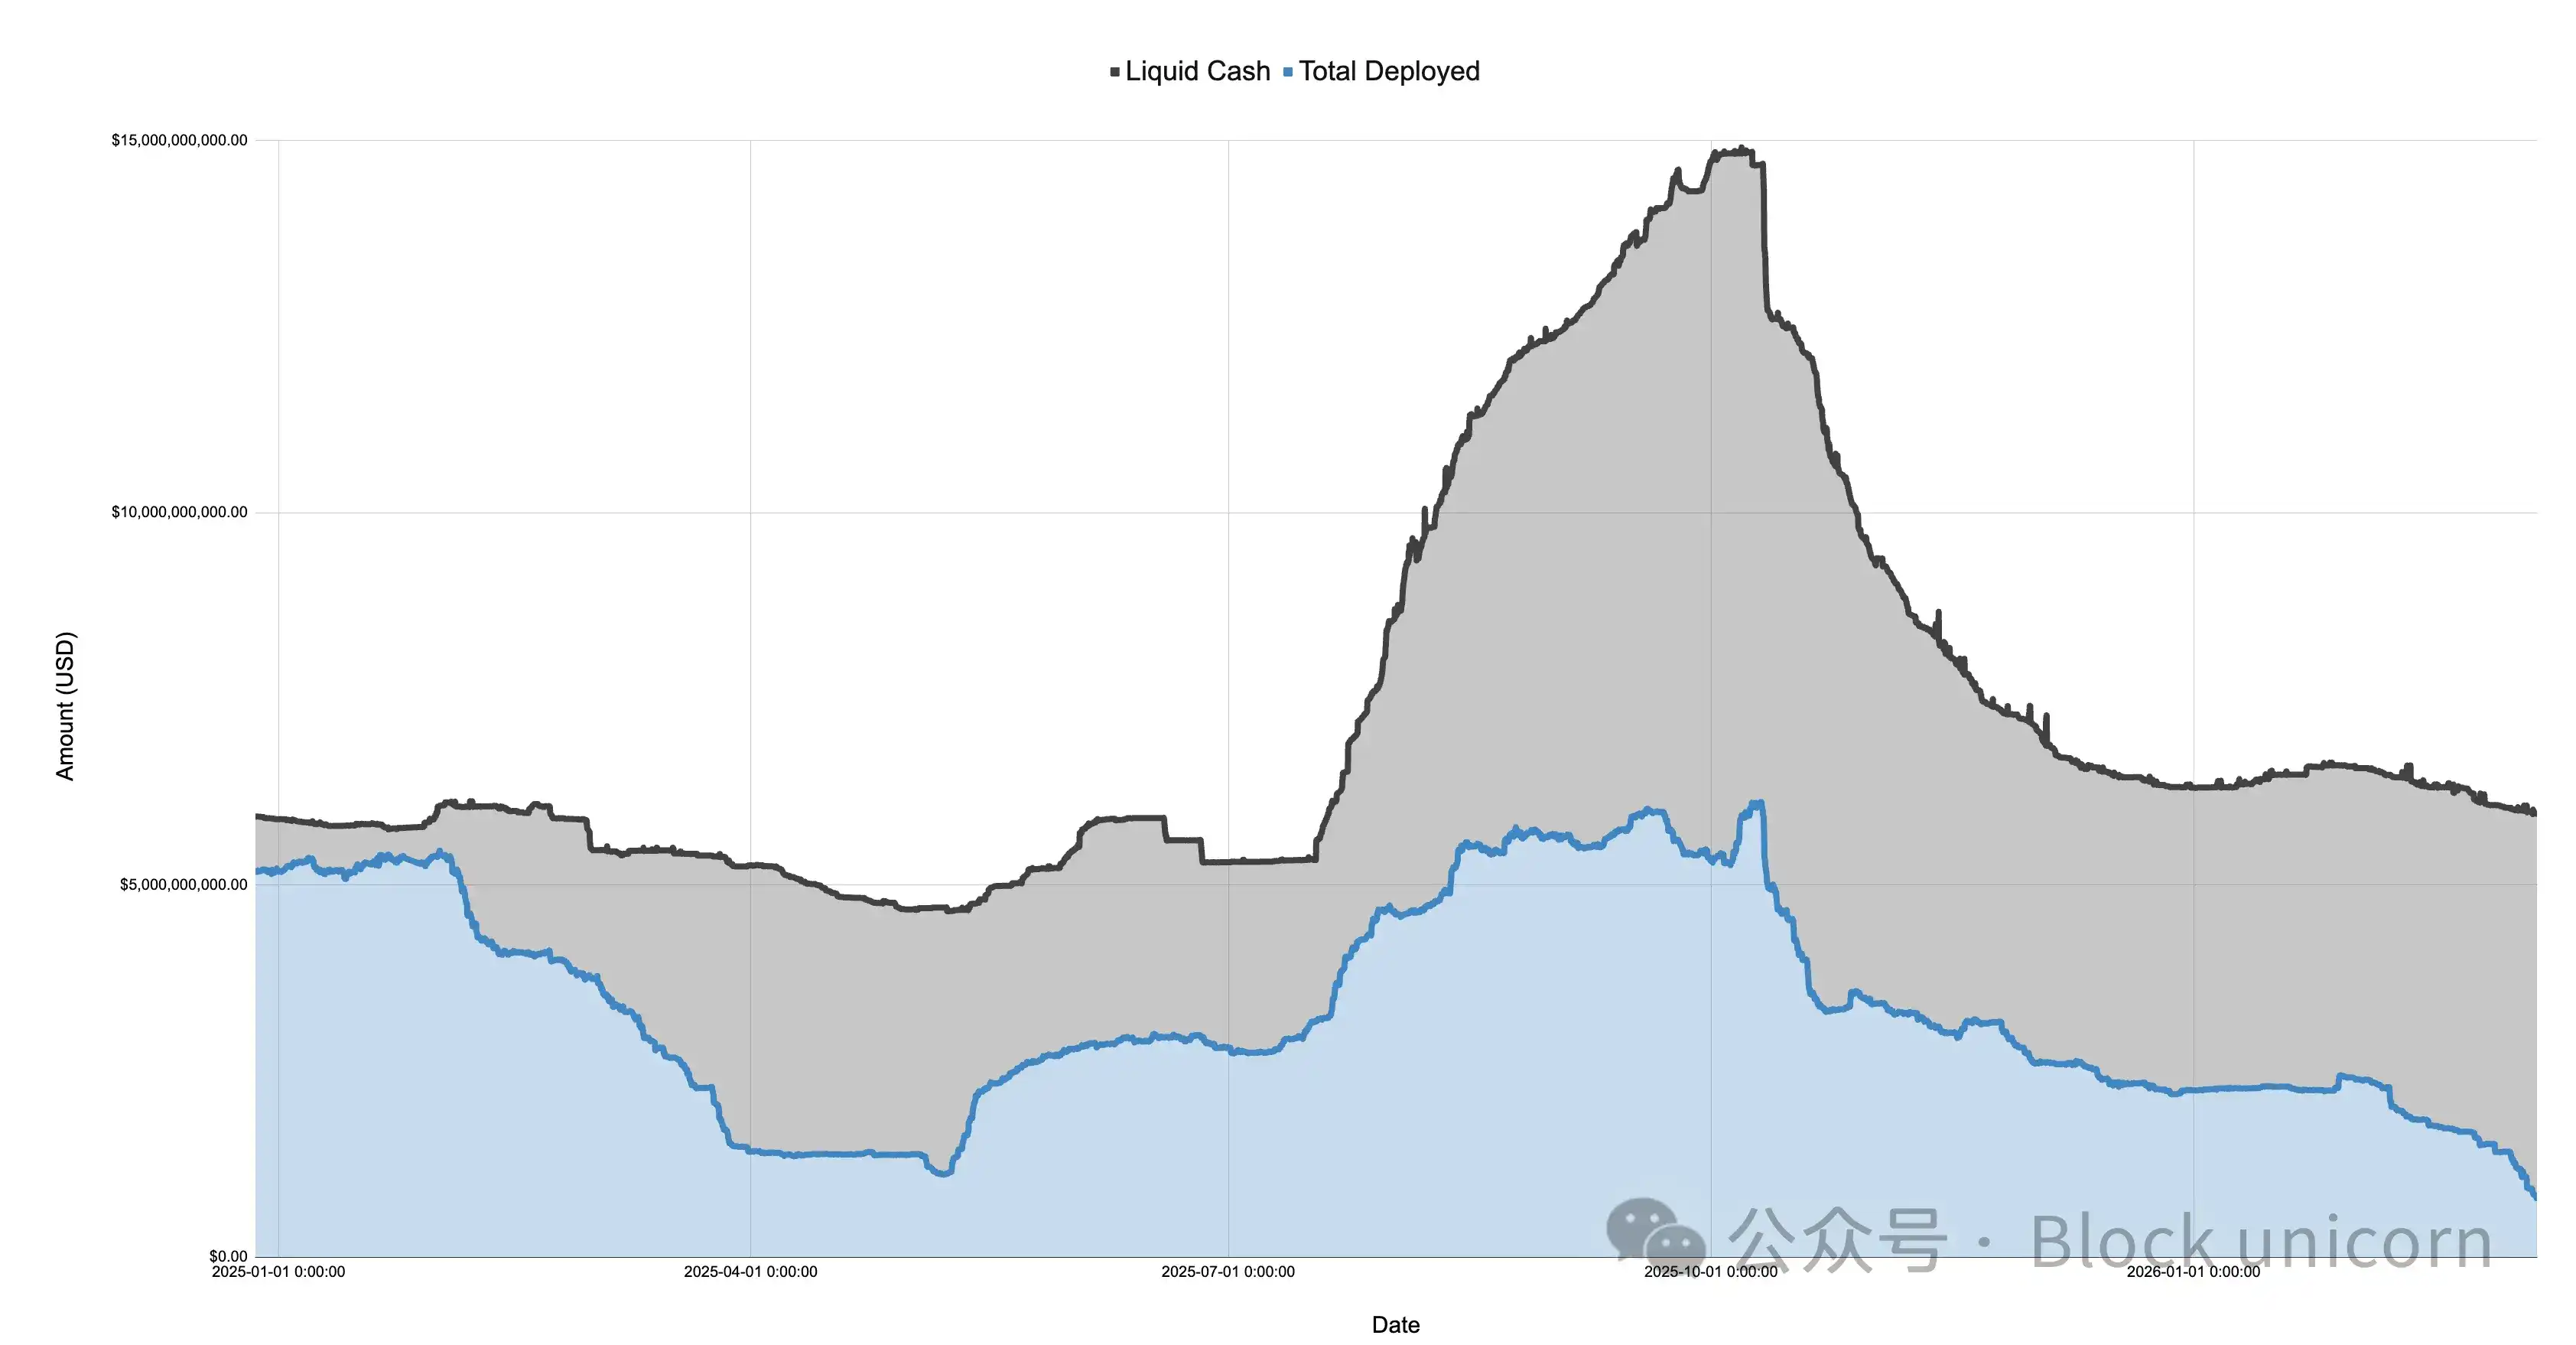
(Chart: Ethena Balance Sheet 2024-2026)

The market turned sharply risk-off in January 2025 after the launch of the $TRUMP token, followed by a continued decline during the initial tariff discussions and the "Liberation Day" in April. During this period, Ethena's deployed capital plummeted from over $5 billion to around $1.108 billion, a drop of more than 75%.

It is important to note that Ethena's deployed capital can serve as a reference for the degree of excess long demand in the market. Although Ethena is not the only institution conducting such trades, its size is substantial (sometimes around 25% of Binance and Bybit), and as long as it has ample cash, it will expand its positions to meet any unmet long demand. This suggests that while total long demand may not have fallen by 75% by April 2025, the excess demand not met by directional short covering did indeed fall by 75%.

The chart below shows the deployment of Ethena's balance sheet relative to its total size, the 2025 minimum, and maximum values.

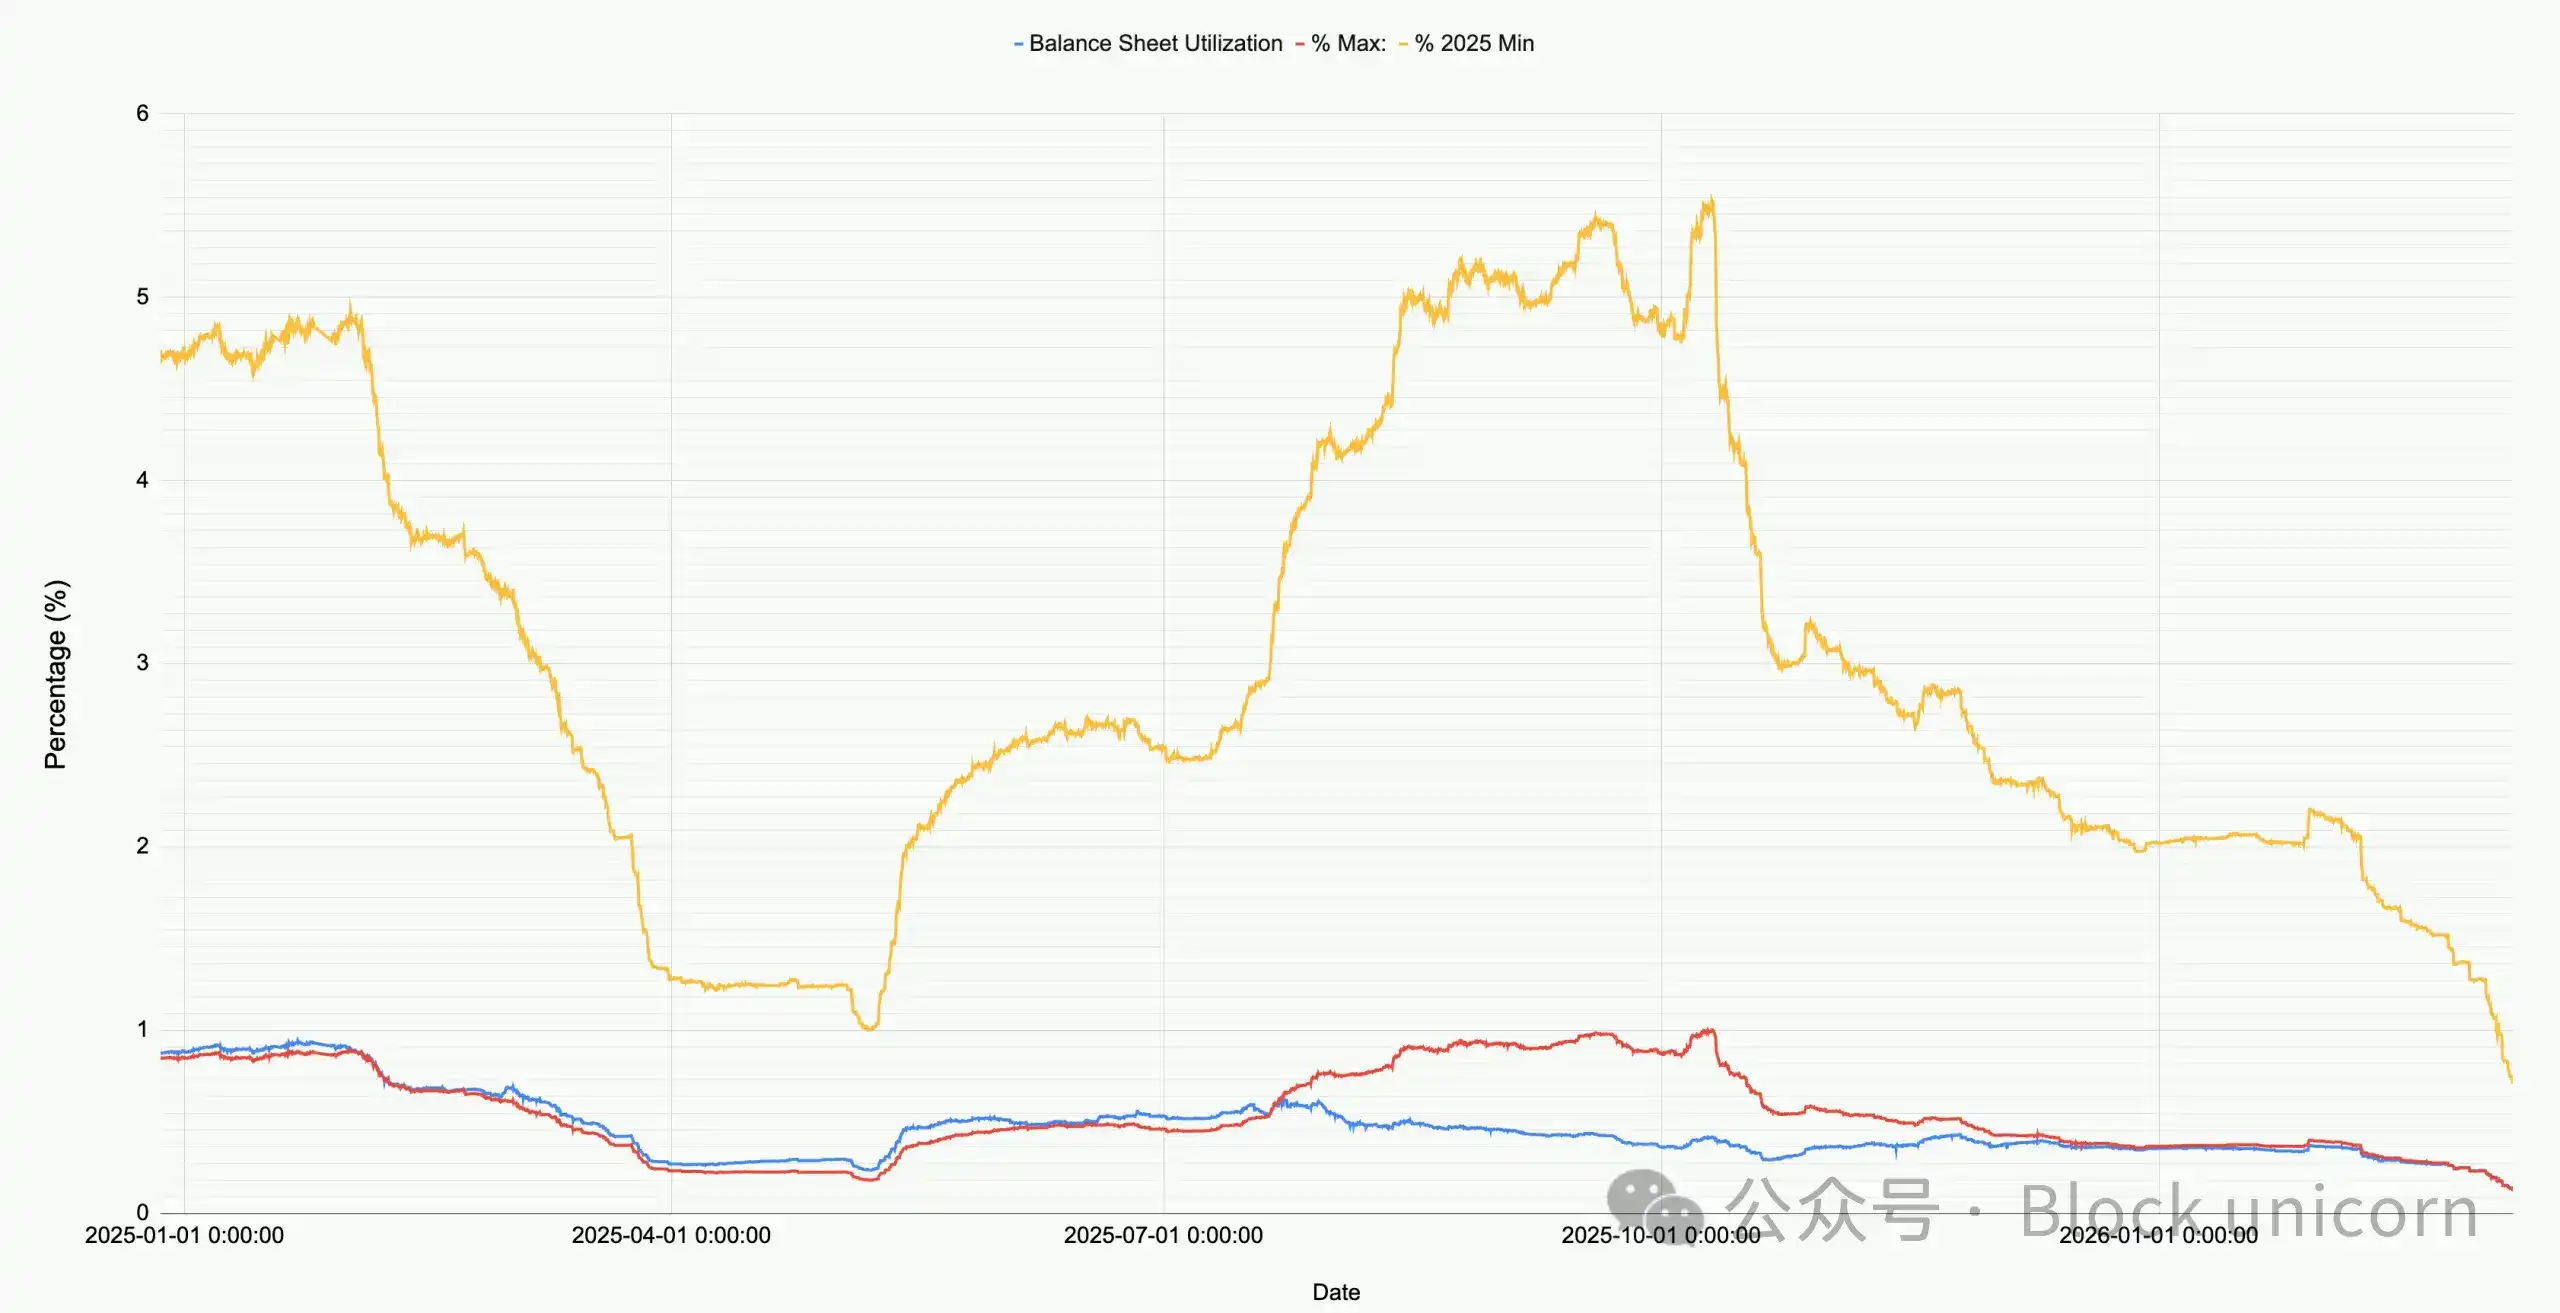
<极i data-index-in-node="0" data-path-to-node="29" style="font-size: inherit; font-family: PingFang SC,Helvetica Neue,Helvetica,Arial,Hiragino Sans GB,Heiti SC,Microsoft YaHei,WenQuanYi Micro Hei,sans-serif;">(Chart: Ethena Deployment Comparison)

Observing the current market, the total capital deployed by Ethena across all markets (BTC, ETH, SOL, BNB, XRP, HYPE) is only about $791 million. This is only 71% of the 2025 minimum and a mere 12.9% of the peak value before October 10th. This figure is not a criticism of Ethena but reflects the current market conditions: net long demand is at a historically low level.

It is particularly noteworthy that during the market crash where Bitcoin price plummeted to $60,000, Ethena deployed over $2 billion in capital. Since just a month ago, on February 8, 2026, Ethena's deployed capital has astonishingly decreased by 60%!

The chart below zooms in on Ethena's deployed capital and the price trend of Bitcoin since January this year.

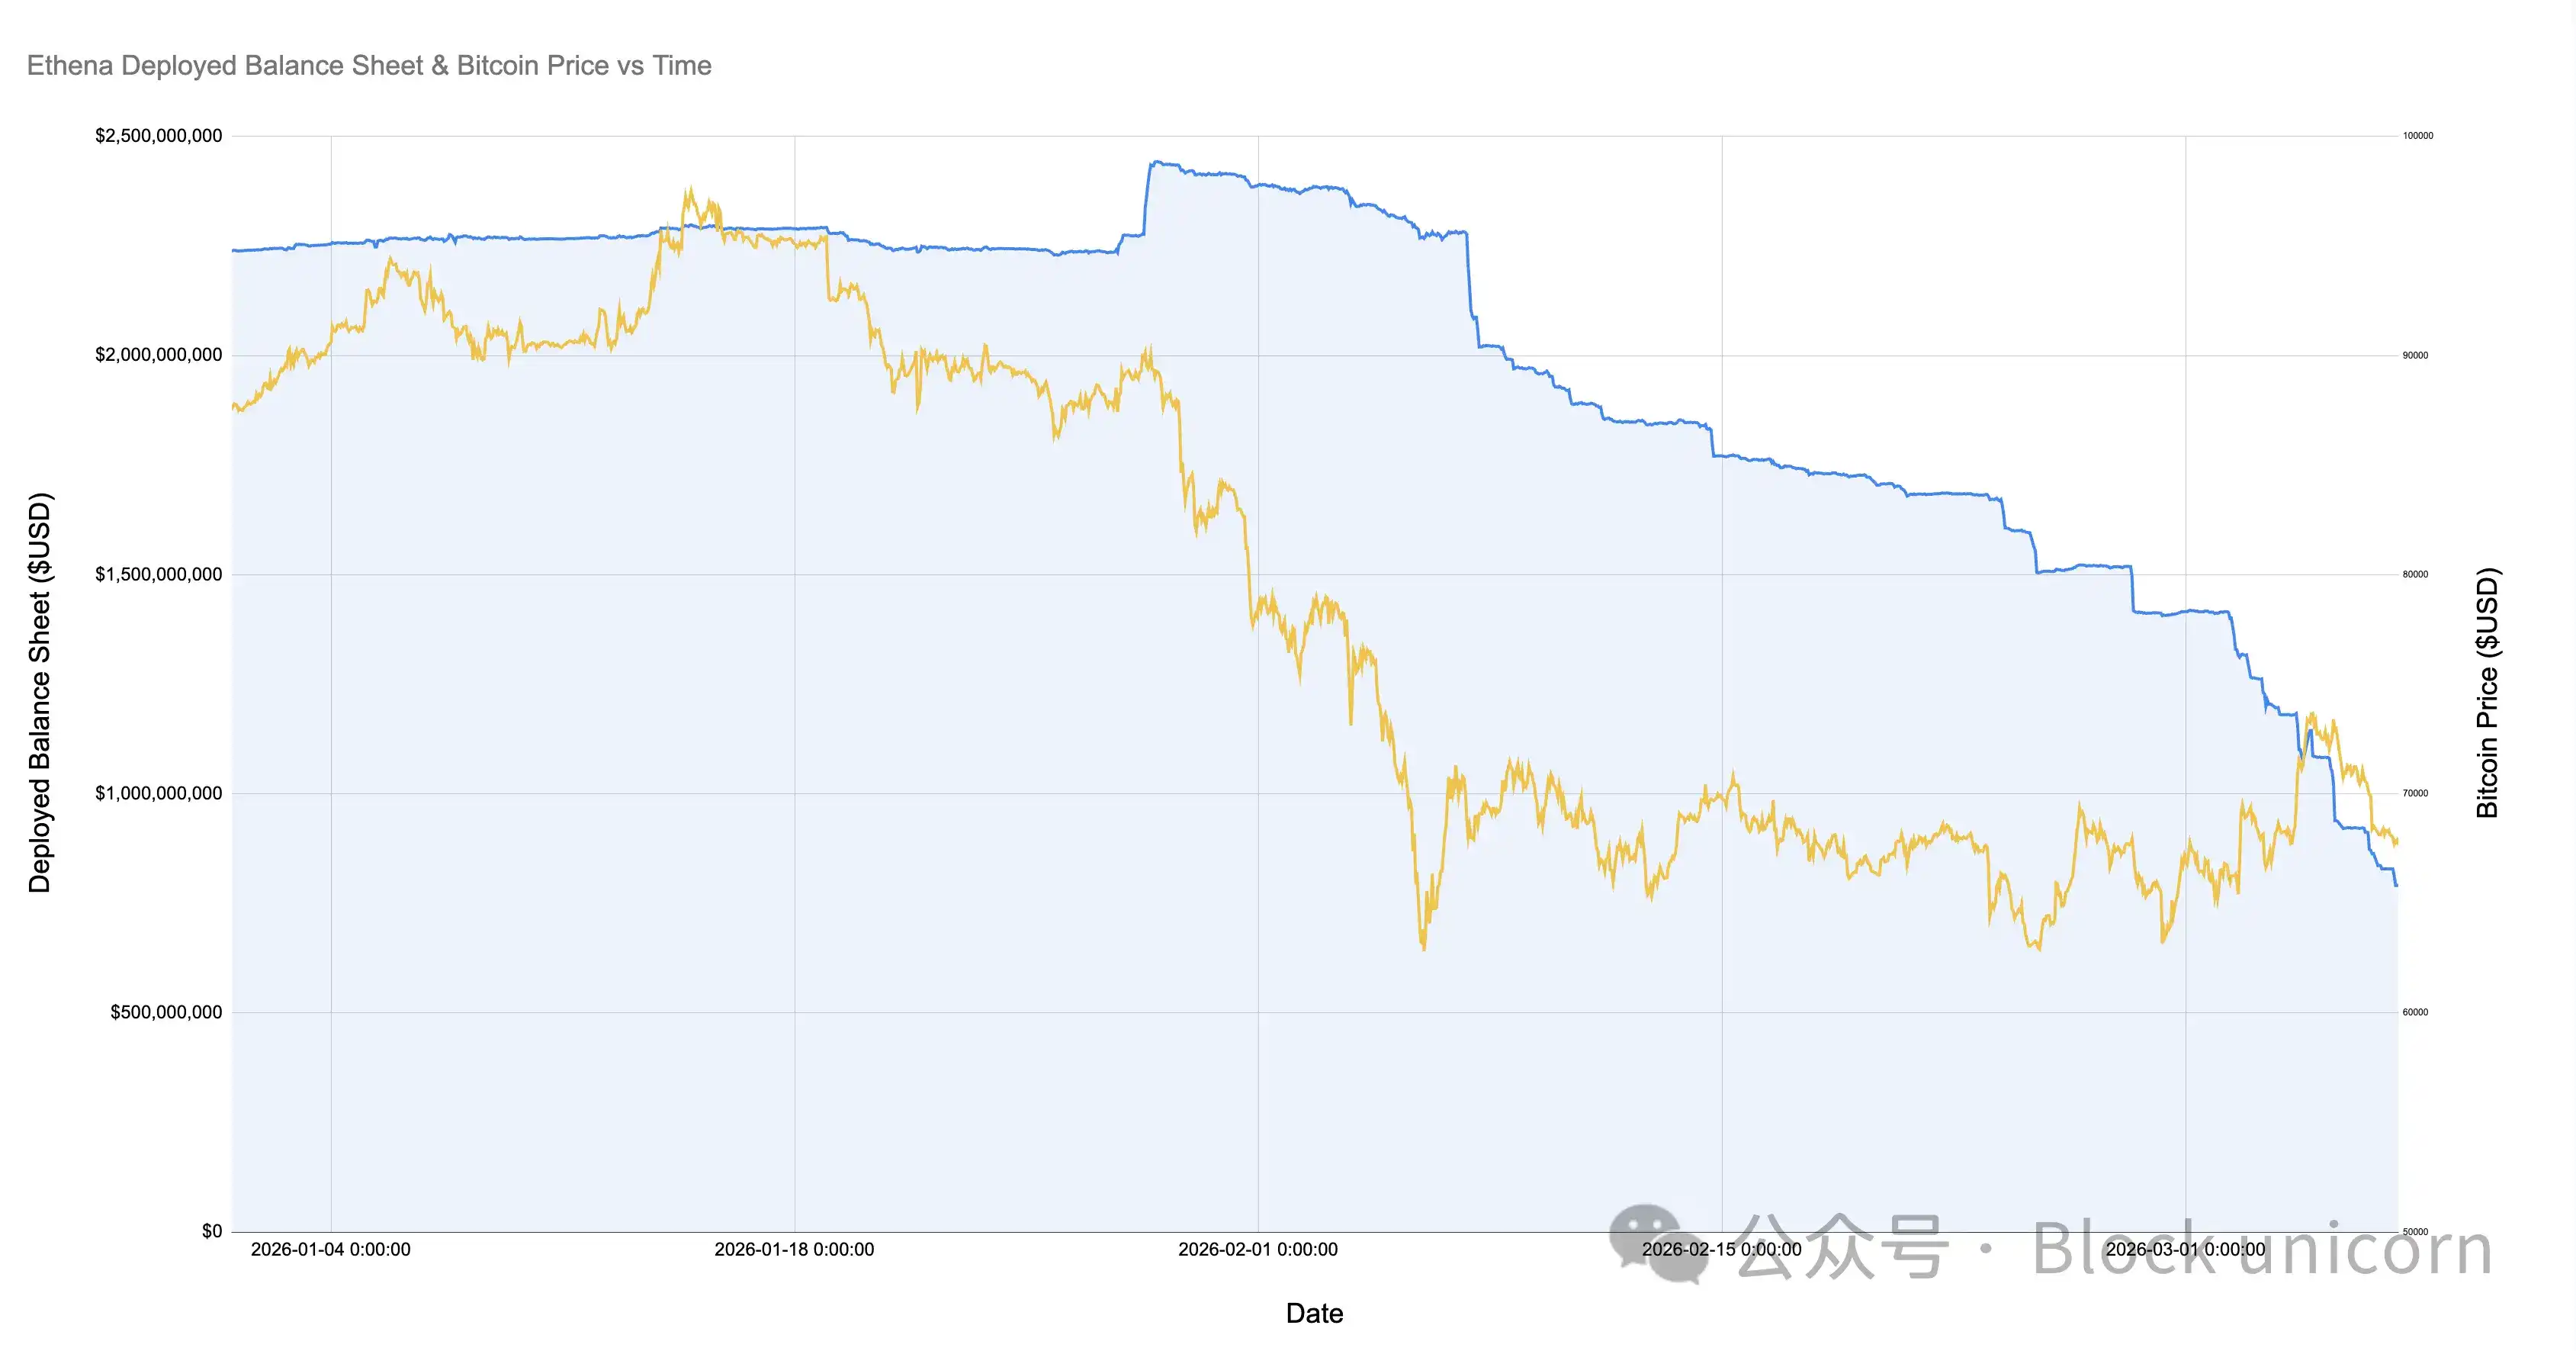
(Chart: Ethena Deployed Capital vs. Bitcoin Price Trend 2026)

Since the Bitcoin price fell to $60,000, Ethena's basis positions have shrunk by over 60%, from over $2 billion to less than $800 million. This change is puzzling because the market has been relatively stable during this period. The reasons for this are as follows:

  1. Profitable but unsustainable basis trades established after the February crash (the basis turned negative, but funding rates were also negative) are being gradually unwound.

  2. Increased hedging activity from directional shorts and price-insensitive participants is squeezing out opportunistic basis traders.

  3. Insufficient demand for leveraged exposure from longs.

(Chart: Open Interest vs. Funding Rate Trend)

In my opinion, the truth is primarily determined by a combination of factors 1 and 2, with factor 3 playing a minimal role. As shown in the chart above, during this period of gradual Ethereum project unwinding, the overall open interest for Bitcoin (and other major cryptocurrencies) has remained relatively stable. Meanwhile, funding rates have been negative for an extended period, with many cryptocurrencies (e.g., SOL) having cumulative negative funding rates across multiple exchanges. This indicates an increasing demand for shorting or hedging some form of risk exposure.

If I had to guess, I would say that small and medium-sized cryptocurrency companies and venture capital firms are both facing a crisis. Think of small-cap projects like Eigen, Grass, Monad, etc. There are hundreds of such cryptocurrencies, each representing dozens of venture capital firms and a company with capital and employees. Venture capital firms need to control losses and lock in profits to meet fund investment targets, and these companies need to ensure cash flow and headcount. This creates a situation where all participants want to squeeze the maximum benefit from the "stone," and the answer lies in relatively crowded trades through actively managed structured products that short a basket of correlated assets.

We saw the presence of these structured products during Ethereum's (ETH) explosive rally days, which also triggered short-covering rallies in numerous small and medium-sized cryptocurrencies. Another piece of evidence is the significant crowding out of opportunistic basis traders like Ethena.

Regardless of the specific reason, we can be sure that this is the first time in the history of the crypto market that directional longs and directional shorts have almost reached equilibrium. There is no充分 reason why this state cannot become the new normal, nor can it be proven that this market regime must change, but looking at other asset classes and markets, it is very unusual for such a trend to persist.

Пов'язані питання

QWhat does the significant decrease in Ethena's deployed capital indicate about the current cryptocurrency market?

AThe significant decrease in Ethena's deployed capital, which is at 71% of its 2025 low and only 12.9% of its peak, indicates that net long demand is at a historically low level. This reflects a prolonged risk-off sentiment in the market, where there is a lack of excess demand for leveraged long positions that is not being met by directional shorts.

QAccording to the article, what are the four main categories of perpetual contract holders in the crypto market?

AThe four main categories are: 1. Directional Longs (speculators seeking upside exposure), 2. Directional Shorts / Hedgers (those betting on downside or hedging existing assets), 3. Basis Traders (opportunistic shorts like Ethena that fill excess long demand), and 4. Perpetual Arbitrageurs (traders who hold both long and short positions to exploit price differences between contracts).

QHow does the article use the equation 'Directional Longs = Directional Shorts + Basis Shorts' to interpret market structure?

AThis equation, derived from the fact that all perpetual contracts are matched 1:1, shows that the amount of speculative long demand must be balanced by a combination of speculative short selling and the capital provided by basis traders. Ethena's deployed capital serves as a proxy for 'Basis Shorts,' allowing analysts to infer the relationship and imbalance between directional long and short interest.

QWhat are the proposed reasons for the 60% contraction in Ethena's positions since the February market crash, despite relatively stable prices?

AThe proposed reasons are: 1. The unwinding of profitable but unsustainable basis trades established after the February crash (where basis turned negative along with funding rates). 2. Increased hedging activity from directional shorts and price-insensitive participants, crowding out opportunistic basis traders. The article suggests reason 3 (insufficient leveraged long demand) plays a minimal role compared to the first two.

QWhat unique market condition does the current low level of Ethena's deployment reveal, and why is it considered unusual?

AIt reveals a market condition where directional long positions are nearly equal to directional short positions, achieving an extremely rare and historically unsustainable equilibrium. This is unusual because, in most asset classes and market regimes, there is typically a natural imbalance with a greater propensity for long speculation, making such a balance between bullish and bearish directional bets highly atypical.

Пов'язані матеріали

Behind HYPE's Repeated Record Highs, the 'Minions' in the Ecosystem Can't Keep Up

While HYPE, the native token of the Hyperliquid ecosystem, surges to new all-time highs above $76 and attracts significant institutional ETF inflows, a starkly different reality unfolds within its HyperEVM application layer. Multiple core DeFi protocols across lending, NFTs, stablecoins, and DEXs have announced shutdowns between May and June. The article argues HYPE functions more like an "application stock" than a traditional ecosystem token. Its value is anchored to the trading fees from Hyperliquid's core perpetual contracts platform (HyperCore), which boasts a diversified revenue stream from crypto, commodities, and indices. Approximately 97% of protocol fees fund buybacks and burns of HYPE. This means HYPE's price is largely decoupled from the health of projects built on HyperEVM. The closures of significant projects like lending protocol HypurrFi (peak TVL >$300M) and NFT marketplace Drip.Trade highlight a structural tension. Hyperliquid's minimalist philosophy offers infrastructure without official grants, liquidity support, or marketing coordination for HyperEVM projects. This forces protocols into a fiercely competitive environment from day one. Furthermore, the success of HyperCore creates a liquidity vacuum, and mechanisms like HIP-3 (allowing direct perpetual market deployment) divert user attention and capital away from application-layer projects. The stronger the core perpetual trading business becomes, the more difficult it is for peripheral "DeFi lego" projects to survive and capture value, despite the flagship token's rising price.

Foresight News8 хв тому

Behind HYPE's Repeated Record Highs, the 'Minions' in the Ecosystem Can't Keep Up

Foresight News8 хв тому

Conversation with Arthur Hayes: AI Has Drained Market Liquidity, BTC Will Be Below 100k by Year-End

In this June 2026 podcast interview, BitMEX co-founder Arthur Hayes explains his decision to sell his major crypto holdings (HYPE, NEAR, Worldcoin, Zcash). His rationale is based on a macro view linking oil prices, the Iran conflict, US politics, and an impending AI bubble burst. Hayes argues that high oil prices, driven by the ongoing war, will pressure domestic US inflation. To salvage the Republican Party's chances in the midterm elections, he believes Donald Trump may pivot to a populist, anti-AI stance—advocating for taxes and regulation—which would deflate the AI investment narrative. He sees the AI sector, particularly massive capital expenditure on data centers, as having absorbed nearly all excess market liquidity (around $1.5 trillion in debt issuance since 2025), starving other assets like Bitcoin. He highlights the upcoming SpaceX IPO at a ~$1.8 trillion valuation and 100x price-to-sales ratio as a potential tipping point. If these hyped IPOs underperform, it could shatter market confidence in AI. In such a scenario, all risk assets, including crypto, would fall together as correlations converge to 1 during a broad correction. Hayes has moved his portfolio into Treasuries and energy stocks (like ExxonMobil), predicting Bitcoin will be below $100k by year-end. He sees a potential crypto bull market only after the AI frenzy cools, liquidity stops flowing exclusively into AI, and possibly after a significant market downturn prompts new monetary stimulus.

marsbit19 хв тому

Conversation with Arthur Hayes: AI Has Drained Market Liquidity, BTC Will Be Below 100k by Year-End

marsbit19 хв тому

Fed's Internal Doves Flock to Hawkish Stance, Warsh's Debut "Between a Rock and a Hard Place"

U.S. Federal Reserve officials who previously advocated for rate cuts, including Governor Christopher Waller, have recently shifted their stance, with many now not ruling out the possibility of future rate hikes. This sets a challenging stage for new Fed Chair Kevin Warsh's first policy meeting. Appointed by President Trump based on his dovish views, Warsh now faces a committee where the debate has pivoted from "when to cut" to "whether to hike," driven by persistent inflation above 3%, a strong labor market, and supply-side pressures from AI infrastructure demands and geopolitical tensions. Key figures illustrate the shift. Governor Waller, once concerned about employment, now says data has pushed him toward considering rate increases. Even moderate voices like Governor Lisa Cook, while expecting inflation to ease, have indicated readiness to hike if it fails to do so. Long-time hawks such as regional Fed presidents Beth Hammack, Lorie Logan, and Neel Kashkari have grown more vocal, arguing that the real policy rate is effectively falling and that action may soon be needed. The upcoming Fed meeting is expected to keep rates steady but will likely remove the "easing bias" from its statement, signaling a neutral stance between cuts and hikes. The quarterly "dot plot" is anticipated to show most officials projecting no cuts this year, with some potentially indicating hikes. Chair Warsh, a critic of the Fed's reliance on forward guidance like the dot plot, must navigate communicating this pivot using tools he has questioned, all while steering policy in a direction counter to the preferences of the president who appointed him. The consensus suggests the Fed's next move could well be a rate increase.

marsbit1 год тому

Fed's Internal Doves Flock to Hawkish Stance, Warsh's Debut "Between a Rock and a Hard Place"

marsbit1 год тому

The Trillion-Yuan Market Cap 'Yi Zhong Tian': Who is the True Value King?

The article analyzes the three leading Chinese optical module companies, collectively nicknamed "Yi Zhong Tian": Xinyisheng, Zhongji Innolight, and TFC Optical Communication. It evaluates their "cost-performance" not by current stock price, but through three lenses: PEG ratio (growth vs. valuation), earnings quality, and premium/discount for certainty. Xinyisheng shows the most attractive PEG ratio and high profitability, but its valuation reflects discounts for risks like high customer concentration and reliance on overseas markets. Zhongji Innolight, the most expensive, commands a premium for its market leadership, dominant share in key products like 800G/1.6T modules, and higher earnings certainty, though it faces geopolitical risks. TFC Optical, as an upstream component supplier ("water seller"), has the highest gross margin and bets on the long-term CPO/NPO architecture trend, but trades at a high valuation with more stable, less explosive growth. The core argument is that while these companies dominate module assembly, the true profit pool and technological moat lie upstream in laser and switch chips, currently controlled by U.S. firms like Lumentum and Coherent. The long-term "cost-performance" for these Chinese leaders hinges on whether the domestic industry, exemplified by companies like Yuanjie Technology, can successfully move up the value chain into high-power laser chips. Otherwise, their high growth may remain confined to the lower-margin assembly segment.

marsbit1 год тому

The Trillion-Yuan Market Cap 'Yi Zhong Tian': Who is the True Value King?

marsbit1 год тому

Торгівля

Спот
Ф'ючерси
活动图片