Velvet crypto slides 75% in a week – Why bulls aren’t giving up yet

ambcryptoОпубліковано о 2026-07-09Востаннє оновлено о 2026-07-09

Анотація

Velvet (VELVET) has plummeted 75% in a week, with an additional 16% drop in the last 24 hours due to intense selling pressure. This bearish trend is reflected in a Taker Buy Sell Ratio below 1 and a 28% decline in Open Interest, indicating capital withdrawal from the perpetual market. Despite the sell-off, traders maintain a net long position, as shown by a positive Funding Rate. Their conviction is supported by Velvet's significant gains of 59% over the past month and 533% over the quarter. However, recent liquidations have favored short positions. Crucially, spot investors are accumulating, with $1.58 million in net purchases this week, nearly half in the last 48 hours, suggesting they view the price drop as a buying opportunity for a potential near-term rebound.

Velvet [VELVET] has fallen 75% over the past week, with losses continuing as bearish pressure intensifies. At press time, the asset had dropped another 16% in the last 24 hours under the same selling pressure.

The intriguing dynamic beneath the decline is that traders across both the spot and perpetual markets are holding buy-side positions, committing capital against the current tide for Velvet.

Velvet buckles under mounting sell pressure

Velvet is absorbing heavier selling pressure and bearish sentiment, a shift visible in the asset’s trading volume and the shrinking capital base across its perpetual market.

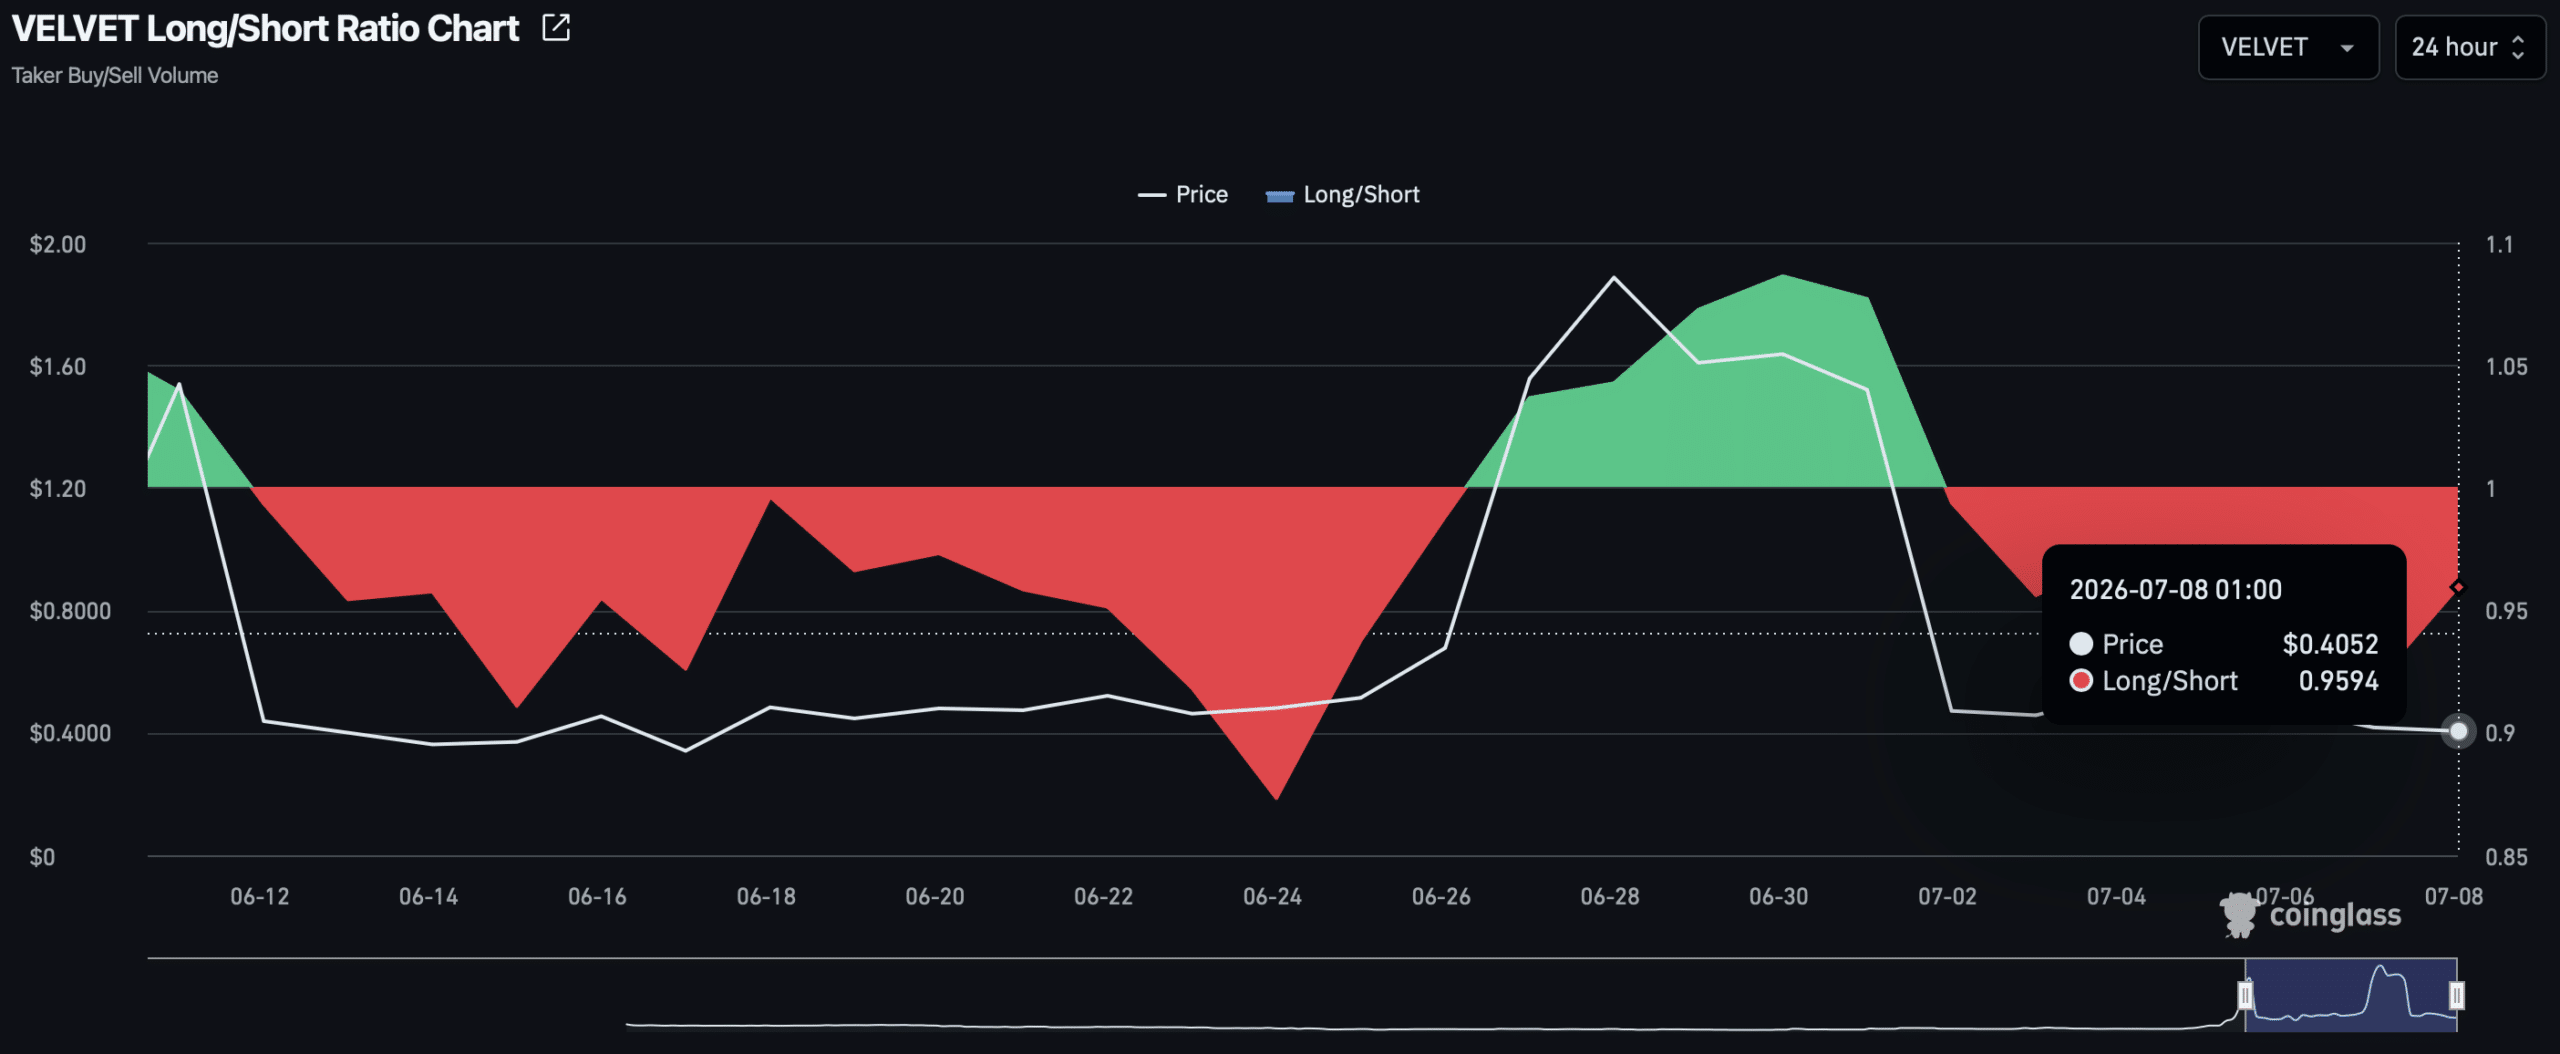
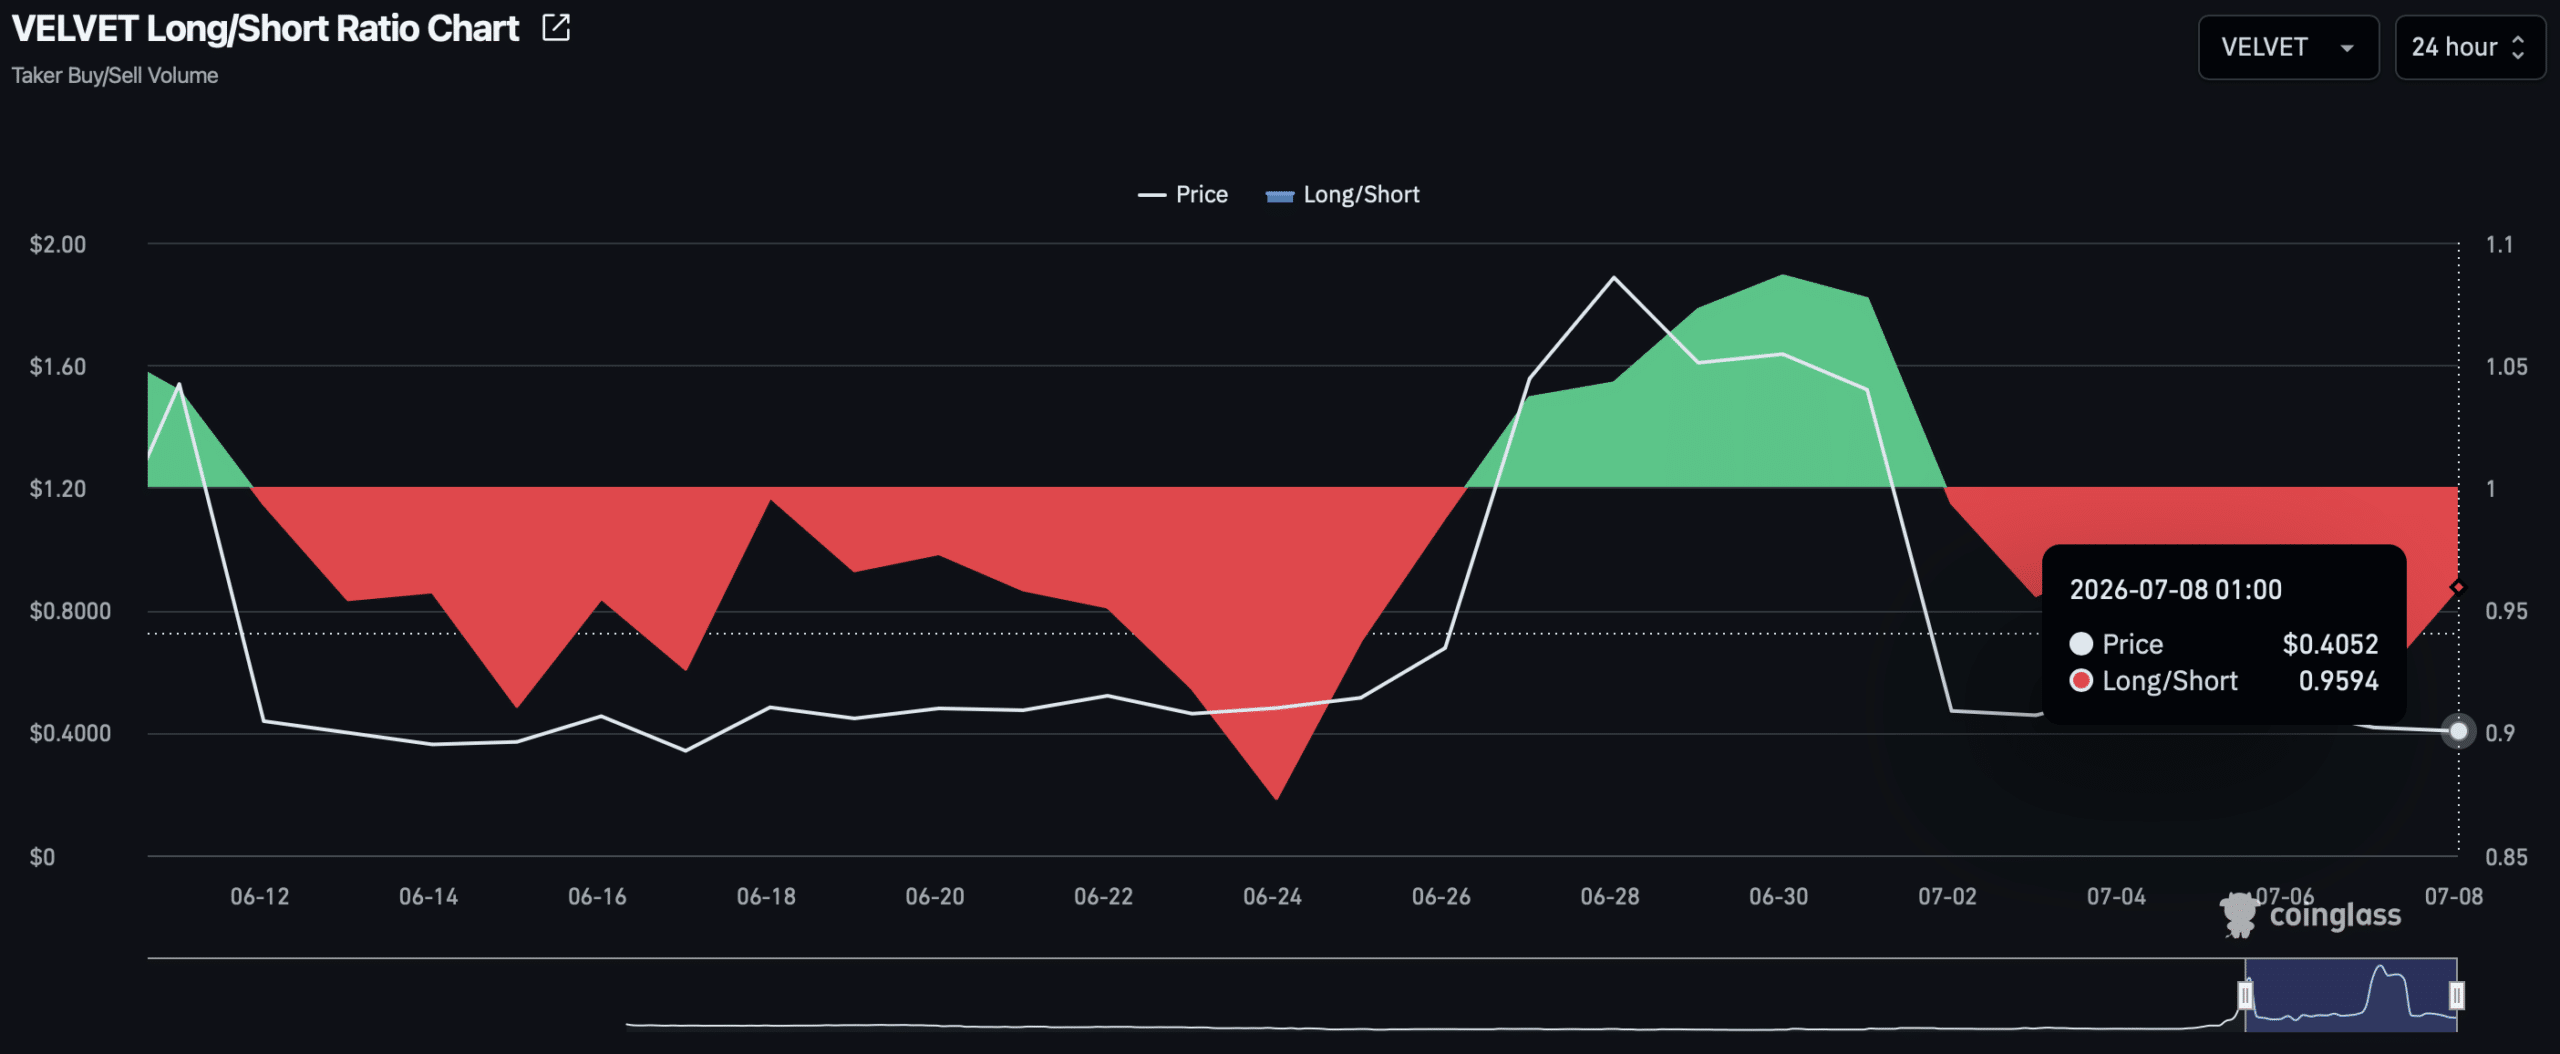
The Taker Buy Sell Ratio, which measures long trading volume against short trading volume in the perpetual market, has tilted toward the sell side as the reading slips to 0.95 as of writing.
Source: CoinGlass

A ratio below 1 signals that sellers are dominating volume across multiple accounts. The sell volume isn’t heavily exaggerated, though, since the figure sits only slightly beneath the 1 mark on the chart. That selling has coincided with a contracting capital base for Velvet in the perpetual market, as investors withdraw funds over concerns about high volatility.

CoinGlass data showed that Open interest, which tracks capital movement in the perpetual market, plunged from $29.36 million to $21.07 million, a 28% decline across the period.

Traders hold net long through the sell-off

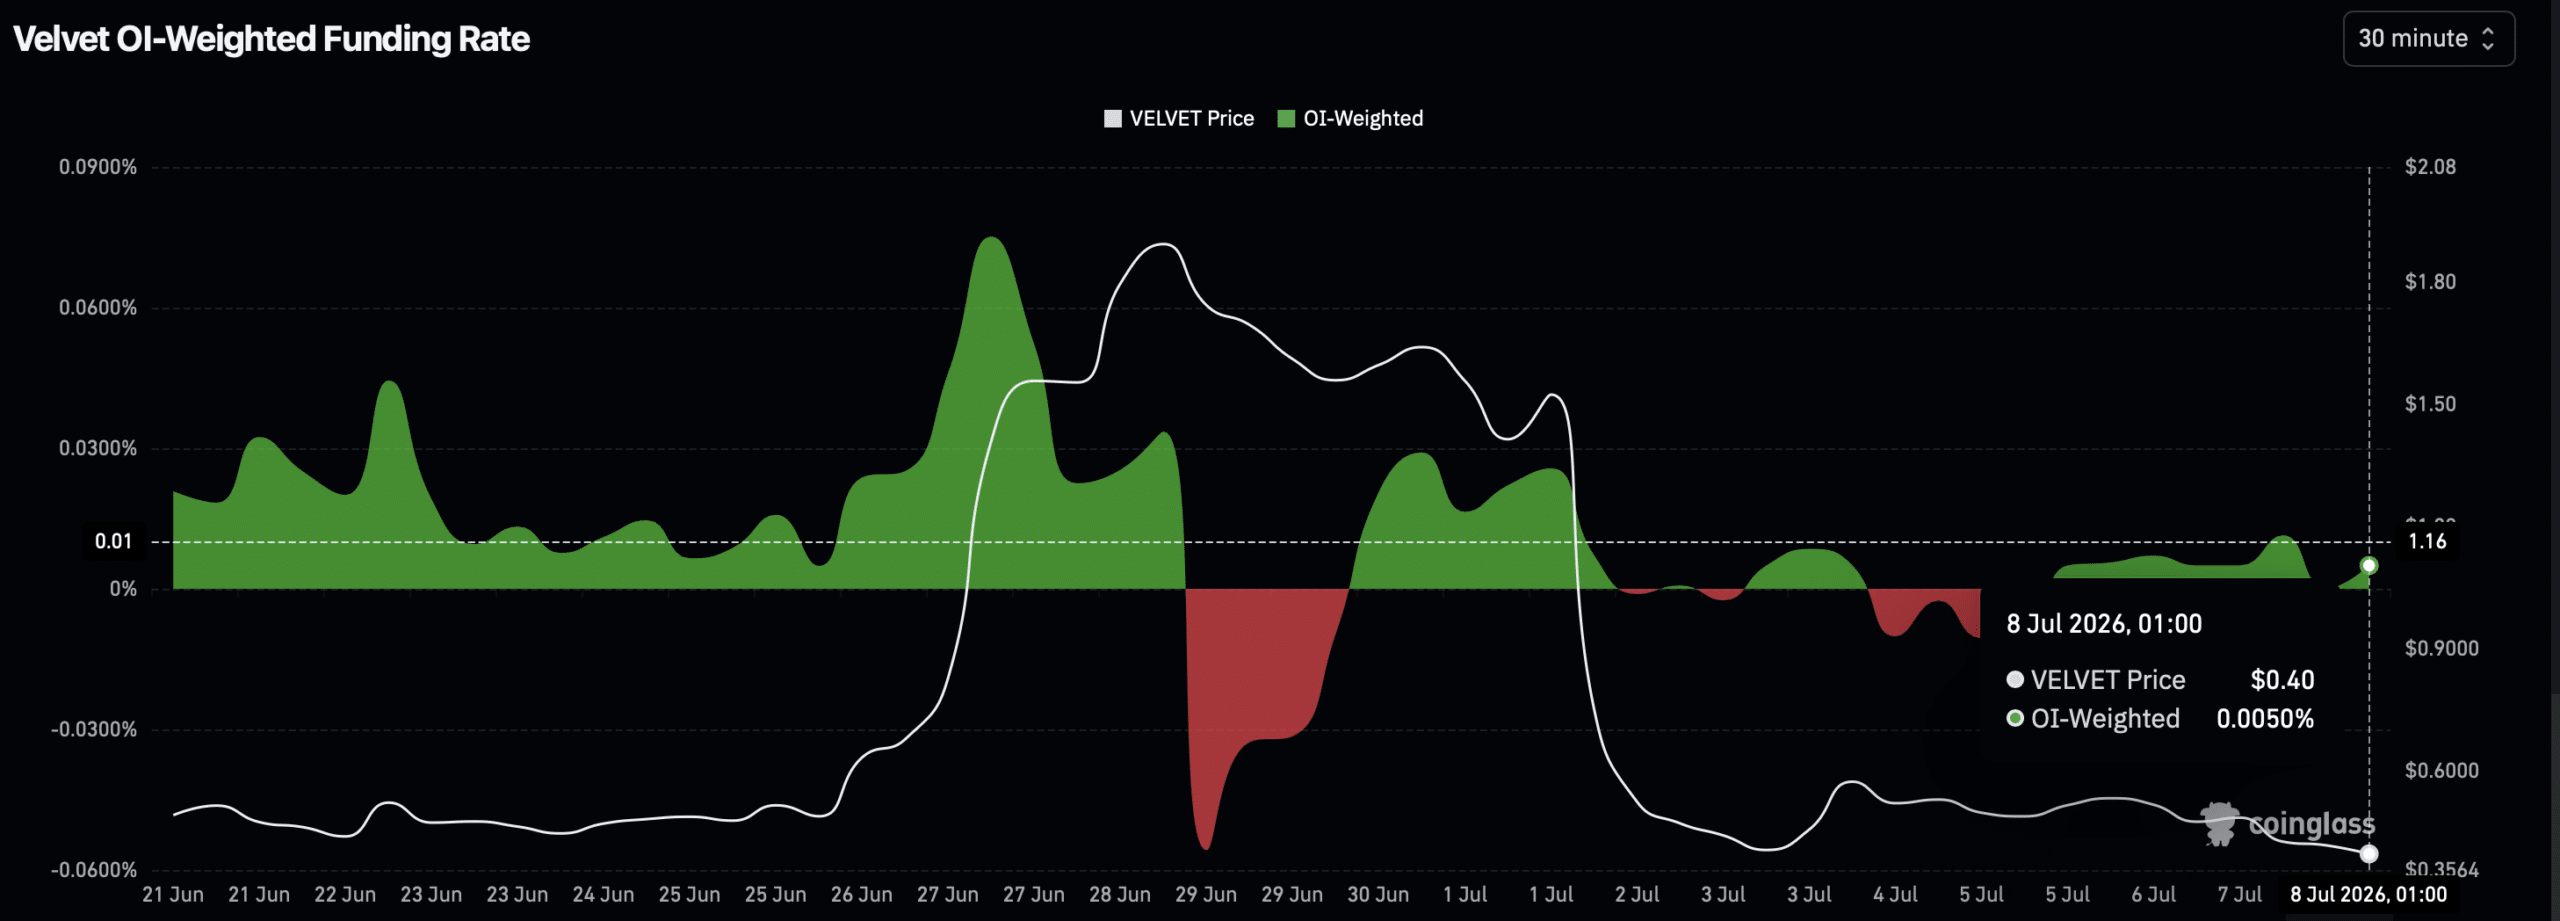
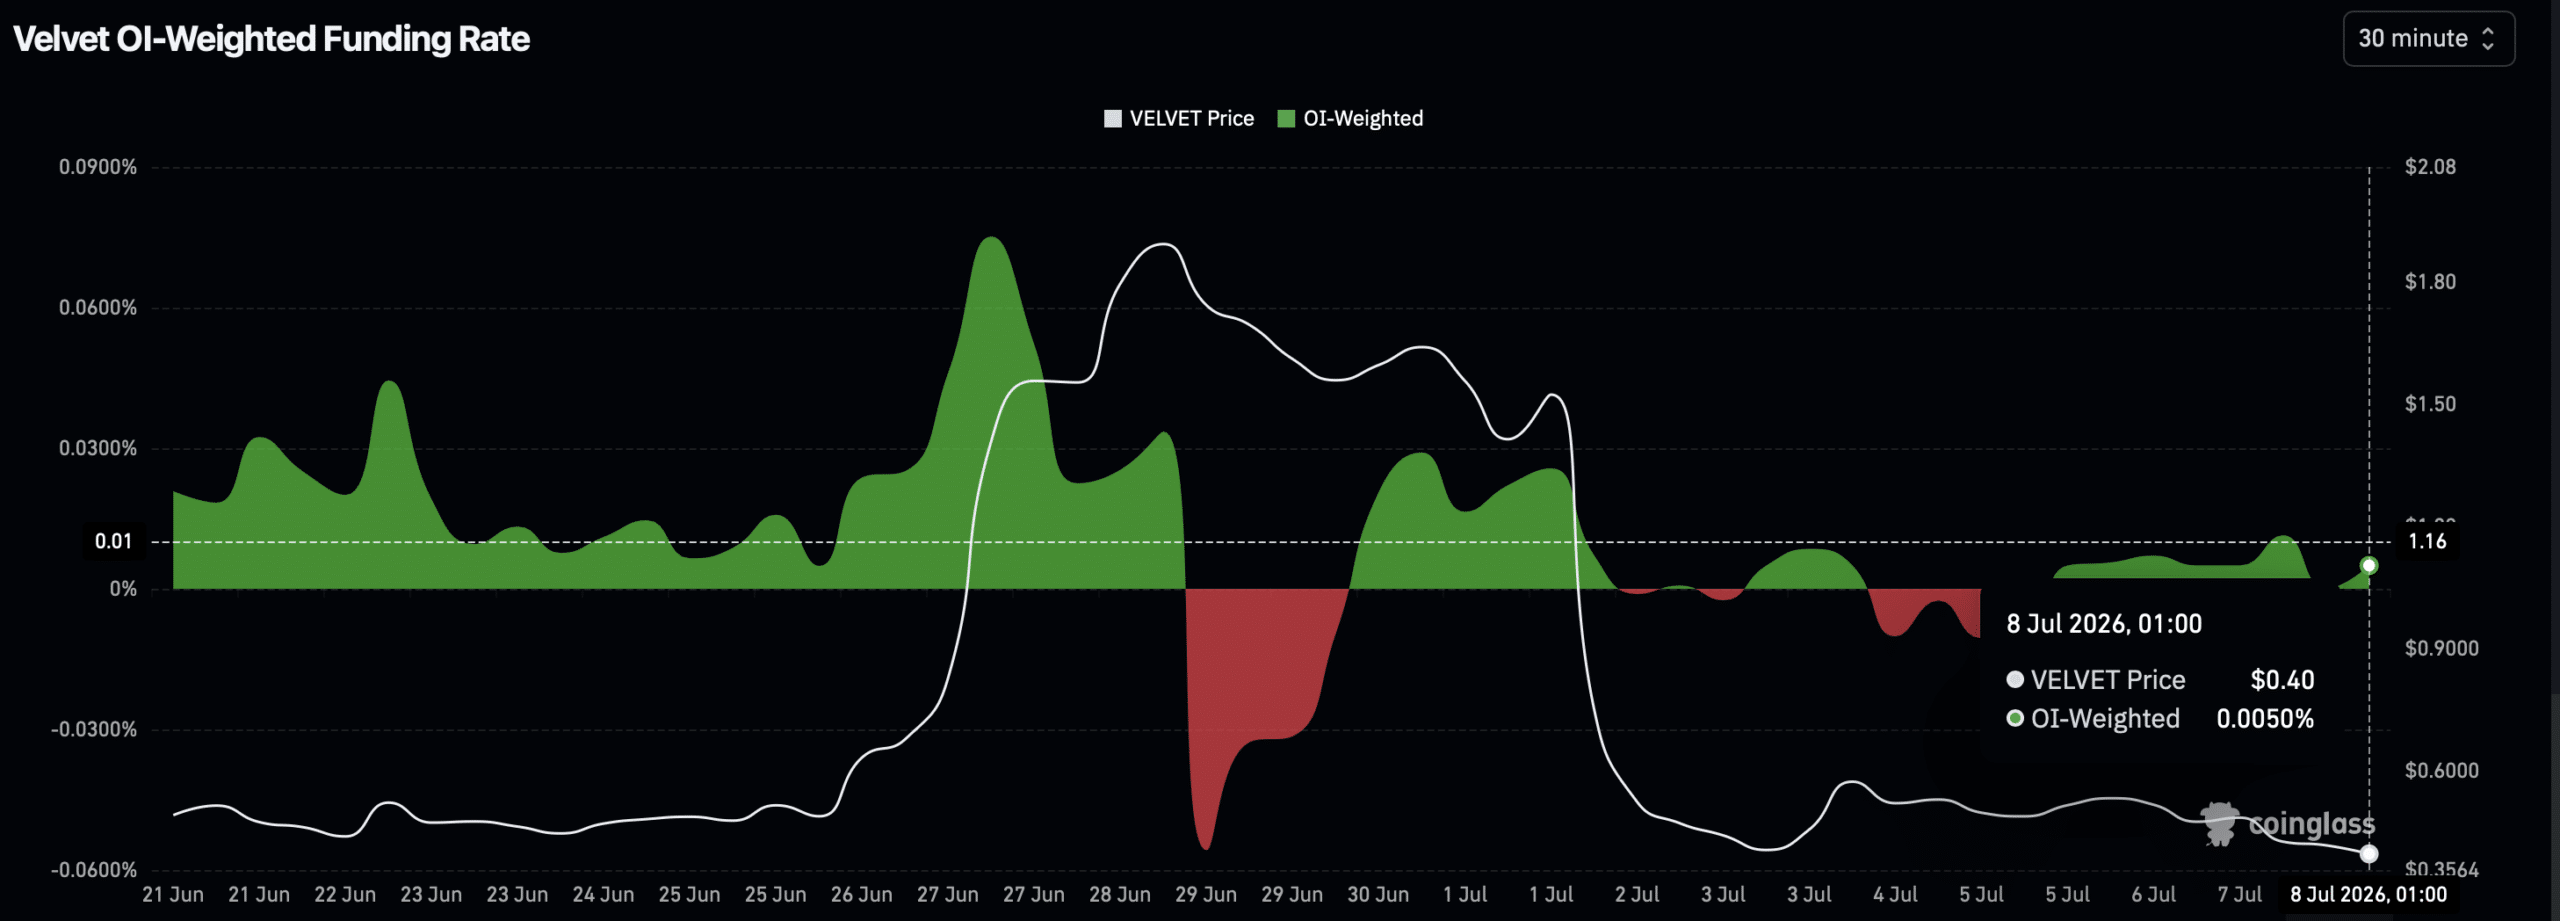
The compelling part of this picture is that trader positioning remains net long despite the rising sell volume and the capital contraction. The Funding Rate, which reflects whether market positioning favors buyers through long trades or sellers through short trades, printed a reading of 0.0050%.

A positive reading, as in this case and only mildly so, indicates that traders are still positioned net long ahead of an upward move ahead.
Source: CoinGlass

However, over a longer horizon, they have reason for conviction in an upswing, as Velvet has surged 59% over the past thirty days and climbed 533% across a quarter, nearly ten times the monthly figure.

The short-term conviction stays questionable, though, since longs have lost more than shorts, with the past 24 hours as the reference.

Total liquidations reached $558,320 over that stretch, and long liquidations constituted the majority at $490,520, an outcome that has made shorting Velvet more profitable than going long.

Spot buyers accumulate through the decline

Spot investors keep reinforcing the broader market narrative as their buying activity climbs.

At the time of analysis, total purchases from spot investors reached $1.58 million this week alone. Nearly half of that has arrived in the past 48 hours, with $781,000 worth of Velvet in netflow backing the buy side.

When netflow confirms stronger net buying in the spot market, it often suggests investors view the recent decline as a discount and an opportunity to accumulate. A continuation of this buying trend would hand Velvet a solid base for a rebound in the near term.


Final Summary

  • Velvet has dropped 75% over the past week and another 16% in a day, with traders pulling money out of the market as selling picks up.
  • Spot buyers have put $1.58 million into Velvet this week, betting the lower price is a chance to buy in before a possible recovery.


Трендові криптовалюти

Пов'язані питання

QWhat has been the recent price performance of Velvet (VELVET)?

AVelvet (VELVET) has fallen by 75% over the past week. In the last 24 hours alone, it dropped another 16% due to intensifying selling pressure.

QDespite the price drop, what does the Funding Rate data suggest about trader positioning?

AThe Funding Rate for Velvet's perpetual market is positive at 0.0050%. This indicates that traders, on net, are still holding long positions, expecting an upward move in the future.

QWhat is the Taker Buy Sell Ratio, and what does its current reading for Velvet indicate?

AThe Taker Buy Sell Ratio measures long trading volume against short trading volume in the perpetual market. For Velvet, the ratio is 0.95, which is slightly below 1. This signals that sellers are currently dominating the trading volume.

QHow have spot market investors reacted to Velvet's price decline according to the article?

ASpot market investors have been accumulating Velvet during its decline. Their total purchases reached $1.58 million this week, with nearly half ($781,000) coming in the past 48 hours. This suggests they view the lower price as a buying opportunity.

QWhat is the trend in Open Interest for Velvet, and what might it imply?

AOpen Interest for Velvet in the perpetual market has plunged by 28%, from $29.36 million to $21.07 million. This decline indicates a contraction in the capital base, as investors withdraw funds likely due to concerns over high volatility and the ongoing sell-off.

Пов'язані матеріали

Glassnode: Crypto Market Enters Later Stages of Bottoming Phase

Glassnode: Crypto Market Enters Later Stages of Bottom Formation Bitcoin has traded below the true market average and the short-term holder cost basis for five consecutive months, indicating a deep undervaluation. On-chain data reveals a significant shift in selling pressure, with long-term holders now accounting for 43% of all realized losses. Daily realized losses for this group recently peaked at $280 million, the highest level since December 2022. While this large-scale capitulation is a hallmark of bear market bottoms, a sustained decline in this metric is a prerequisite for a sustained recovery. Institutional demand remains weak. US spot Bitcoin ETFs continue to see monthly net outflows, although the pace has moderated from June's peak. Furthermore, average daily ETF trading volumes have contracted by approximately 80% from their October 2025 peak, reflecting subdued institutional participation. Derivatives markets present a mixed picture. Overall positioning has shifted to cautiously bullish, with the put/call ratio dropping to a yearly low. However, the options volatility skew remains elevated, signaling that traders are still paying a premium for downside protection. The spot price also trades below the gamma "max pain" level. In summary, multiple indicators suggest the market is in the later phases of a bottoming process, characterized by long-term holder capitulation and weak institutional inflows. However, key confirmation signals for a durable trend reversal—a sustained drop in long-term holder selling pressure, stabilization of ETF flows, and a price recovery above key cost bases—are still pending.

Foresight News19 хв тому

Glassnode: Crypto Market Enters Later Stages of Bottoming Phase

Foresight News19 хв тому

Private Credit in US Dollar

Stablecoins are evolving into a new type of money market fund, channeling crypto deposits into the $2 trillion private credit market. This mirrors the 1970s innovation where money market funds pooled small deposits to buy high-yield government securities, bypassing bank restrictions. Today, platforms like Apollo's ACRED tokenized fund and Figure's on-chain lending system allow stablecoin holders to access institutional private credit strategies with no minimum investment, offering yields of 8-12%. On-chain tokenization enables greater liquidity and DeFi composability (e.g., using tokens as collateral for leveraged positions) compared to traditional, locked-up private credit funds. Consequently, on-chain private credit has grown 15x in a year to $5.87 billion, though it remains a tiny fraction (0.3%) of the global market. However, this model carries significant risks, as illustrated by the failure of Goldfinch. Launched in 2021, it directed crypto deposits to motorcycle loans in Kenya and Nigeria. Critical issues included a lack of local oversight, leading to unauthorized fund transfers and borrower defaults. With $56 million now trapped in non-performing loans, its collapse highlights that while blockchain streamlines capital transfer, the essential 90% of lending—underwriting, monitoring, and recovery—remains a costly, localized challenge. Success requires robust, traditional credit infrastructure, not just on-chain execution.

marsbit40 хв тому

Private Credit in US Dollar

marsbit40 хв тому

Goldman Sachs: How to Invest in Tech Stocks in the Second Half of the Year?

Goldman Sachs remains bullish on tech stocks in the second half of the year, advising a shift from "buying the sector" to "picking individual companies." The firm's latest report indicates the AI-driven tech cycle shows no signs of peaking, with supply exceeding demand or technological progress slowing yet to materialize. Recent pullbacks are viewed as healthy corrections following rapid gains, not a trend reversal. Three core investment themes are highlighted: 1) Maintain overweight positions in AI server and data center-related hardware stocks. 2) Conduct more nuanced risk-reward assessments in sub-sectors where supply and demand are tightening. 3) During periods of declining risk appetite, consider software and IT services companies leveraging AI to create new business opportunities as a defensive play. The report emphasizes that future outperformance will depend more on individual company competitiveness (alpha) rather than broad sector momentum (beta). Companies likely to excel are those benefiting from price increases, possessing strong capacity expansion capabilities, having undervalued AI growth potential, or holding unique catalysts. For defense, Goldman suggests focusing on AI-enabling software and service firms—such as those in AI consulting, data infrastructure, and cybersecurity—which may see efficiency gains and new demand, rather than retreating to traditional defensive sectors. Overall, the strategy balances offensive exposure to AI infrastructure with defensive positioning in AI-applicable software and services.

链捕手45 хв тому

Goldman Sachs: How to Invest in Tech Stocks in the Second Half of the Year?

链捕手45 хв тому

Торгівля

Спот

Популярні статті

Як купити T

Ласкаво просимо до HTX.com! Ми зробили покупку Threshold Network Token (T) простою та зручною. Дотримуйтесь нашої покрокової інструкції, щоб розпочати свою криптовалютну подорож.Крок 1: Створіть обліковий запис на HTXВикористовуйте свою електронну пошту або номер телефону, щоб зареєструвати обліковий запис на HTX безплатно. Пройдіть безпроблемну реєстрацію й отримайте доступ до всіх функцій.ЗареєструватисьКрок 2: Перейдіть до розділу Купити крипту і виберіть спосіб оплатиКредитна/дебетова картка: використовуйте вашу картку Visa або Mastercard, щоб миттєво купити Threshold Network Token (T).Баланс: використовуйте кошти з балансу вашого рахунку HTX для безперешкодної торгівлі.Треті особи: ми додали популярні способи оплати, такі як Google Pay та Apple Pay, щоб підвищити зручність.P2P: Торгуйте безпосередньо з іншими користувачами на HTX.Позабіржова торгівля (OTC): ми пропонуємо індивідуальні послуги та конкурентні обмінні курси для трейдерів.Крок 3: Зберігайте свої Threshold Network Token (T)Після придбання Threshold Network Token (T) збережіть його у своєму обліковому записі на HTX. Крім того, ви можете відправити його в інше місце за допомогою блокчейн-переказу або використовувати його для торгівлі іншими криптовалютами.Крок 4: Торгівля Threshold Network Token (T)Легко торгуйте Threshold Network Token (T) на спотовому ринку HTX. Просто увійдіть до свого облікового запису, виберіть торгову пару, укладайте угоди та спостерігайте за ними в режимі реального часу. Ми пропонуємо зручний досвід як для початківців, так і для досвідчених трейдерів.

477 переглядів усьогоОпубліковано 2024.12.10Оновлено 2026.06.02

Як купити T

Обговорення

Ласкаво просимо до спільноти HTX. Тут ви можете бути в курсі останніх подій розвитку платформи та отримати доступ до професійної ринкової інформації. Нижче представлені думки користувачів щодо ціни T (T).

活动图片