US Stocks Are at a Time of 'Extreme Fragility' as Earnings Season Begins

链捕手Опубліковано о 2026-07-11Востаннє оновлено о 2026-07-11

Анотація

U.S. stocks are in an "extremely fragile" state as earnings season begins. Despite low index-level volatility, internal pressures are mounting due to geopolitical tensions, monetary policy expectations, and credit market signals. UBS's market fragility indicator, "Turbu-lens," has reached 0.9, its highest level since September 2025, historically a precursor to sharp VIX spikes. High earnings expectations for Q2—24% for the S&P 500 and 12% for Europe's Stoxx 600—amplify the risk of market disappointment. While the VIX is currently low, this calm is seen as temporary and likely to rise with earnings reports. Notably, single-stock volatility is over three times higher than index volatility, indicating extreme internal market divergence. This gap is expected to narrow, potentially triggering a surge in broader market volatility. Rising oil prices near $80/barrel maintain inflation concerns, keeping the Federal Reserve cautious and pushing 10-year Treasury yields toward 4.6%. Credit markets also show caution, with CDS spreads not fully endorsing the recent equity rally. For hedging, UBS suggests single-stock or pair-wise correlation trades in sectors like U.S. tech, energy, and financials, and European energy, tech, and consumer discretionary, as index-level hedges may be less effective amid expected sector rotation during earnings.

Author: Zhang Yaqi, Wall Street Insights

Volatility at the index level for U.S. stocks appears calm on the surface, but underlying pressures are building. Under the triple constraints of geopolitical tensions, monetary policy expectations, and credit market signals, market fragility has climbed to multi-year highs—just as a high-expectation, high-risk earnings season gets underway.

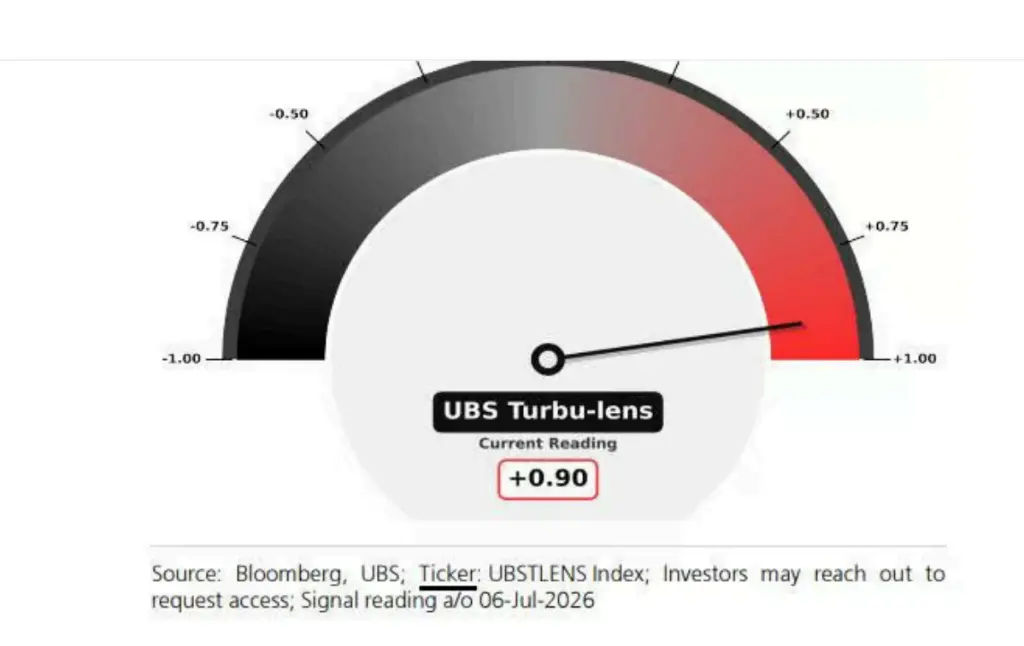
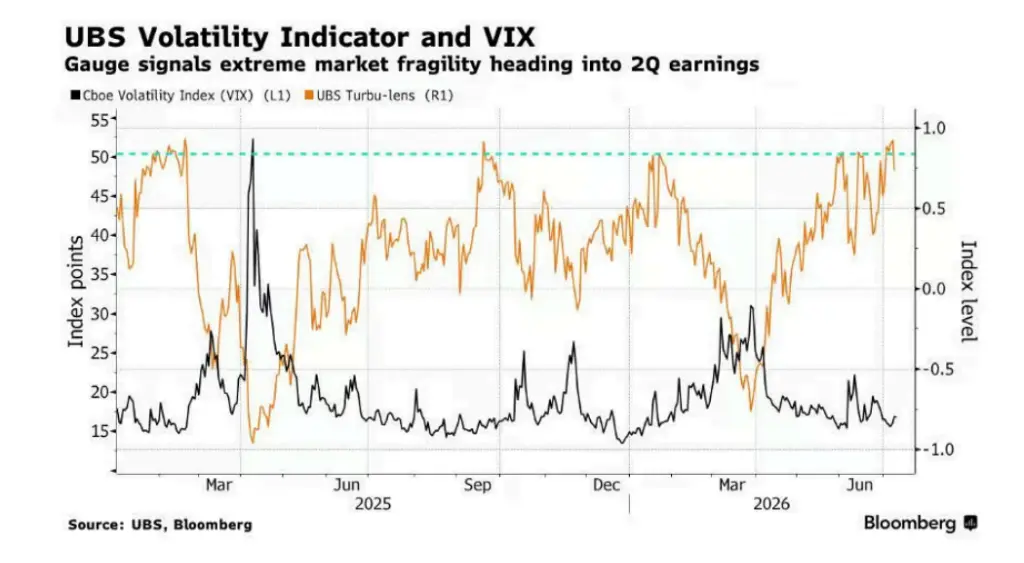
The "Turbu-lens" market fragility indicator from the UBS derivatives strategy team currently reads 0.9 (on a scale of -1 to 1), its highest level since mid-September 2025. Historically, readings at such levels have often preceded sharp spikes in the VIX. Maxwell Grinacoff's team of UBS derivatives strategists warns that this indicator points to "extreme market fragility" just as earnings season kicks off. Meanwhile, the team also noted that if systematic strategies were to fully add leverage, the reading "could realistically reach +1".
High market expectations are amplifying the risks further. Analysts' expectations for Q2 profit growth for S&P 500 constituents are as high as 24%, and for the Euro Stoxx 600 index, 12%. Unlike previous earnings seasons, analysts have continued to raise forecasts just before the reporting period, signaling strong confidence. However, this also means there is greater room for adjustment should results disappoint the market.
The VIX is currently at low levels, but this calm is misleading. Barclays strategist Anshul Gupta's team points out that the recent decline in the VIX coincides with a seasonal calendar window when price volatility typically narrows, representing a "brief sweet period" with limited sustainability. The onset of earnings season could push the VIX higher again.

More noteworthy is that the low volatility at the index level masks extreme internal market divergence—single-stock volatility currently exceeds index volatility by more than threefold. Grinacoff notes that the probability of this gap narrowing in the summer is high, at which point factors such as a repricing of monetary policy or geopolitical disruptions could trigger a sharp spike in index-level volatility.

In terms of hedging strategies, as dispersion trading and sector rotation are likely to persist during the earnings period in the coming weeks, index-level hedges may have limited effectiveness. Grinacoff suggests, "Single-stock options may offer better tactical opportunities."
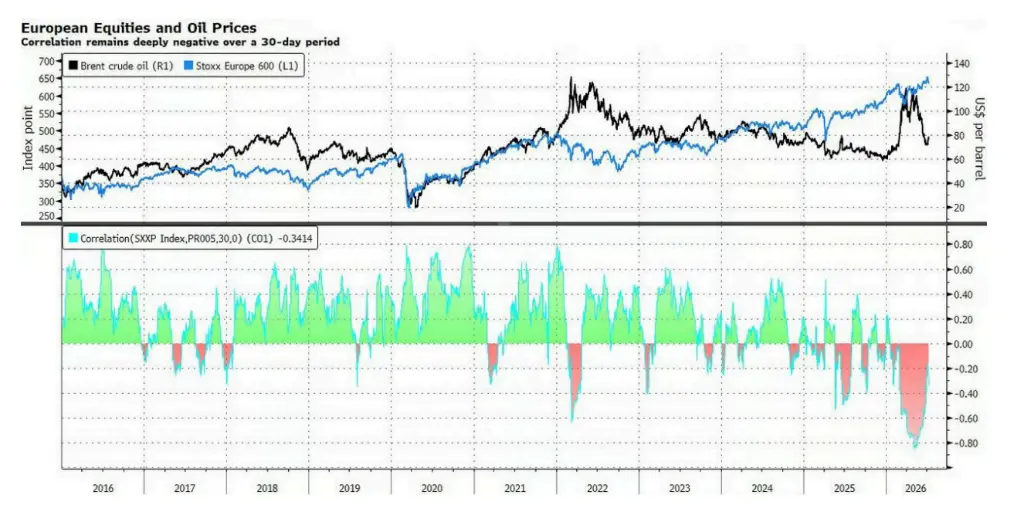
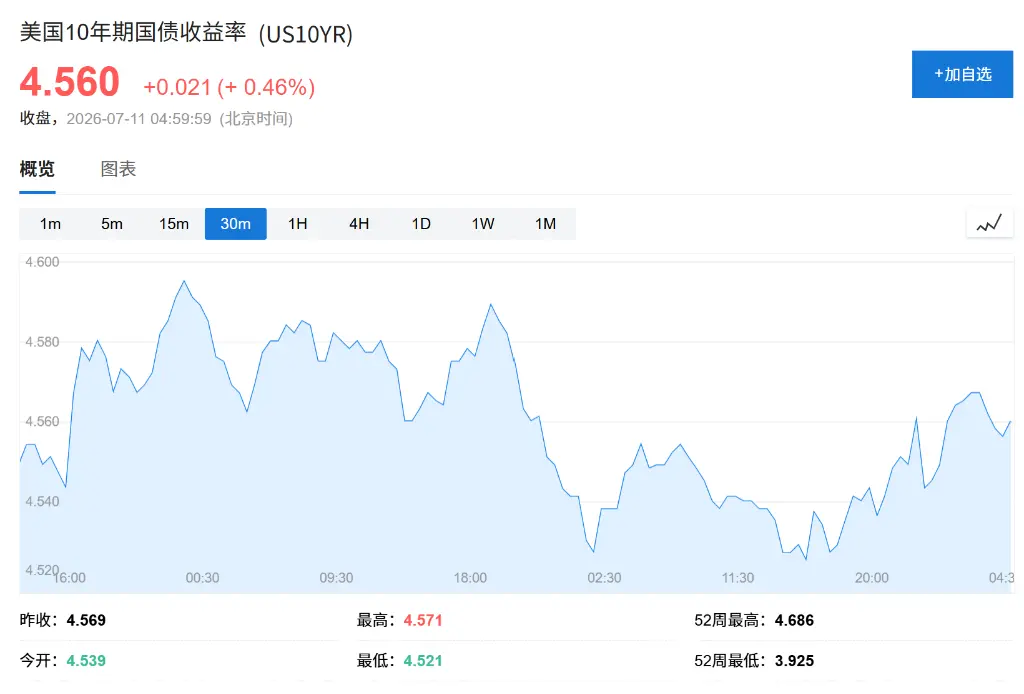
Oil price volatility stemming from geopolitical tensions is exerting sustained pressure on global stock markets. Brent crude prices have risen to just below $80 per barrel, a trend that could keep inflation expectations elevated and maintain the Fed's wait-and-see stance. Although interest rate hike expectations changed little after the release of the Fed meeting minutes, the 10-year U.S. Treasury yield has quietly climbed close to 4.6%. Rising volatility in the bond market is sending a negative signal to global equities, or at least capping further upside.
Citi's strategy team (including Alice Zheng) points out that the market's current positioning for higher oil prices is skewed, with Europe particularly vulnerable—due to its high reliance on imported energy and lower exposure to AI-benefiting assets. "If the oil price rally continues, the pullback in European equities could be quite significant, given the market has already largely priced in the end of the conflict," the strategists wrote.

Signals from the credit market are sounding an alarm about the current upward momentum in equities. Compared to equity indices hitting record highs, the narrowing of credit default swap (CDS) spreads has been quite limited; the credit market has not fully endorsed the stock market rally. As equities have recently corrected, the two have converged again. However, analysts believe that to support a stronger equity market rally, clearer signals of tightening from the credit market are needed.

In the face of the above risks, UBS recommends investors seek volatility opportunities at the single-stock level through pair-wise correlation trades. At the sector level, UBS believes the Technology, Energy, and Financial sectors in the U.S. market are most suitable for deploying paired volatility trades, while in the European market, Energy, Technology, and Consumer Discretionary sectors are recommended.


Пов'язані питання

QAccording to UBS, what is the current reading of the 'Turbu-lens' market fragility indicator and what does it imply for the market?

AAccording to UBS, the 'Turbu-lens' market fragility indicator currently reads 0.9, which is its highest level since mid-September 2025. This reading indicates 'extreme market fragility' and historically has often preceded a sharp, short-term surge in the VIX volatility index.

QWhat are the three main sources of pressure that have elevated market vulnerability to a recent high according to the article?

AThe three main sources of pressure are: 1) Geopolitical tensions, 2) Monetary policy expectations, and 3) Signals from the credit market.

QWhy is the current low level of the VIX index considered misleading by Barclays strategists?

ABarclays strategists consider the low VIX misleading because its recent decline coincides with a seasonal calendar window where price volatility typically narrows. They view this as a 'brief sweet spot' with limited durability, and believe the onset of the earnings season could push the VIX higher again.

QWhich investment strategy does the article suggest might offer better tactical opportunities during the earnings season, and why?

AThe article suggests that single-stock (or single-name) options might offer better tactical opportunities. This is because, with sector rotation and dispersion trades likely to persist during the earnings season, index-level hedging strategies may have limited effectiveness in navigating the market's internal divergences.

QWhat is the relationship between credit market signals (specifically CDS spreads) and the stock market rally, and what signal is needed for stronger equity gains?

ADespite the stock market rallying to record highs, the narrowing of Credit Default Swap (CDS) spreads has been relatively limited, meaning the credit market has not fully endorsed the equity gains. While they have recently converged, analysts believe that to support a more robust equity market advance, a clearer and more pronounced tightening signal from the credit markets is required.

Пов'язані матеріали

Bitcoin Boom in Full Swing: Saylor's Latest Statement Fuels Buying Speculation

MicroStrategy's Executive Chairman Michael Saylor has fueled speculation about a new Bitcoin purchase by posting "Bitcoin Drive engaged" on August 2, accompanied by the company's customary purchase tracker. This aligns with his pattern of hinting at treasury changes ahead of weekly reports. The accompanying report showed MicroStrategy's Bitcoin holdings at 843,775 BTC, with an average cost of $75,653 per coin and an unrealized loss of -$10.58B. A similar signal preceded the company's July 27 announcement, strengthening expectations for a treasury update on Monday. However, MicroStrategy's real-time ledger reflects two recent Bitcoin sales totaling 3,588 BTC, reducing holdings from 847,363 BTC to the current 843,775 BTC. The company stated these sales funded preferred stock dividends and replenished its U.S. dollar reserve. Recent reports indicate the company made no Bitcoin purchases the week ending July 26 while increasing its dollar reserve to approximately $3.75B. The company faces financial headwinds after reporting an $8.33B operating loss for Q2 2026, including an $8.32B unrealized loss on its digital assets. Management may sell up to $1.25B more in Bitcoin to meet cash obligations. The expected Monday update will reveal if the "Bitcoin Drive" signal marks a return to accumulation as MicroStrategy balances its massive Bitcoin stash against growing cash commitments.

cryptonews.ru2 год тому

Bitcoin Boom in Full Swing: Saylor's Latest Statement Fuels Buying Speculation

cryptonews.ru2 год тому

Торгівля

Спот
活动图片




