Author:Patrick Scott | Dynamo DeFi
Compiled by: Deep Tide TechFlow
In the past, the analysis of crypto assets mostly revolved around charts, hype cycles, and narratives. However, as the industry gradually matures, actual performance is more important than empty promises. You need a filter to help you distill truly valuable signals from the vast amount of information.
Fortunately, this filter already exists, and it's called Onchain Fundamentals.
Onchain fundamentals provide DeFi (Decentralized Finance) with a structural advantage over traditional finance (TradFi). This is not only one of the many reasons why "DeFi will win," but also a core concept that everyone who wants to invest in this industry must understand.
Over the past four years, I have been deeply immersed in the study of DeFi metrics, initially as a researcher and later working with the DefiLlama team. This article summarizes some of the most useful analytical frameworks I've learned during this time, hoping to help you start using these tools.
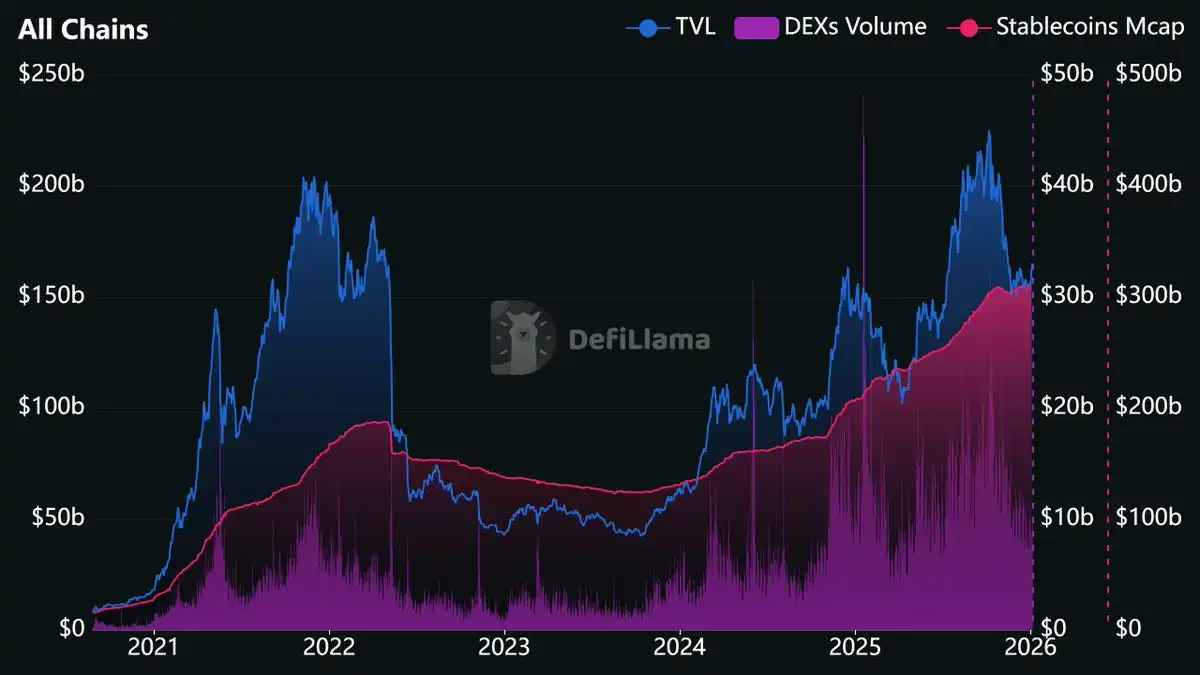
Source: https://defillama.com/?stablecoinsMcap=true&dexsVolume=true
Why are DeFi Metrics Important?
On-chain data is not just a breakthrough in evaluating crypto assets; it's a revolution in the entire field of financial data.
Think about how traditional investors evaluate companies: they have to wait for quarterly financial reports. And now, some are even proposing to change the frequency of financial reports from quarterly to semi-annually.
In contrast, the financial data of DeFi protocols is available in real-time. Websites like DefiLlama update relevant data daily or even hourly. If you want to track revenue by the minute, you can even query the blockchain data directly (although overly granular data might not be very meaningful, you do have that option).
This is undoubtedly a revolutionary breakthrough in transparency. When you buy stock in a listed company, you rely on financial data released by management after being audited by accountants, often with delays of weeks or even months. When you evaluate a DeFi protocol, you directly read the transaction records happening in real-time on an immutable ledger.
Of course, not every crypto project has fundamental data worth tracking. For example, for many "Memecoins" or "vaporware" projects with just a whitepaper and a Telegram group, fundamental analysis isn't very helpful (although other metrics like the number of holders might provide some reference).
But for those protocols that can generate fees, accumulate deposits, and distribute value to token holders, their operations leave a data trail that can be tracked and analyzed, often before market narratives form.
For instance, Polymarket's liquidity has been growing for years, a trend that started long before prediction markets became a hot topic.
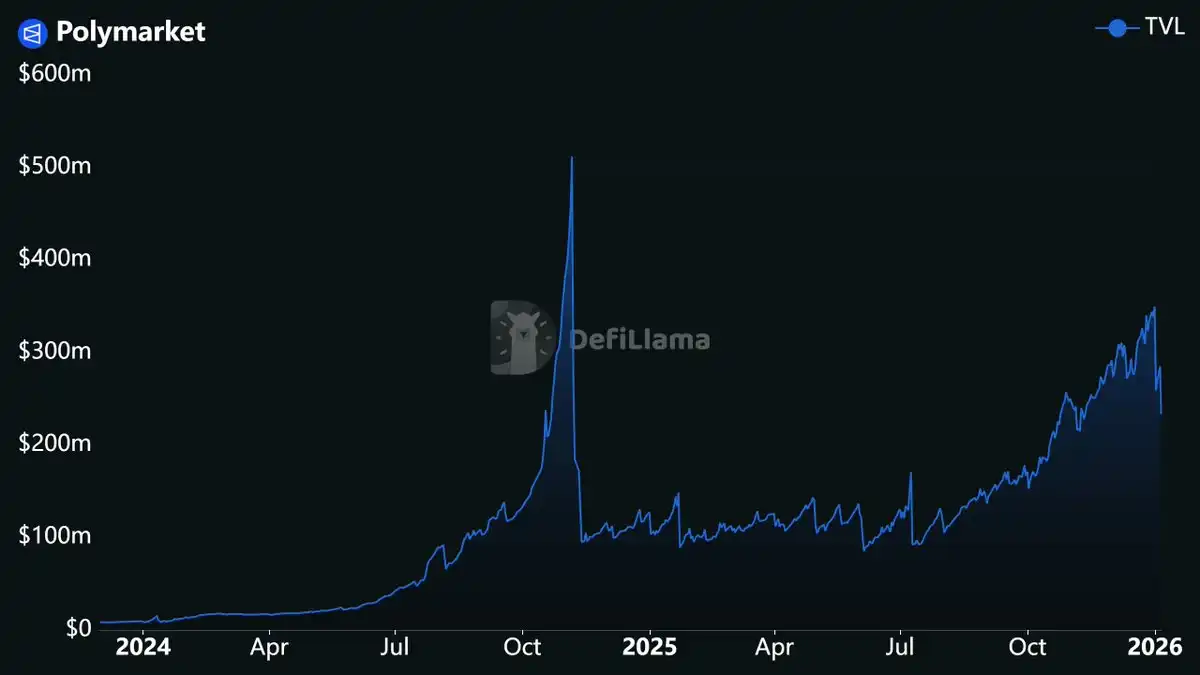
Source: https://defillama.com/protocol/polymarket
The explosive price growth of the HYPE token last summer stemmed from its consistently high revenue performance.
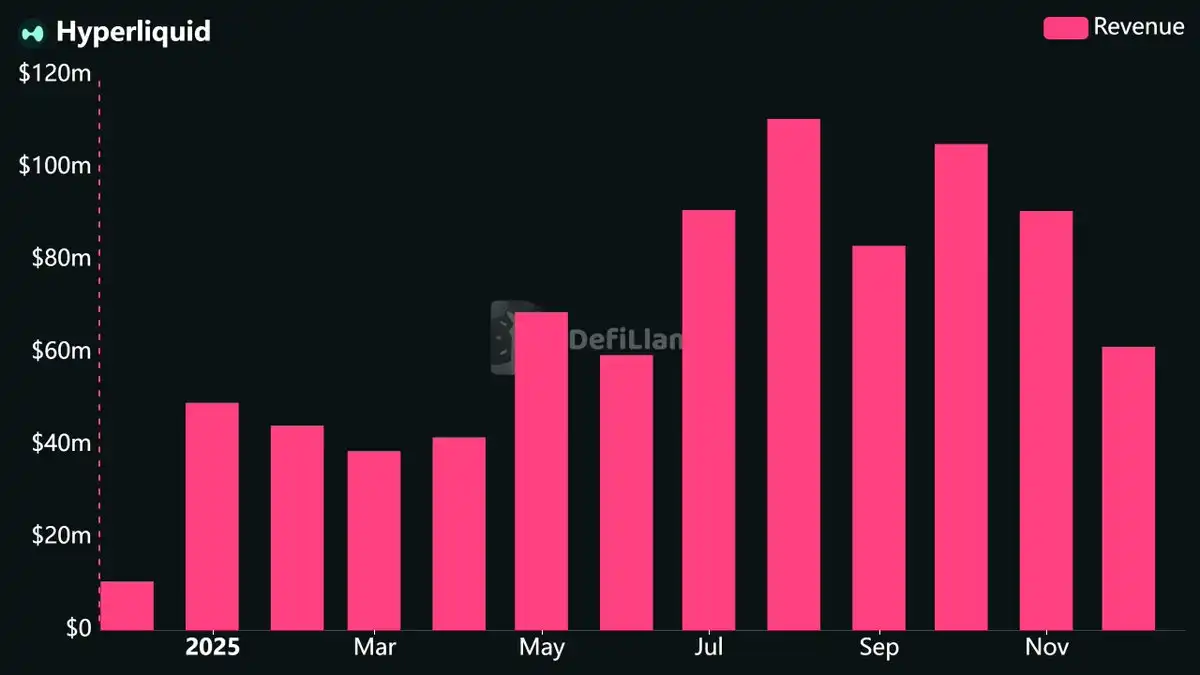
Source: https://defillama.com/protocol/hyperliquid?tvl=false&revenue=true&fees=false&groupBy=monthly
These metrics had long hinted at the future direction; you just needed to know where to look.
Core Metrics Explained
Let's start with the core metrics you need to understand for DeFi investing.
TVL (Total Value Locked)
TVL measures the total value of assets deposited into a protocol's smart contracts.
- For lending platforms, TVL includes collateral and supplied assets.
- For decentralized exchanges (DEXs), TVL refers to deposits in liquidity pools.
- For blockchain networks, TVL is the total value locked across all protocols deployed on that network.
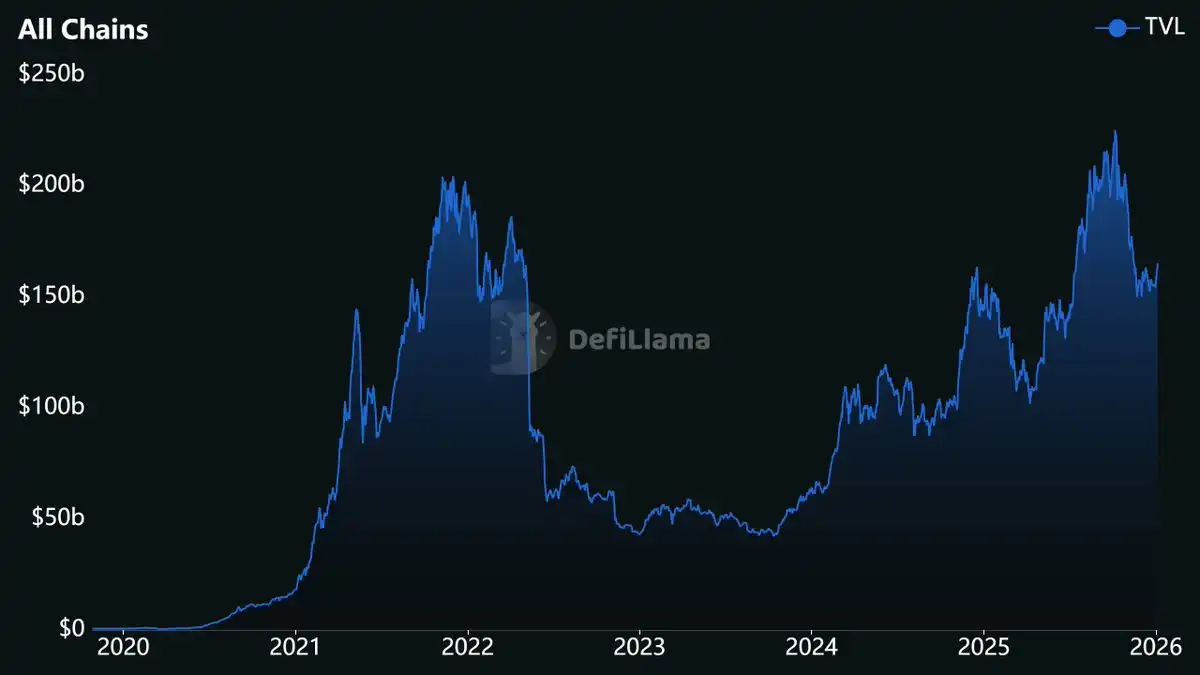
Source: https://defillama.com/
In traditional finance (TradFi), TVL is similar to Assets Under Management (AUM). Hedge funds report AUM to show the total amount of money clients have entrusted to them. TVL serves a similar purpose, reflecting the total amount of funds users have deposited into the protocol, indicating the level of trust users have in its smart contracts.
However, TVL has faced considerable criticism over the years, some of it justified.
- TVL does not measure activity. A protocol might have billions of dollars in TVL but generate almost no fees.
- TVL is highly correlated with token price. If the price of ETH drops 30%, the TVL of all protocols holding ETH will drop proportionally, even if no actual withdrawals occur.
Since most DeFi deposits are in volatile tokens, TVL is susceptible to price fluctuations. Therefore, savvy observers combine USD Net Inflows with TVL to distinguish between price changes and actual deposit activity. USD Net Inflows are calculated by taking the change in the balance of each asset between two consecutive days (multiplied by the price) and summing them up. For example, a protocol 100% locked in ETH would see its TVL drop 20% if ETH price drops 20%, but its USD Net Inflows would be $0.
Nevertheless, when TVL is presented in both USD and token terms, and combined with activity or productivity metrics, it still holds value. TVL remains an important tool for measuring protocol trust and the scale of the entire DeFi ecosystem. Just don't mistake it for a complete evaluation standard.
Fees, Revenue, and Holders' Revenue
In DeFi, the definitions of these terms differ from traditional accounting and can be confusing.
- Fees: From the user's perspective, fees are the cost you pay to use the protocol. For example, when you trade on a DEX, you pay a trading fee. This fee might go entirely to liquidity providers or partially to the protocol. Fees represent the total amount paid by users, regardless of where it ultimately goes. In traditional finance, this is equivalent to Gross Revenue.
- Revenue: Revenue refers to the protocol's share of the earnings. That is, out of all the fees users pay, how much does the protocol actually keep? This revenue might go to the protocol's treasury, team, or token holders. Revenue excludes fees distributed to liquidity providers. Think of it as the protocol's Gross Income.
- Holders' Revenue: This is a narrower definition, tracking only the portion of revenue distributed to token holders through buybacks, fee burns, or direct staking rewards. In traditional finance, this is similar to a combination of dividends and stock buybacks.
These distinctions are crucial for valuation. Some protocols may generate substantial fees but end up with little revenue because almost all fees are distributed to liquidity providers.
DefiLlama has now released full income statements for many protocols. These statements are automatically updated based on on-chain data, breaking down revenue into different items and redefining these metrics in standard accounting language.
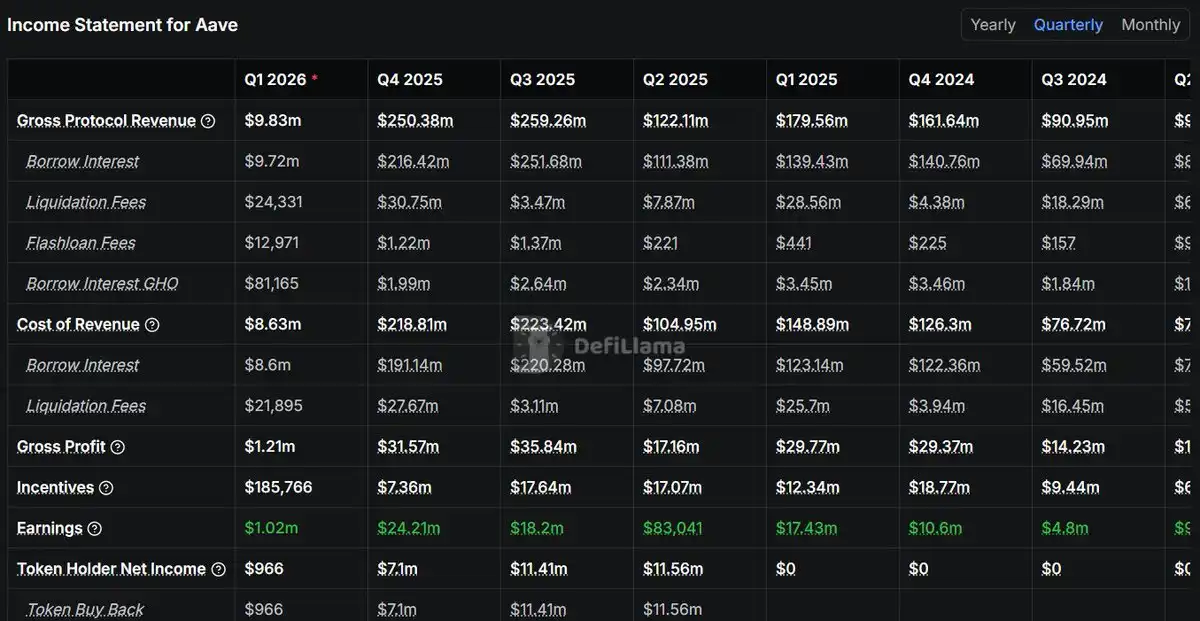
Source: https://defillama.com/protocol/aave
These income statements also come with fund flow visualizations, showing how money flows from users into the protocol and is then distributed to various stakeholders. This information is worth exploring if you want to delve deeper into a specific project's economic model.
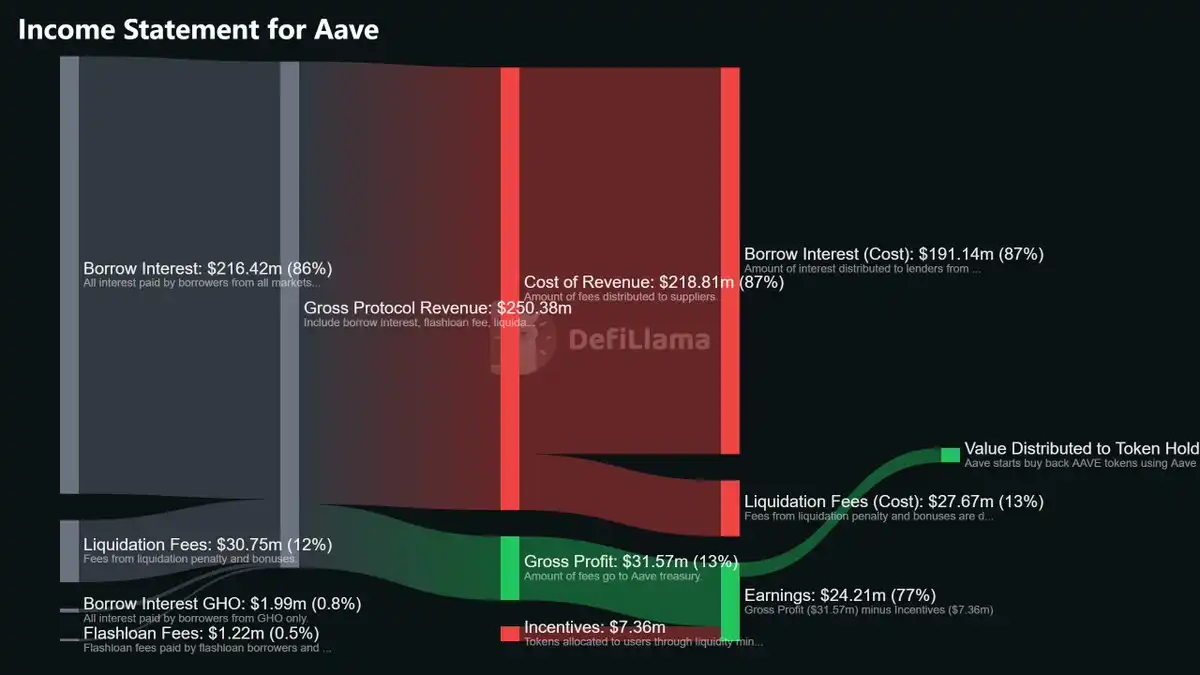
Source: https://defillama.com/protocol/aave
Volume
Volume is used to track the scale of trading activity.
- DEX Volume: Counts all token swaps on decentralized exchanges (DEXs).
- Perpetuals Volume (Perp Volume): Counts the total trading volume on all perpetual futures trading platforms.
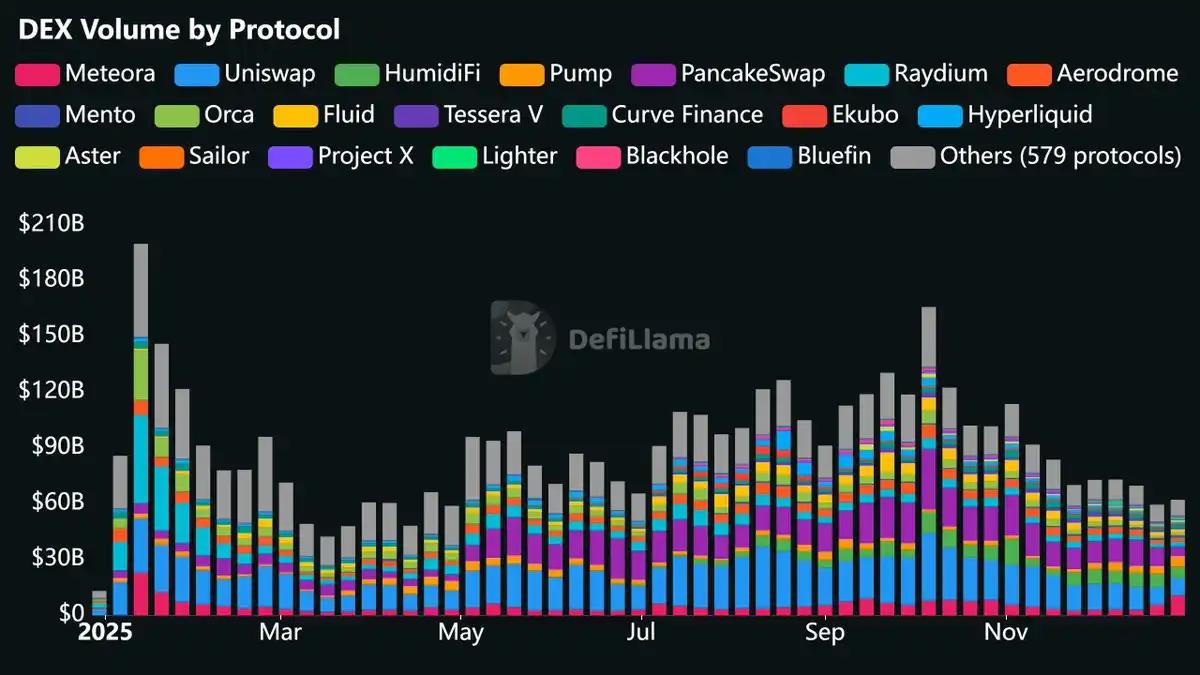
Source: https://defillama.com/pro/97i44ip1zko4f8h
Volume is a key metric for measuring overall participation in the crypto market. When people are actively using digital assets, they trade. Surges in volume are often associated with shifts in market sentiment, whether it's frenzied buying during a bull run or panic selling.
Compared to previous cycles, perpetual futures volume has grown significantly. In 2021, perpetual futures exchanges were barely a presence. Today, platforms like Hyperliquid, Aster, and Lighter handle billions of dollars in daily volume. Due to the rapid growth of this sector, comparing it to historical data is of limited value. For instance, comparing current perpetual volume to 2021 data only shows that the sector has expanded, without providing much valuable insight.
Within a category, the trend in market share change is more important than absolute volume. For example, a perpetual DEX increasing its market share from 5% to 15% indicates an actual gain in market position, even if its absolute volume decreases. DefiLlama's library of custom dashboards offers many market share charts worth checking out.
Open Interest (OI)
Open Interest refers to the total value of derivative contracts that have not been closed or liquidated. For perpetual DEXs, open interest represents all open positions that haven't been closed or liquidated.
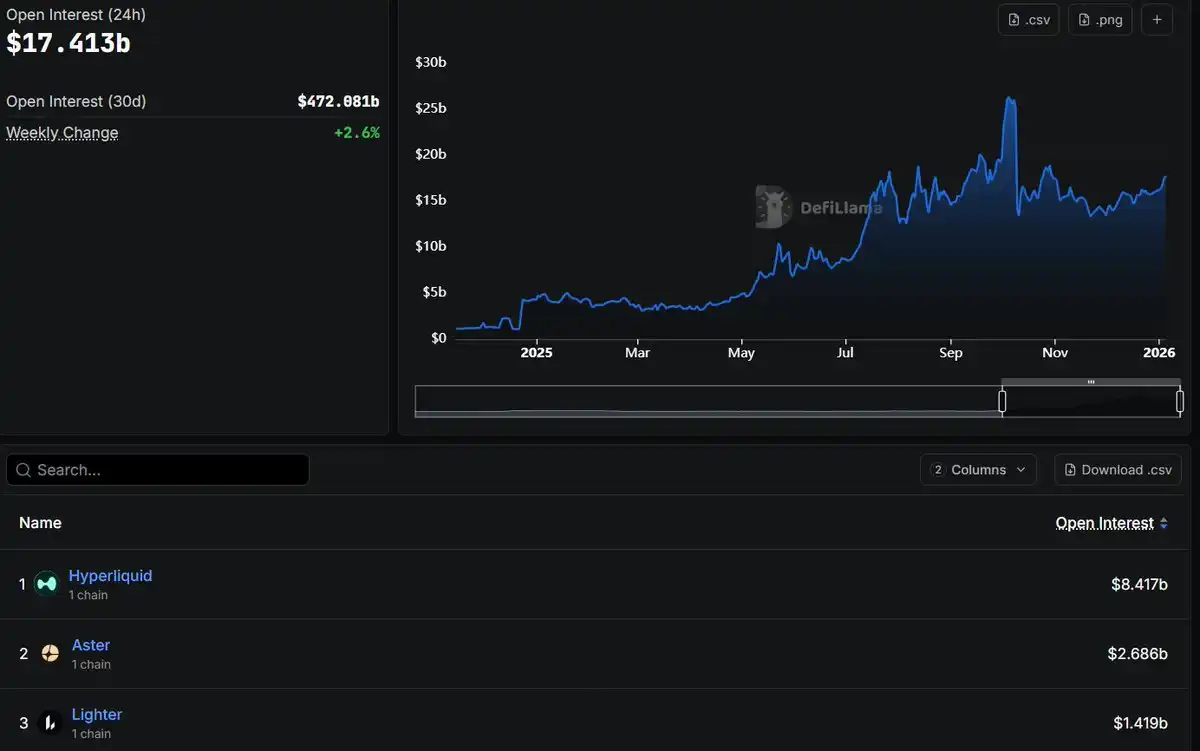
Source: https://defillama.com/open-interest
Open Interest is an important metric for measuring the liquidity of derivative platforms. It reflects the total amount of capital deployed in active perpetual positions.
During periods of market volatility, this metric can collapse quickly. A large wave of liquidations can wipe out open interest in a matter of hours. Tracking the recovery after such events can show whether a platform can regain liquidity or if the capital has permanently migrated elsewhere.
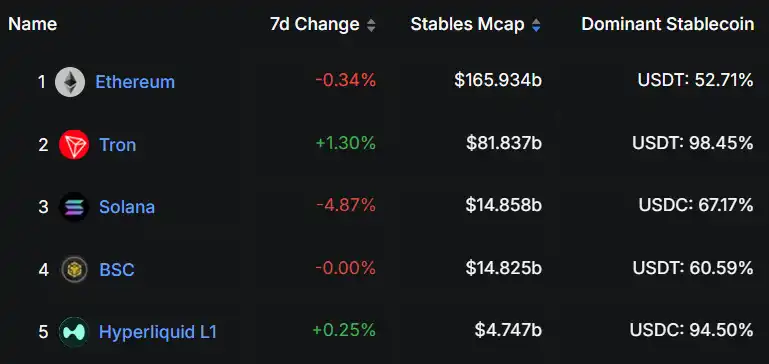
Stablecoin Market Cap
For a blockchain network, the stablecoin market cap is the total value of all stablecoins deployed on that network.
Source: https://defillama.com/stablecoins/chains
Stablecoin market cap is a key metric for measuring capital inflows. Unlike TVL, which is affected by token price volatility, stablecoins represent real dollars (or dollar equivalents) that users have actually bridged onto the chain. For example, if the stablecoin market cap on a chain grows from $3 billion to $8 billion, it means $5 billion in real capital has flowed into that ecosystem.
Since October 2023, approximately $180 billion has flowed into the crypto market in the form of stablecoins. A portion of this inevitably enters DeFi, driving TVL growth, increased volume, and fee generation. Stablecoin flows are akin to capital inflows in a national economy; an increase in stablecoin supply signifies new money entering, while a decrease indicates capital outflow.
App Revenue & App Fees
App Revenue and App Fees are chain-level metrics that count the revenue and fees generated by all applications deployed on that chain, excluding stablecoins, liquid staking protocols, and Gas fees.
I consider this the "GDP" of a blockchain, showcasing the scale of actual economic activity happening within its ecosystem.
Revenue metrics are among the hardest data to fake because they require users to actually pay money. This makes them a high-signal indicator for judging the activity level of a DeFi ecosystem.
It's important to note that you cannot base valuation on app revenue, as valuing an asset based on revenue not directly linked to it is meaningless. App Revenue and App Fees are better suited for diagnosing whether a chain is growing, not for assessing its value.
How to Effectively Interpret These Metrics?
Understanding individual metrics is the first step, but to use them effectively, you need an analytical framework. I tend to use the following three-step analysis method:
- Prioritize sustained, stable growth.
- Track both stock and flow metrics simultaneously.
- Consider the impact of token unlocks and incentives.
1. Prioritize Sustained, Stable Growth
Protocols whose revenue charts show a brief spike followed by a rapid crash do not demonstrate sustainable value creation. I've seen countless protocols set weekly revenue records only to disappear a month later.
What truly matters is stable growth over a longer time horizon. For example, a protocol whose monthly revenue gradually grows from $500,000 to $2 million over six months indicates sustainable growth. A protocol whose revenue suddenly spikes to $5 million one week but then quickly drops to $300,000 is likely just a flash in the pan.
In the crypto industry, time passes much quicker than in traditional markets. Here, one month of sustained growth is roughly equivalent to a quarter in traditional markets. If a protocol's revenue grows consistently for six months, consider it akin to a company with six consecutive quarters of earnings growth. That kind of performance is worth paying attention to.
2. Track Both Stock and Flow Metrics Simultaneously
- Stock Metrics: Such as TVL, Open Interest, Stablecoin Market Cap, Treasury, etc., tell you how much capital is deposited in the protocol.
- Flow Metrics: Such as Fees, Revenue, Volume, etc., tell you the actual level of activity within the protocol.
Both are equally important.
Activity is easier to fake. For example, a protocol can artificially inflate volume through incentives or wash trading, and such temporary spikes are not uncommon. Liquidity, however, is much harder to manufacture. Getting users to actually deposit funds and keep them there long-term requires real utility or attractive yields from the protocol.
When evaluating any protocol, analyze at least one stock metric and one flow metric. For example:
- For a perpetual DEX, choose Open Interest and Volume.
- For a lending protocol, choose TVL and Fees.
- For a blockchain, choose Stablecoin Market Cap and App Revenue.
If both types of metrics show growth, the protocol is genuinely expanding. If only activity metrics are growing while liquidity stagnates, dig deeper—there might be manipulation. If only liquidity is growing while activity stagnates, it might indicate deposits are coming from a few "whales."
3. Consider Token Unlocks and Incentives
Token unlocks create sell pressure. A portion of the vested tokens released weekly by a protocol will always be sold. If there is no other source of demand to offset this selling, the token price will fall.
Before investing, check the token's unlock schedule. A protocol with 90% of its tokens already in circulation has little future dilution pressure. The investment risk is entirely different for a protocol with only 20% circulating supply facing a large unlock in three months.
Similarly, high revenue looks less impressive if the protocol distributes more in token incentives than it earns from users. DefiLlama tracks this through the "Earnings" metric, which deducts incentive costs from revenue. For example, a protocol might generate $10 million in annual revenue but distribute $15 million in token rewards.
While incentives are an effective strategy for early-stage protocol growth and are often necessary at the beginning of a protocol's lifecycle, they do create sell pressure that needs to be offset by other demand.
Learn More
This article outlines the most common DeFi metrics you'll encounter, but this is just the tip of the iceberg; there's much more to explore by diving deeper.
I've published a full DefiLlama tutorial on YouTube, detailing how to use the platform: screening for undervalued protocols, evaluating blockchains, discovering emerging projects, and avoiding common analytical mistakes. You can watch it by clicking here (link placeholder, original Chinese text had "点击这里观看").
If you want to continuously receive guides on DeFi analysis, portfolio construction, and on-chain research, I regularly post content on my Substack. Welcome to visit newsletter.dynamodefi.com.
The data is right in front of you; the key is whether you will put it to good use.






