Tracking Volatility Regimes: Gamma Exposure Heatmap

insights.glassnodeОпубліковано о 2026-02-24Востаннє оновлено о 2026-02-24

Анотація

Glassnode introduces a new Gamma Exposure (GEX) Strike Heatmap, a proprietary tool designed to track how dealer hedging flows influence crypto market volatility over time. Unlike static snapshots, this visualization shows how gamma exposure shifts across strike prices as markets move, helping traders identify volatility regimes are likely to change. GEX measures whether dealers are net long (positive GEX) or short (negative GEX) gamma. Positive GEX acts as a volatility dampener, leading to range-bound conditions, while negative GEX accelerates price moves, often causing liquidity cascades. The heatmap reveals key features like persistent positive gamma “walls” that stabilize price and expanding negative zones that signal potential breakouts. An accompanying chart tracks total GEX over time, indicating whether the market is in a high or low volatility regime based on dealer positioning. Available for BTC, ETH, XRP, and SOL in Glassnode Studio, this tool offers systematic and discretionary traders deeper insight into how options flows affect short-term price action.

As crypto options markets continue to grow, dealer hedging flows are becoming a more relevant driver of short-term price behavior. Knowing where those flows may absorb movement or reinforce it can materially improve volatility context.

Building on our foundational work in gamma exposure, Glassnode is proud to introduce a sophisticated new metric: the Gamma Exposure (GEX) Strike Heatmap.

Unlike a single snapshot view, this feature tracks the distribution of gamma exposure across strike levels over time, showing how dealer positioning shifts as the market moves.

This is a proprietary visualization methodology available exclusively on Glassnode, designed to give systematic traders and volatility professionals a temporal edge in understanding how options positioning influences price action.

Explore the live metrics in Glassnode Studio. Now available for BTC, ETH, XRP, and SOL to all Professional plan users.

Visit metrics

What is Gamma Exposure and Why it Matters

Gamma Exposure (GEX) measures how options dealers' hedging flows respond to price movements. When markets move, option deltas shift (this is gamma), forcing dealers to rebalance their positions by trading futures or spot. These flows create structural feedback loops that either dampen or amplify price action.

  • Long Gamma (Positive GEX): When dealers are net long options, they act as volatility dampeners. To stay neutral, they must sell as prices rise and buy as prices fall. This counter-cyclical trading creates resistance to large moves, often resulting in a "rangy" or stable price action.
  • Short Gamma (Negative GEX): When dealers are net short options, they act as volatility accelerators. To stay neutral, they must buy as prices rise and sell as prices fall. This pro-cyclical trading adds fuel to the fire, turning small moves into liquidity cascades.

We have developed an internal methodology to estimate dealer gamma exposure using a taker-flow approach. For a detailed explanation, refer to this article.

Why the Gamma Exposure Heatmap?

Most gamma dashboards in the industry show only a single snapshot in time. A current GEX snapshot tells you where dealer hedging pressure exists right now, but it doesn’t show how that pressure shifts. And markets are dynamic.

As price moves:

  • Strikes that are heavily gamma-positive today can fall out of the money tomorrow;
  • New gamma concentrations emerge;
  • Gamma “walls” strengthen or weaken as open interest builds or decays.

As time passes:

  • Expirations cause GEX to collapse or redistribute.

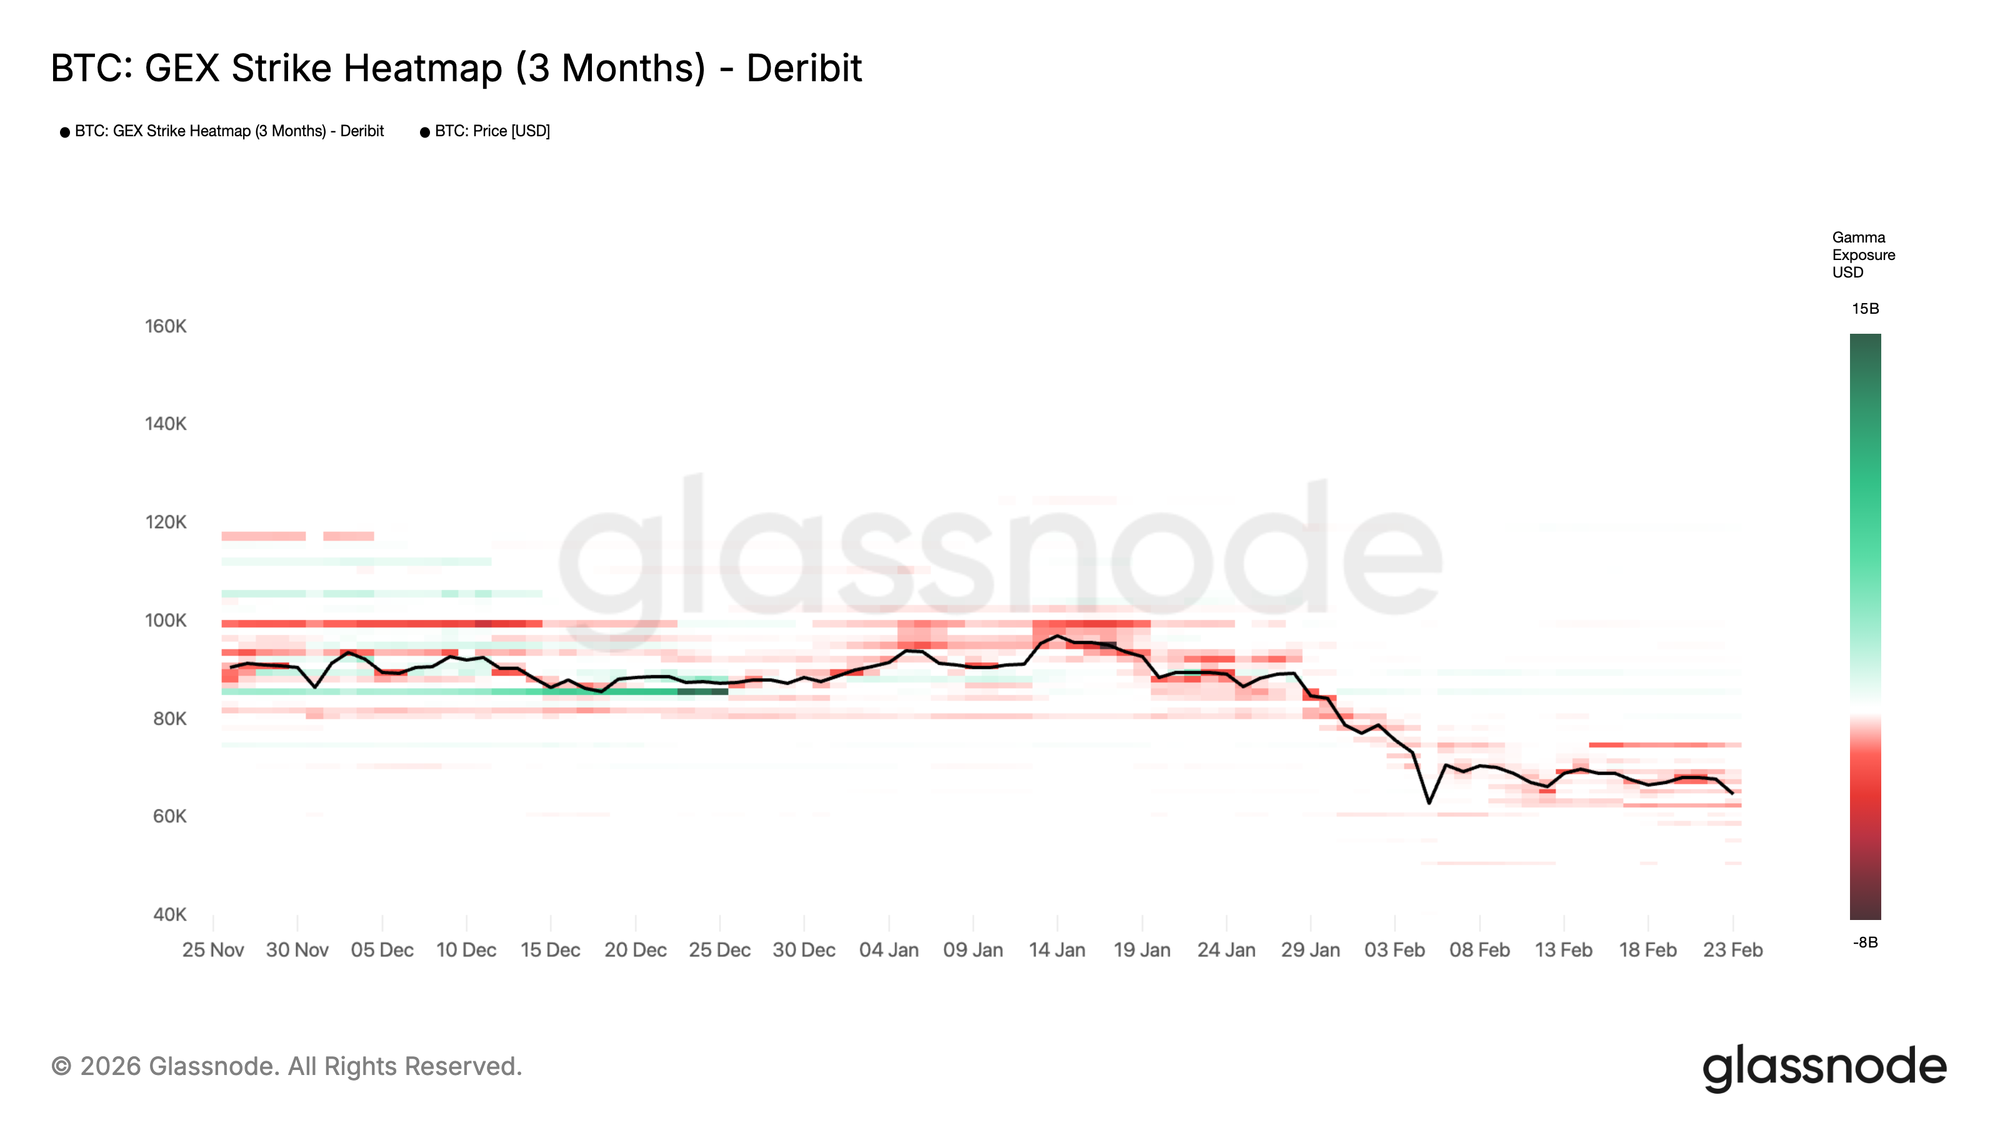
The GEX Strike Heatmap captures these changes, showing how GEX evolves.
Visit Live Chart

Gamma Exposure Heatmap Case Study

The GEX Heatmap provides a clear narrative of market sentiment that spot price alone cannot convey.

Persistent positive bands (green):

In the heatmap above, distinct green horizontal bands around 85k mid-December 2025 acted as gamma “walls”. These are price levels where dealers are heavily incentivized to suppress volatility. As long as price remains pinned here, we expect choppy, range-bound conditions.

What to look for:

  • Width of the band: Wider bands suggest a broader range of strikes with positive GEX, indicating a larger stabilization zone;
  • Duration: Bands that persist over days/weeks are more structurally significant than fleeting concentrations;
  • Proximity to spot: When price trades within a positive band, expect choppy, range-bound conditions.

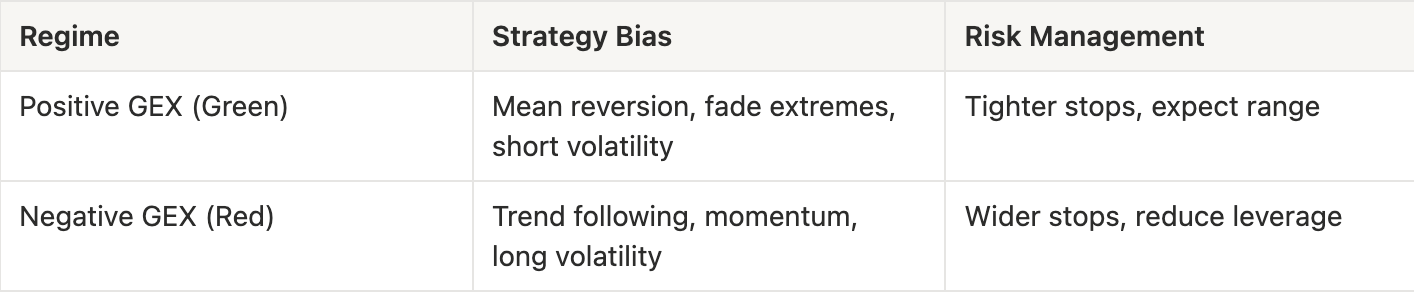
Trading implications: Mean-reversion strategies tend to work well. Fading rallies and buying dips into these zones aligns with dealer hedging flows. Breakout attempts often fail or produce false breaks.

Expanding negative zones (red):

In the recent down-leg (January-February 2026), the heatmap shifts toward stronger red bands around and below spot, while aggregate GEX turns more negative. This is consistent with a short-gamma environment, where hedging flows can reinforce downside pressure and volatility expansion.

What to look for:

  • Negative zones approaching spot: This is a warning sign for volatility expansion;
  • Increasing intensity (darker red): Growing short gamma concentration amplifies the potential for acceleration;
  • Negative zone below support levels: If price breaks into these zones, hedging flows will reinforce downside.

Trading implications: Reduce leverage, widen stops, or position for momentum trades. Mean-reversion becomes riskier. This environment favors trend-following and volatility-long positions.
Total GEX Over Time: A Volatility Lens

While the strike heatmap reveals where GEX concentrates, a natural question emerges: What is the net positioning across all strikes? Is the market, on aggregate, in a long-gamma or short-gamma regime? This is where Total GEX Over Time completes the picture.

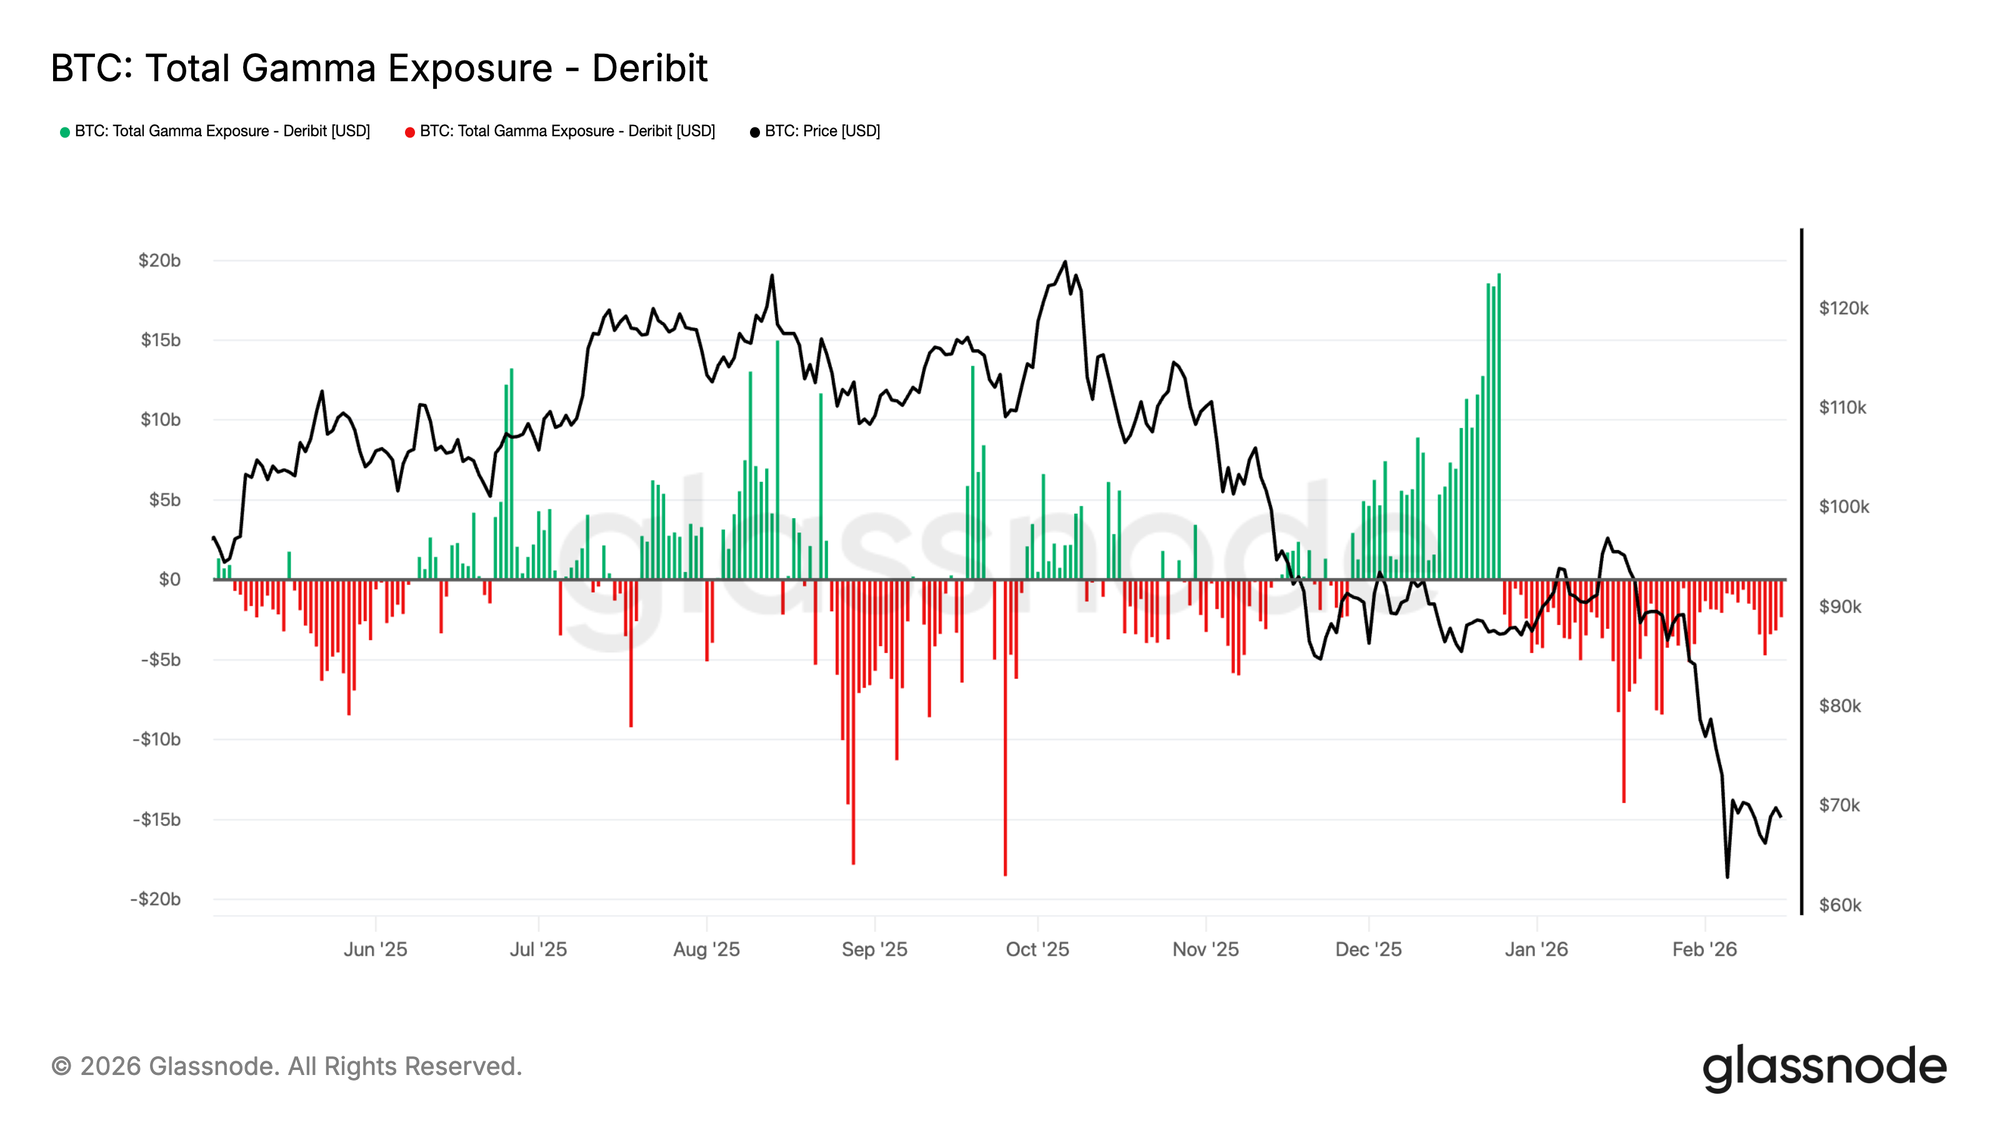
Total GEX Over Time shows whether market-makers are net long or short gamma, serving as a critical regime indicator. In the chart below, we can clearly observe Bitcoin's aggregate gamma exposure evolution. Green bars represent positive total GEX (market-makers net long gamma), red bars represent negative total GEX (market-makers net short gamma), overlaid with spot price.

This gives a high-level regime read:

  • Positive regime (green): When total GEX is strongly positive, dealer hedging flows are net stabilizing. The market tends toward lower realized volatility, with hedging flows absorbing shocks. This often coincides with consolidation phases or range-bound trading.
  • Negative regime (red): When total GEX is negative, dealer flows amplify moves. Realized volatility tends to expand, breakouts become more decisive, and price can "gap" through levels more easily.
  • Regime transitions: The moments when total GEX crosses zero, flipping from positive to negative or vice versa, often mark inflection points in volatility behavior. These transitions can precede breakouts, sudden volatility expansions, or the establishment of new trading ranges.
Visit Live Chart

Interpreting the Chart

Looking at the example above, we see:

  1. August-November 2025: Predominantly negative GEX (red) corresponds with the price decline from 120k to ~80k, indicating amplifying dealer flows that reinforced downward momentum.
  2. December 2025-January 2026: Shift toward positive GEX (green) as price bottomed and consolidated, showing stabilizing flows that supported range formation.
  3. Late January 2026: Return to negative GEX during renewed weakness, suggesting the market remained structurally positioned for volatility expansion.

Conclusion

Whether you are a discretionary trader looking for sticky support levels, or a systematic fund utilizing our API to detect volatility regimes, the GEX Strike Heatmap provides a new dimension of market clarity. By visualizing the changing landscape of dealer incentives, you can better identify when the market is primed to consolidate, and when it is ready to explode.

If you want to learn more about our options data and metric offer, or gain access to these metrics, contact our dedicated team today.


  • Follow us on X for timely market updates and analysis
  • Join our Telegram channel for regular market insights
  • For on-chain metrics, dashboards, and alerts, visit Glassnode Studio

Disclaimer: This report is for informational and educational purposes only. The analysis represents a limited case study with significant constraints and should not be interpreted as investment advice or definitive trading signals. Past performance patterns do not guarantee future results. Always conduct thorough due diligence and consider multiple factors before making investment decisions.


Пов'язані питання

QWhat is Gamma Exposure (GEX) and how does it influence market volatility?

AGamma Exposure (GEX) measures how options dealers' hedging flows respond to price movements. When dealers are net long options (positive GEX), they act as volatility dampeners by selling as prices rise and buying as prices fall, creating stable price action. When dealers are net short options (negative GEX), they act as volatility accelerators by buying as prices rise and selling as prices fall, amplifying price movements and potentially causing liquidity cascades.

QHow does the Gamma Exposure Strike Heatmap differ from traditional gamma dashboards?

ATraditional gamma dashboards show only a single snapshot of gamma exposure at a specific time, while the Gamma Exposure Strike Heatmap tracks the distribution of gamma exposure across strike levels over time. This allows traders to see how dealer positioning shifts as the market moves, including how gamma concentrations emerge, strengthen, weaken, or expire, providing a dynamic view of market structure.

QWhat do persistent green bands on the Gamma Exposure Heatmap indicate?

APersistent green bands on the heatmap indicate gamma 'walls' where dealers are heavily incentivized to suppress volatility. These bands suggest price levels where choppy, range-bound conditions are expected. Key characteristics to note include the width of the band (indicating the size of the stabilization zone), its duration (longer persistence means greater structural significance), and proximity to spot price.

QWhat trading implications are associated with expanding red zones on the heatmap?

AExpanding red zones indicate a short-gamma environment where dealer hedging flows can reinforce downside pressure and volatility expansion. In such conditions, traders should reduce leverage, widen stops, or position for momentum trades. Mean-reversion strategies become riskier, while trend-following and volatility-long positions are favored. Negative zones approaching spot price or below support levels are particularly significant warning signs.

QHow does Total GEX Over Time function as a volatility regime indicator?

ATotal GEX Over Time shows whether market-makers are net long or short gamma across all strikes, serving as a critical regime indicator. Positive total GEX (green) indicates a stabilizing regime with lower realized volatility and shock-absorbing flows, often during consolidation phases. Negative total GEX (red) indicates an amplifying regime with expanded realized volatility and more decisive breakouts. Transitions between these regimes often mark inflection points in market volatility behavior.

Пов'язані матеріали

Only 153 Venture Capital Firms Invested in July: Is the Crypto VC Industry Experiencing a 'Mass Extinction'?

In July 2026, only 153 unique venture capital firms participated in disclosed crypto funding rounds, marking the lowest monthly count since November 2020. This figure represents an 87% decline from the peak of 1,177 firms in 2022. Overall, the first seven months of 2026 saw crypto projects raise approximately $11.78 billion across 481 rounds. This crypto VC contraction contrasts sharply with the broader venture capital landscape, where global VC investment reached a record $560.4 billion in H1 2026, heavily fueled by major AI company financings. This shift in capital allocation has drawn funds away from the crypto sector. Within crypto, funding is highly concentrated. Trading platforms, prediction markets, and payment sectors absorbed 53% of the total capital. While early-stage deals remain frequent, the largest sums flow to a few late-stage rounds and mergers & acquisitions, which surged to $7.23 billion in Q2 2026. The market is consolidating around top funds like a16z crypto and Dragonfly, which successfully raised new multi-billion dollar funds, while many smaller firms have retreated. Analysts describe this as a "great extinction" for crypto VCs, where capital is becoming more selective, favoring proven business models and assets over early-stage speculation. This raises the bar for project quality, funding efficiency, and viable exit paths.

marsbit2 хв тому

Only 153 Venture Capital Firms Invested in July: Is the Crypto VC Industry Experiencing a 'Mass Extinction'?

marsbit2 хв тому

Strategy's Loss in the Second Quarter Reaches $8.22 Billion Amid Bitcoin Decline

Strategy, the largest corporate holder of Bitcoin, reported a net loss of $8.22 billion for the second quarter. This loss was primarily driven by an $8.32 billion unrealized loss on its Bitcoin holdings due to a decline in the asset's price during the period. Despite these paper losses, the company increased its Bitcoin holdings to 843,775 BTC, a 25% growth since the start of the year. As part of a new monetization strategy, Strategy sold approximately $218.4 million worth of Bitcoin, mainly to fund dividends for preferred shareholders, with $216 million of that sold after Q2 ended. The company also built a $3.75 billion cash reserve, which it claims is sufficient to cover over two years of dividend and interest payments, aiming to insulate itself from Bitcoin's volatility while meeting obligations. Following the earnings release, Strategy's stock (MSTR) rose 4.7% in regular trading but corrected slightly after-hours. This pattern reflects how the company's accounting results are heavily tied to Bitcoin's price swings, even as its long-term strategy remains unchanged. The report indicates that Strategy is maintaining its core strategy of accumulating Bitcoin while building a financial buffer. This quarterly loss follows a recognizable pattern, with the company posting significant unrealized losses in previous quarters (e.g., $12.4 billion in Q4 2025 and ~$12.5 billion in Q1 2026) due to fair-value accounting. A key technical shift is its new monetization program, which introduces periodic selling pressure on the market, transitioning Strategy from a pure accumulator to a participant that occasionally adds supply. A critical question remains: how long can the cash reserve cover dividend obligations if a Bitcoin price downturn persists beyond two years?

cryptonews.ru22 хв тому

Strategy's Loss in the Second Quarter Reaches $8.22 Billion Amid Bitcoin Decline

cryptonews.ru22 хв тому

Will Terrorist Durov Ban Russian Officials?

Telegram founder Pavel Durov publicly reacted to being labeled a "terrorist" by Russian authorities, stating the designation came after he refused demands for mass surveillance and censorship on the platform. In a Telegram post, he highlighted that this status formally bans him from "publishing information online." Durov concluded with a statement widely circulated: Russian officials "clearly don't understand who can ban whom on the internet." This remark suggests Durov could potentially restrict official Russian government and officials' channels on Telegram, which continue to operate on the platform despite its formal blocking in Russia. The situation parallels previous, slow-moving state directives, like switching officials to domestic cars, contrasted with the current push to migrate all government communication to the Russian-made messenger MAX by 2030. However, reports indicate many officials still use Telegram via workarounds, fearing surveillance on MAX, while alternatives like BiP and KakaoTalk recently became inaccessible in Russia without a VPN. Durov has not specified any immediate actions against state channels. His statement is an initial response, with further developments depending on the authorities' reaction. The dynamic differs from 2020 when Russian regulators lifted a block on Telegram; now, Durov implies control from within the platform itself over the official accounts that persisted through that earlier blockade.

cryptonews.ru22 хв тому

Will Terrorist Durov Ban Russian Officials?

cryptonews.ru22 хв тому

DeepSeek V4 Official Version Arrives, New Capabilities Emerge, Value-for-Money King Enters the Fray

On July 31st, DeepSeek officially launched the public API beta for its DeepSeek-V4-Flash model. A key highlight is its performance on multiple Agent benchmark tests, reportedly nearing or even surpassing the level of the V4-Pro preview version from three months ago. Notably, the Flash model achieves this with significantly smaller scale (130B active parameters vs. Pro's 490B), suggesting that post-training optimization and data quality may be as crucial as raw model size. DeepSeek emphasized that the V4-Flash-0731 uses the same model architecture and size as its preview version, with improvements attributed solely to "re-trained post-training." The update also marks the official debut of DeepSeek's self-developed Agent framework, "Harness." The move signals DeepSeek's strategic push to position its cost-effective Flash model as a competitive base for Agent applications—scenarios requiring autonomous planning, tool usage, and complex task execution—where inference speed and cost are critical. By natively supporting OpenAI's Responses API format and adapting for code-generation scenarios, DeepSeek aims not just to be a cheaper alternative but to establish its own ecosystem in the Agent era. This release follows DeepSeek's record-breaking ~$50 billion fundraising round roughly two months prior, underscoring market confidence in its technology and commercialization prospects. The company is reportedly preparing for another funding round at a valuation of approximately $71 billion. The Flash model's advancement represents a step in fulfilling the high expectations that come with this valuation, setting the stage for the impending release of the V4-Pro official version and intensifying competition in the global Agent landscape.

marsbit26 хв тому

DeepSeek V4 Official Version Arrives, New Capabilities Emerge, Value-for-Money King Enters the Fray

marsbit26 хв тому

Торгівля

Спот
活动图片