Thin Profit Business? No, DeFi Lending Protocols Are the Underestimated 'King of Value'

marsbitОпубліковано о 2025-12-25Востаннє оновлено о 2025-12-25

Анотація

In the DeFi lending ecosystem, protocols like Aave and SparkLend capture more value than downstream vaults and even upstream asset issuers, challenging the notion that distribution is king. Despite perceptions of thin margins, lending protocols generate higher revenues than the vaults built on top of them. For example, Ether.fi’s vault pays Aave $4.5M in annual interest fees while earning only $1.07M in platform fees. Similarly, Fluid and Mellow vaults contribute significantly more value to lending protocols than they capture themselves. Even compared to asset issuers like Lido, lending protocols often yield greater economic benefits due to their central role in the credit stack. The true moat of lending protocols lies in their position as the highest value-capture layer in the on-chain credit value chain.

Original Title: Why the defi lending moat is bigger than you think

Original Author: Silvio, Crypto Researcher

Original Compilation: Ding Dang, Odaily Planet Daily

As the market share of Vaults and Curators continues to grow in the DeFi world, the market has begun to question: Are lending protocols being squeezed for profit margins? Is lending no longer a good business?

But if we shift our perspective back to the entire on-chain credit value chain, the conclusion is quite the opposite. Lending protocols still occupy the most solid moat in this value chain. We can quantify this with data.

On Aave and SparkLend, the interest fees that Vaults pay to lending protocols actually exceed the revenue generated by the Vaults themselves. This fact directly challenges the mainstream narrative that "distribution is king."

At least in the lending space, distribution is not king.

Simply put: Aave not only earns more than the various Vaults built on top of it, but also more than the asset issuers used for lending, such as Lido and Ether.fi.

To understand why, we need to deconstruct the complete value chain of DeFi lending and re-examine the value capture capabilities of each role by following the flow of funds and fees.

Deconstructing the Lending Value Chain

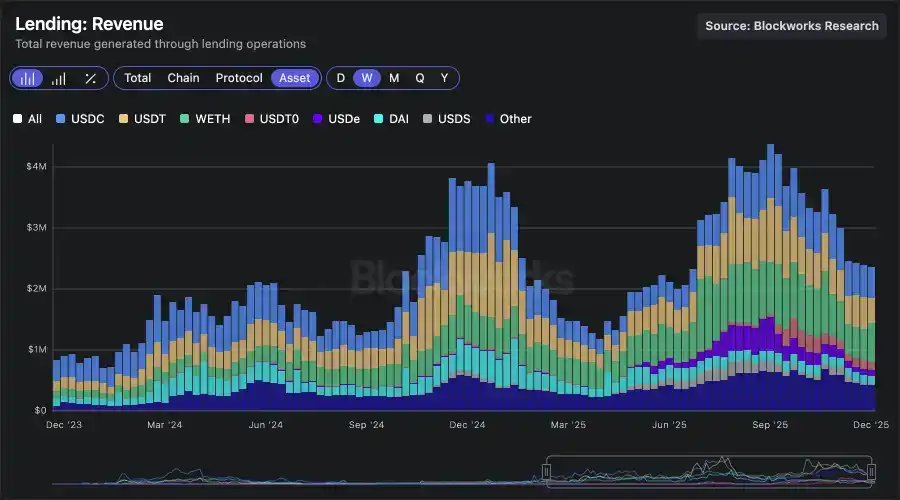
The annualized revenue scale of the entire lending market has exceeded $100 million. This value is not generated by a single link but is co-created by a complex stack: the underlying settlement blockchain, asset issuers, capital lenders, the lending protocol itself, and the Vaults responsible for distribution and strategy execution.

As mentioned in previous articles, a large number of use cases in the current lending market originate from basis trading and liquidity mining opportunities, and we have deconstructed the main strategy logic.

So, who is actually "demanding" the capital in the lending market?

I analyzed the top 50 wallet addresses on Aave and SparkLend and labeled the main borrowers.

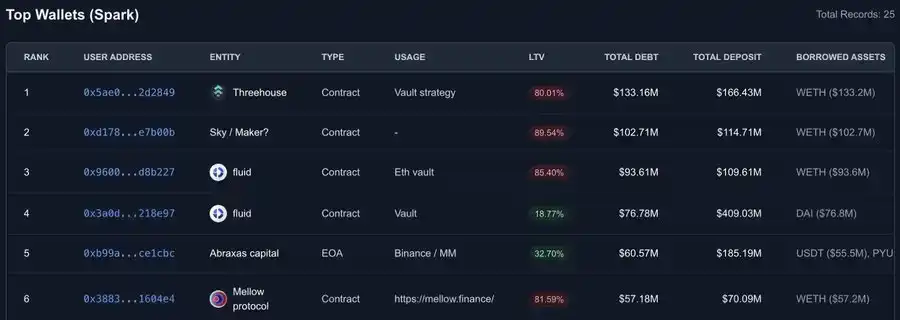
1. The largest borrowers are various Vaults and strategy platforms like Fluid, Treehouse, Mellow, Ether.fi, Lido (which are also asset issuers). They control the distribution capability to end-users, helping users obtain higher yields without having to manage complex loops and risks themselves.

2. There are also large institutional capital providers, such as Abraxas Capital, which deploy external capital into similar strategies. Their economic model is essentially very close to that of Vaults.

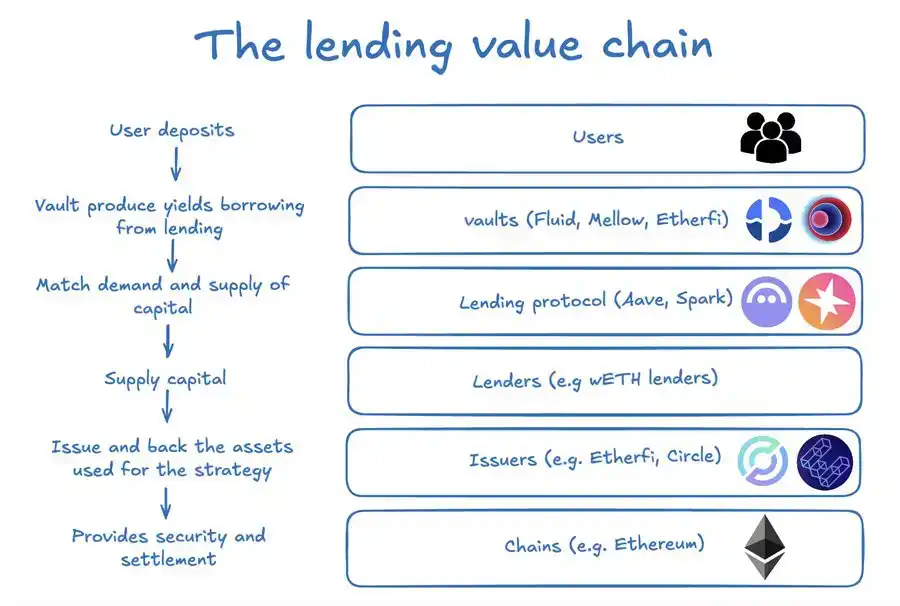
But Vaults are not the whole story. At least the following participants are involved in this chain:

· Users: Deposit assets, hoping to obtain additional yields through Vaults or strategy managers.

· Lending Protocols: Provide infrastructure and liquidity matching, generating protocol revenue by charging interest to the borrowing side and taking a certain percentage.

· Lenders: Capital providers, who can be either ordinary users or other Vaults.

· Asset Issuers: Most on-chain lending assets have underlying supported assets that themselves generate yield, part of which is captured by the issuer.

· Blockchain Network: The underlying "rail" where all activities occur.

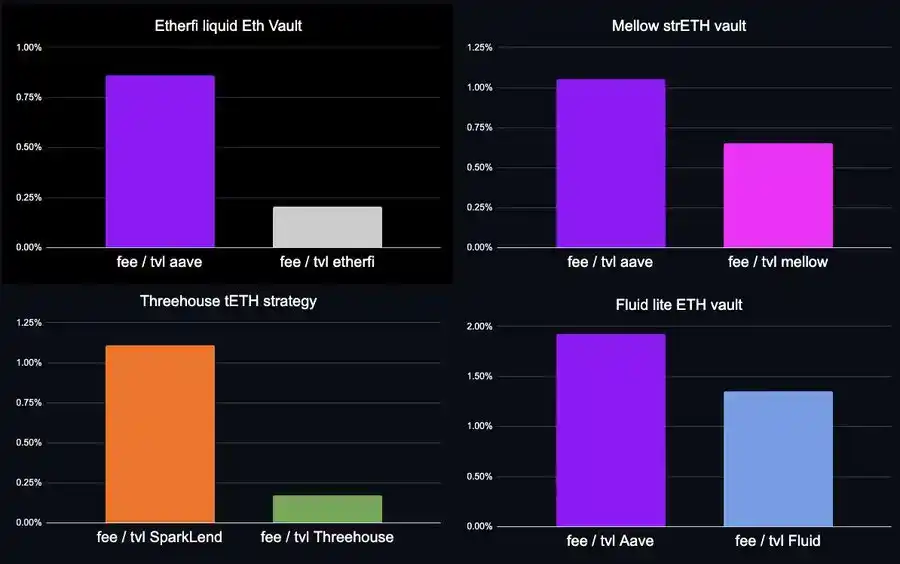
Lending Protocols Earn More Than Downstream Vaults

Take Ether.fi's ETH liquid staking Vault as an example. It is the second-largest borrower on Aave, with an outstanding loan size of approximately $1.5 billion. The strategy itself is very typical:

· Deposit weETH (approx. +2.9%)

· Borrow wETH (approx. –2%)

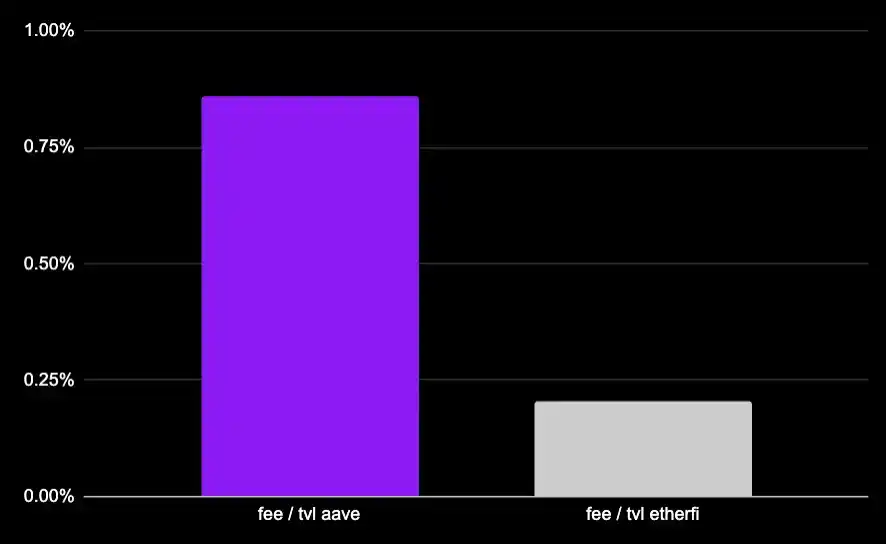
· The Vault charges a 0.5% platform management fee on TVL.

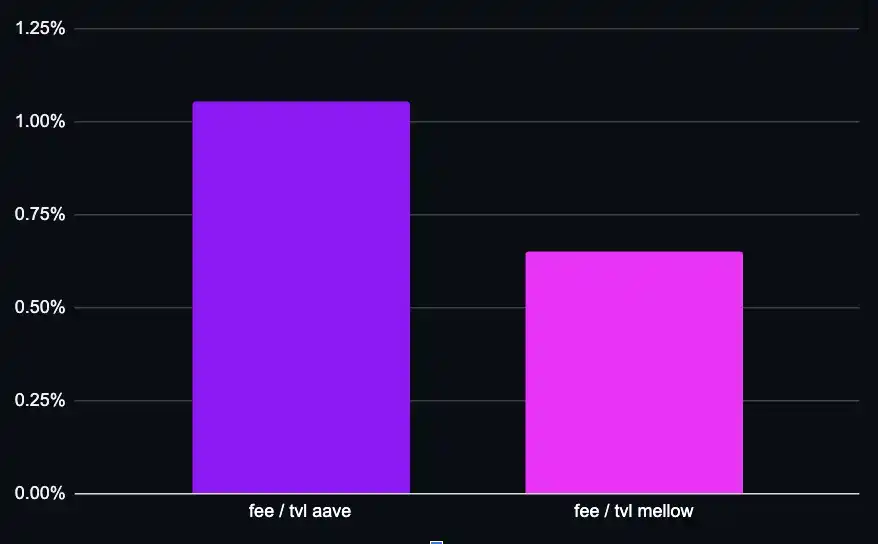
Out of Ether.fi's total TVL, approximately $215 million is the net liquidity actually deployed on Aave. This portion of TVL brings in about $1.07 million in platform fee revenue annually for the Vault.

However, at the same time, this strategy pays about $4.5 million in interest fees to Aave annually (calculation: $1.5 billion borrowed × 2% borrowing APY × 15% reserve factor).

Even for one of the largest and most successful loop strategies in DeFi, the value captured by the lending protocol is several times that of the Vault.

Of course, Ether.fi is also the issuer of weETH, and this Vault itself directly creates demand for weETH.

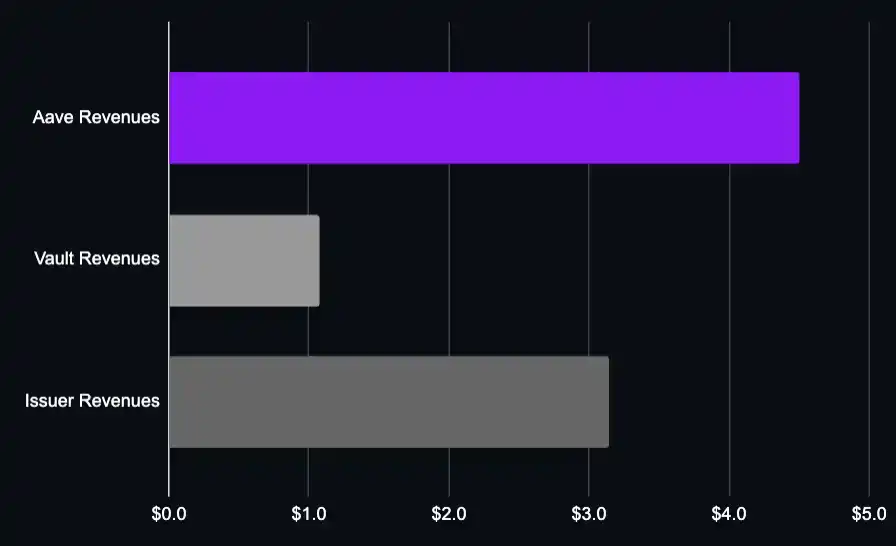
But even considering the Vault strategy yield + asset issuer yield together, the economic value created by the lending layer (Aave) is still higher.

In other words, the lending protocol is the link that creates the largest incremental value in the entire stack.

We can perform the same analysis on other commonly used Vaults:

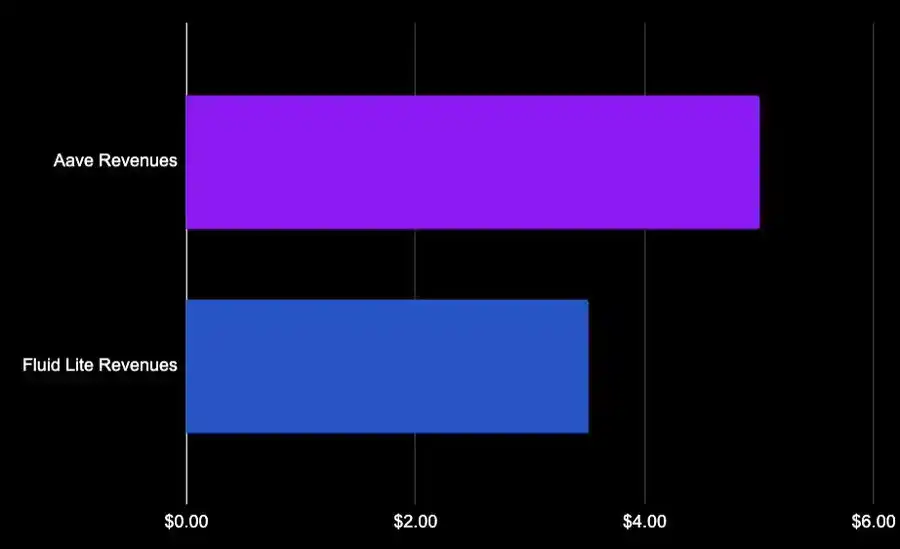
Fluid Lite ETH: 20% performance fee + 0.05% exit fee, no platform management fee. Borrows $1.7 billion wETH from Aave, pays about $33 million in interest, of which about $5 million goes to Aave. Fluid's revenue is close to $4 million.

Mellow Protocol strETH charges a 10% performance fee, with a borrowing size of $165 million and a TVL of only about $37 million. Once again, we see that in terms of TVL, the value captured by Aave exceeds that of the Vault itself.

Let's look at another example. On SparkLend, the second-largest lending protocol on Ethereum, Treehouse is one of the important participants, running an ETH loop strategy:

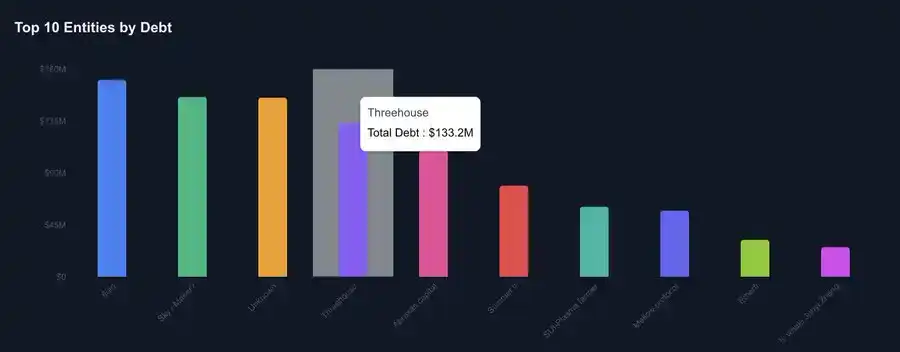
· TVL approx. $34 million

· Borrows $133 million

· Charges a performance fee only on marginal yields above 2.6%

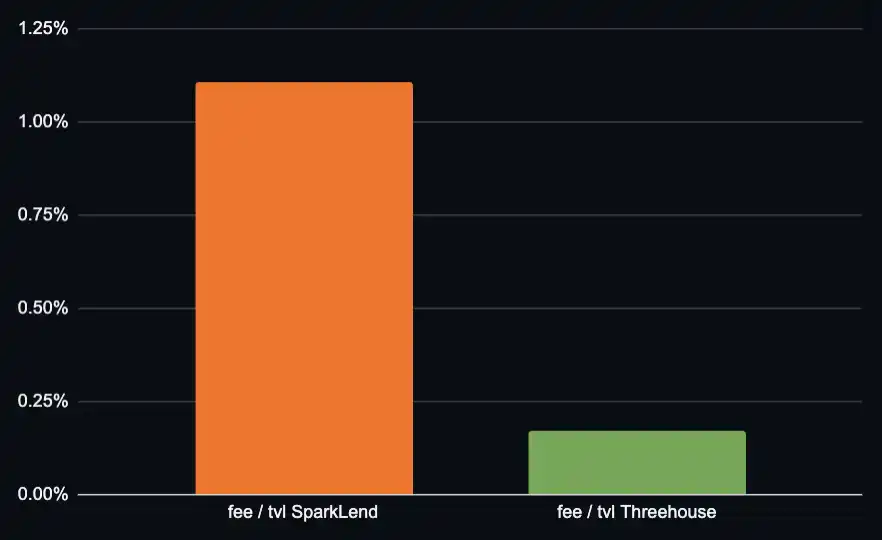
SparkLend, as a lending protocol, has higher value capture capability in terms of TVL than the Vault.

The pricing structure of Vaults greatly affects their own capturable value; but for lending protocols, their revenue depends more on the nominal borrowing size, which is relatively stable.

Even shifting to USD-denominated strategies, although the leverage is lower, the higher interest rates often offset this impact. I don't believe the conclusion would fundamentally change.

In relatively closed markets, more value might flow to curators, such as Stakehouse Prime Vault (26% performance fee, with incentives provided by Morpho). But this is not the end state of Morpho's pricing mechanism, and curators themselves are also engaging in distribution collaborations with other platforms.

Lending Protocol vs. Asset Issuer

So the question arises: Is it better to be Aave or Lido?

This question is more complex than comparing Vaults because staking assets not only generate yield themselves but also indirectly create stablecoin interest income for the protocol through the lending market. We can only make approximate estimates.

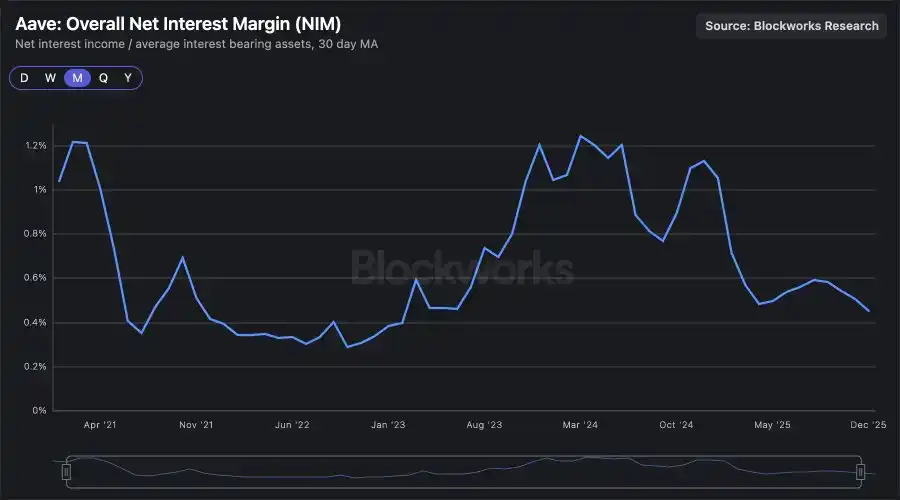
Lido has approximately $4.42 billion in assets in Ethereum core markets supporting lending positions, with annualized performance fee revenue of about $11 million.

These positions roughly equally support ETH and stablecoin lending. At the current net interest margin (NIM) of about 0.4%, the corresponding lending yield is about $17 million, which is already significantly higher than Lido's direct revenue (and this is at a historically low NIM level).

The True Moat of Lending Protocols

If we only compare using the deposit profit model of traditional finance, DeFi lending protocols seem to be a low-margin industry. But this comparison ignores where the real moat lies.

In the on-chain credit system, lending protocols capture more value than the downstream distribution layer and, overall, more than the upstream asset issuers.

Viewed in isolation, lending seems like a thin-profit business; but placed within the complete credit stack, it is the layer with the strongest value capture capability relative to all other participants—Vaults, issuers, distribution channels.

Пов'язані питання

QAccording to the article, which layer in the DeFi lending stack captures the most value?

AThe lending protocol layer (e.g., Aave, SparkLend) captures the most value in the DeFi lending stack, exceeding the value captured by downstream vaults/curators and even upstream asset issuers.

QWhat data point is used to challenge the 'distribution is king' narrative in DeFi lending?

AThe data point is that vaults pay more in interest fees to lending protocols (like Aave and SparkLend) than the vaults themselves generate in revenue from their users.

QWho are the primary borrowers on major lending protocols like Aave and SparkLend?

AThe primary borrowers are vaults and strategy platforms (e.g., Ether.fi, Lido, Fluid, Mellow) and large institutional capital providers (e.g., Abraxas Capital) that deploy capital into yield-generating strategies.

QIn the Ether.fi vault example, how much does the vault pay to Aave annually compared to its own fee income?

AThe Ether.fi vault pays approximately $4.5 million in annual interest fees to Aave, while it only generates about $1.07 million in platform fee revenue from its users.

QWhat is identified as the true moat (competitive advantage) of DeFi lending protocols?

AThe true moat is their position as the layer that captures the most economic value in the entire on-chain credit value chain, making them more valuable than the businesses built on top of them (vaults) or the asset issuers that supply them.

Пов'язані матеріали

How Will the Price Move Before SpaceX's Next Share Unlock?

TL;DR Investors buying SPCX after SpaceX's IPO are not simply investing in a typical tech stock. It’s a high-valuation asset driven by Musk's narrative, Starlink, and space transport potential, but with a key twist: a very small initial float of ~4% has led to significant post-listing price appreciation. The current price action reflects a timing gap. Before the first lock-up expiration (estimated around August, subject to official confirmation), scarcity and high demand could continue to push prices up. Short-term bulls focus on low float, FOMO, and potential index inclusion. However, bears point to the supply dynamics that will change post-lockup. Existing shareholders still hold over 95% of shares, which will be released in stages starting from the first unlock window. This introduces future selling pressure from low-cost holders. The upcoming Q2 earnings report is a critical catalyst before the unlock. It will test whether the company's fundamentals can justify the current ~$2.1T valuation. Strong results could support the pre-unlock momentum, while weak figures could amplify concerns about future supply. The trading thesis is shifting from immediate scarcity ("can't buy enough") to evaluating future absorption capacity ("who will buy when more supply hits"). The path ahead hinges on the specifics of the unlock schedule, Q2 earnings performance, and whether anticipated passive index buying materializes.

marsbit23 хв тому

How Will the Price Move Before SpaceX's Next Share Unlock?

marsbit23 хв тому

Bitcoin Short-Term Bullish Structure Validated, HYPE Low-Entry Window Opens | Guest Analysis

**Market Analysis Summary (Week of June 2026)** **Overall Market Context:** The market environment is exceptionally complex, with the unexpected US-Iran agreement and the reopening of the Strait of Hormuz triggering a global asset repricing and significant volatility. This heightened noise underscores the importance of a structured analytical framework. **Bitcoin (BTC) Analysis & Strategy:** * **Current Status:** The price has climbed above $65,000, currently in a rebound phase (segment 38-39) following a complex 12-segment correction from the May high of $82,850. * **Key Levels:** * **Primary Resistance:** $69,500–$70,500. A successful breakout above $65,000 targets this zone. * **Primary Support:** $65,000 (immediate), followed by $59,000–$60,000 and $55,000. * **Weekly Outlook & Strategy:** The focus is on the confirmation of the $65,000 level. * **Bullish Scenario (Hold $65K):** A move toward the $69.5K–$70.5K resistance zone is anticipated, which is a potential area for initiating medium-term short positions. * **Bearish Scenario (Break below $65K):** A retest of the $60,000–$62,000 support range is likely. * **Medium-Term Strategy:** Currently neutral. Plan to establish short positions (up to 60% allocation) either in the $69.5K–$70.5K resistance zone upon signs of rejection, or on a confirmed breakdown below $65,000 and further below $59K–$60K. * **Short-Term Strategy:** Utilize 30% capital for scalping opportunities based on support/resistance levels, using 30/60-minute charts. **HYPE Analysis & Strategy:** * **Current Status:** The price has stabilized around $52 after a four-segment decline from the June high of $75.87 and is now in a rebound (segment 50-51). * **Key Levels:** * **Primary Resistance:** $62.50–$64.57. Watch for potential rejection here to form a lower high. * **Primary Support:** $52–$55.50, followed by $47–$49. * **Weekly Outlook & Strategy:** Adopt a "buy on dips, avoid chasing rallies" approach. * **Core View:** Monitor the price action and potential formation of a lower high ("endpoint 51") in the $62.50–$64.57 resistance zone. * **Short-Term Strategy:** Consider light long positions (max 30% allocation) if the price finds support and shows reversal signals in the $52–$54.50 or deeper $47–$49 support zones, confirmed by proprietary quantitative bottom signals. **Trade Review:** Last week's HYPE short-term long trade, executed based on proprietary "Price Difference" and "Momentum" model signals, yielded a profit of approximately 11.88%. The entry was near $54.39 and exit near $60.85. **Risk Management Reminder:** Always set an initial stop-loss upon entry. Move stop-loss to breakeven at +1% profit, then trail it upwards to lock in gains as the trade progresses. *Disclaimer: All analysis, models, and strategies are based on personal technical analysis for educational purposes only, not investment advice. The market carries inherent risk.*

Odaily星球日报28 хв тому

Bitcoin Short-Term Bullish Structure Validated, HYPE Low-Entry Window Opens | Guest Analysis

Odaily星球日报28 хв тому

Bitcoin Short-Term Bullish Structure Validated, HYPE Accumulation Window Opens | Guest Analysis

**Bitcoin and HYPE Market Analysis: Short-Term Outlook and Trading Strategies** This market analysis examines Bitcoin (BTC) and HYPE amid volatile conditions, providing short-term outlooks and specific trading strategies. **Key Outlooks:** * **Bitcoin (BTC):** Focus is on whether BTC's recent move above $65,000 holds. A successful breakout could lead to a test of the $69,500-$70,500 resistance zone, where medium-term short positions are considered. A failure, breaking below $65,000, may trigger a decline towards the $59,000-$60,000 support area. * **HYPE:** The token completed a four-wave correction and is now rebounding. The key resistance zone is $62.5-$64.57. The trading strategy is "buy on dips," looking for entry opportunities near the $52-$54.5 or deeper $47-$49 support zones, pending confirmation from proprietary models. **BTC Trading Strategy:** * **Medium-term:** Primarily looking to establish short positions (up to 60% allocated capital) if price rallies to the $69,500-$70,500 resistance area and shows signs of reversal. Alternative plans involve initiating shorts on a breakdown below $65,000. * **Short-term:** Allocate up to 30% capital for intraday "spread" trades based on support/resistance levels on 30/60-minute charts. **HYPE Trading Strategy:** * **Short-term:** Adopt a dip-buying approach. Consider light long positions (under 30% capital) when price tests key support levels ($52-$54.5 or $47-$49) and shows stabilization, confirmed by proprietary "Price Spread" and "Momentum Quant" models. **Trade Recap:** The analysis reviews a successful HYPE long trade from the previous week, executed at ~$54.39 and closed at ~$60.85 for an ~11.88% gain, based on signals from the aforementioned models. **Risk Management Emphasis:** The article stresses strict capital allocation (under 30-60%), immediate initial stop-loss placement, and a trailing stop-loss protocol to lock in profits as trades move favorably. ***Disclaimer:** All analysis, models, and strategies are for educational purposes based on technical analysis, not investment advice. Markets are volatile; trade with caution.*

marsbit30 хв тому

Bitcoin Short-Term Bullish Structure Validated, HYPE Accumulation Window Opens | Guest Analysis

marsbit30 хв тому

Торгівля

Спот
Ф'ючерси
活动图片