The full report is freely available in PDF format.
Welcome to Strategy Watch #4
Strategy Watch was built to address a clear demand for high-signal, impartial analysis of fund-level performance and allocation trends in digital assets.
Our objective is straightforward — to make Strategy Watch a must-read monthly publication for the digital asset investment community.
This publication is strengthened by direct input from market participants. Funds and allocators that contribute data and insights help shape a more complete and valuable view of the landscape. If you have insights, data, or allocation updates worth sharing, we welcome your contribution.
Present your latest initiatives and updates to a curated audience of institutional allocators.
Inside the Latest Strategy Watch
The report is structured across six core sections, each focused on a distinct dimension of institutional activity in digital assets:
01 Institutional Flow Monitor | Defensive positioning persisted through April as BTC and ETH outflows eased further, stablecoin demand accelerated, and ETF inflows remained constructive.
02 Fund and SMA Performance | Every sub-strategy posted gains for the month, a level of cross-strategy alignment not seen in recent memory. Is this a rebound or repositioning?
03 Strategy Deep Dive: DeFi/Yield | Hear a CIO's perspective on where edge comes from as lending spreads compress and smart contract risk evolves
04 On-chain Vault Performance | Are ETH curators underperforming ETH staking yield?
05 Manager Monitor | Find out how more than 400+ managers are positioning for Q2, with cash levels climbing to multi-year highs despite a more constructive market backdrop.
06 Allocation Updates | Pension allocations rise alongside strategic acquisitions and new launches across yield, trading, and digital asset strategies.

The Premier Digital Assets Allocator Platform. Learn more
Institutional Flow Monitor
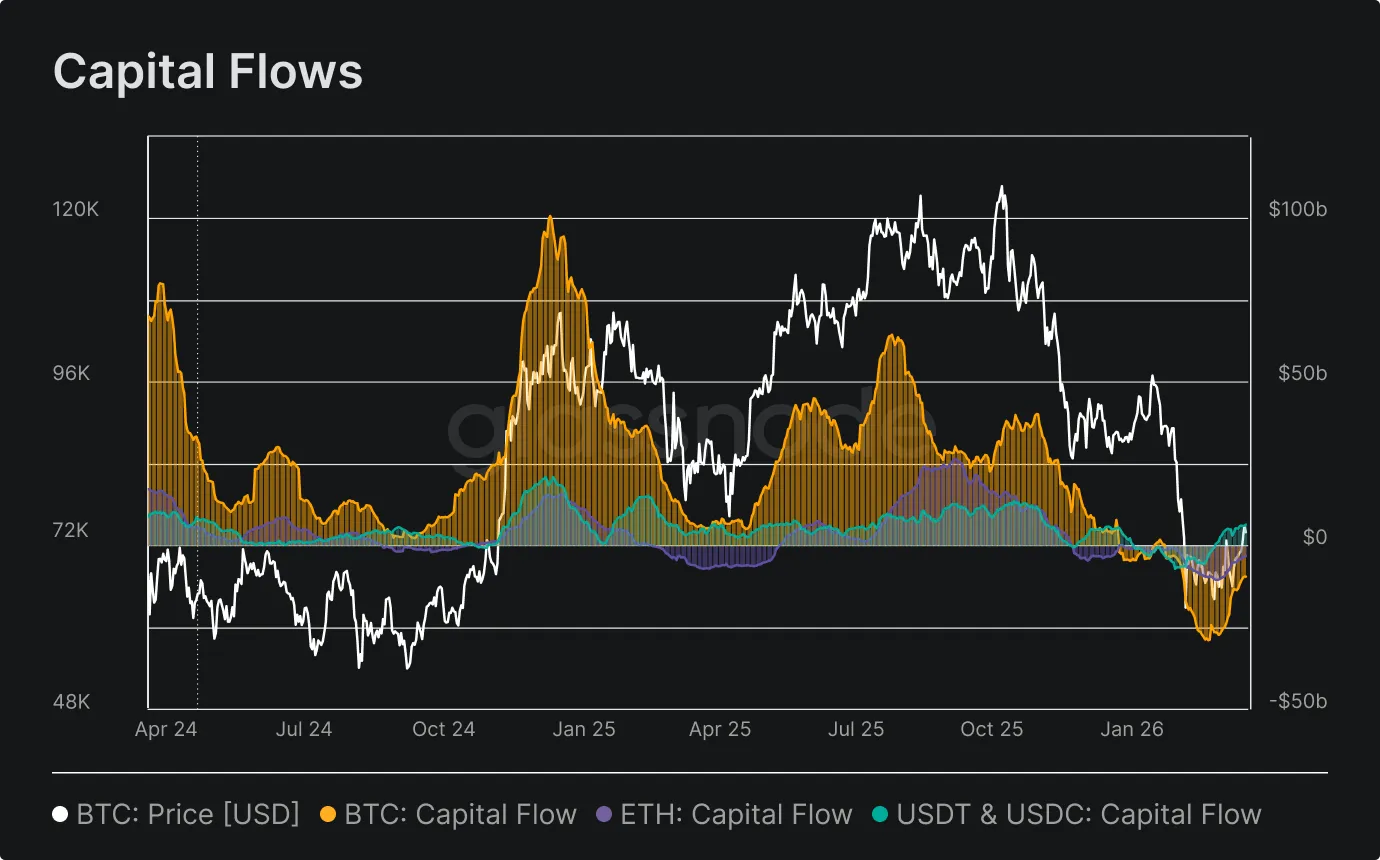
- BTC capital flows nearly recovered to neutral through April while stablecoin inflows surged to multi-month highs, though ETH remained persistently in net outflow.
Bitcoin capital flows recovered materially through April, improving from -$6.9B at month-open to nearly neutral at -$0.7B by month-end, continuing the gradual deceleration of outflows observed in March. Stablecoins showed the strongest directional move, with inflows accelerating from +$1.8B in early April to +$5.4B by month-end, suggesting a meaningful rotation of capital into dollar-denominated on-chain instruments. Ethereum stood apart from both trends, remaining in persistent net outflow throughout the month and closing at -$1.6B, broadly unchanged from its March reading. The divergence between a stabilizing BTC, surging stablecoin demand, and a lagging ETH points to a selective rather than broad-based recovery in capital allocation.
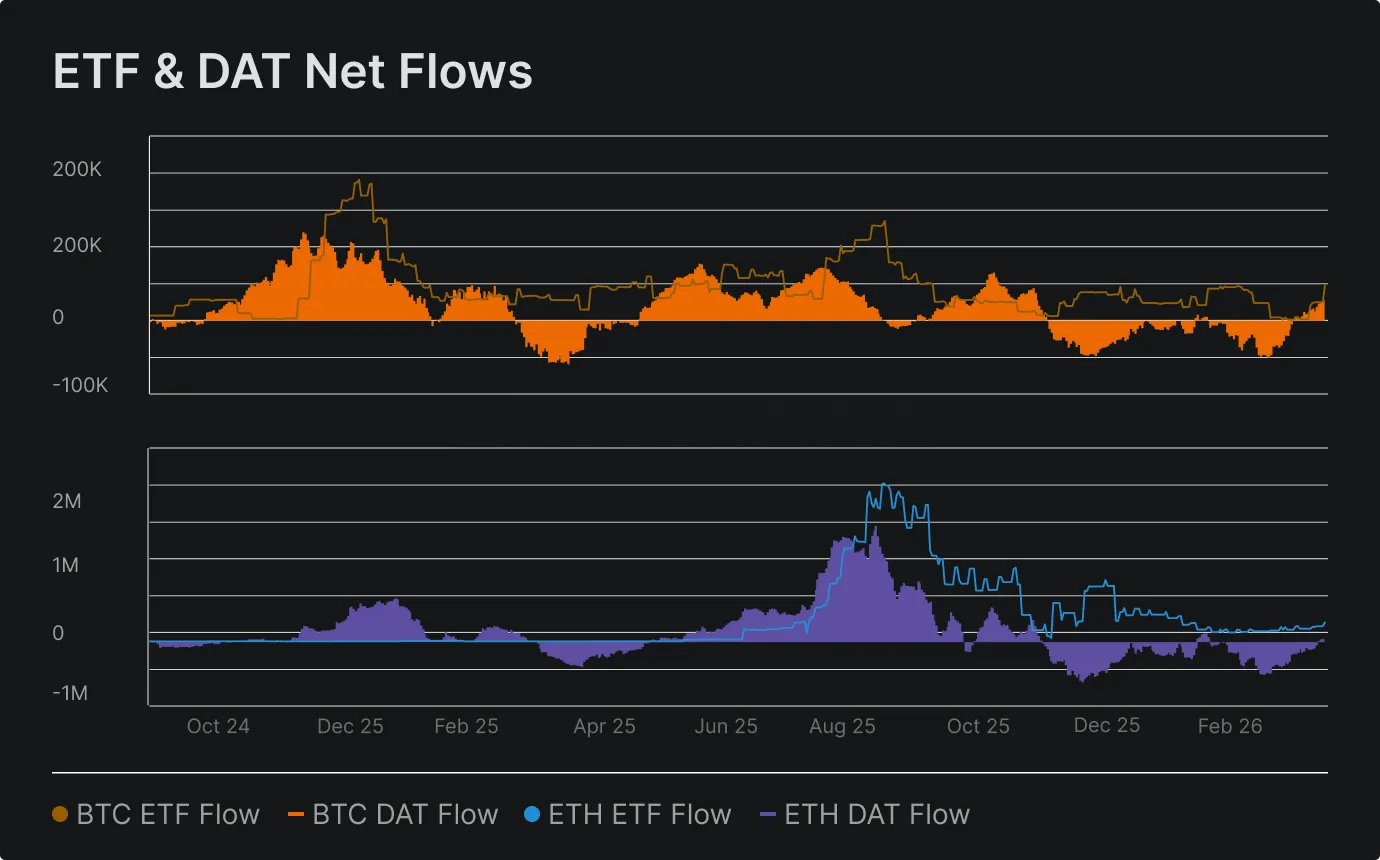
ETF & DAT Net Flows
- BTC ETF and DAT flows held positive through April while ETH staged a notable turnaround, flipping from deep outflow in early April to meaningful inflows by month-end.
Bitcoin ETF flows maintained positive territory throughout April, recovering from a mid-month dip to close at +26.3k BTC, while DAT flows strengthened progressively to +58.8k BTC by month-end. The more significant shift came from Ethereum, where ETF flows opened the month at -135k ETH before turning positive around April 18 and closing at +140.6k ETH. ETH DAT flows remained constructive throughout, finishing at +408.6k ETH. While BTC institutional demand showed consistency, the ETH turnaround is the more notable development, though it remains early and the magnitude of the late-month recovery warrants monitoring before drawing conclusions about a durable change in positioning.
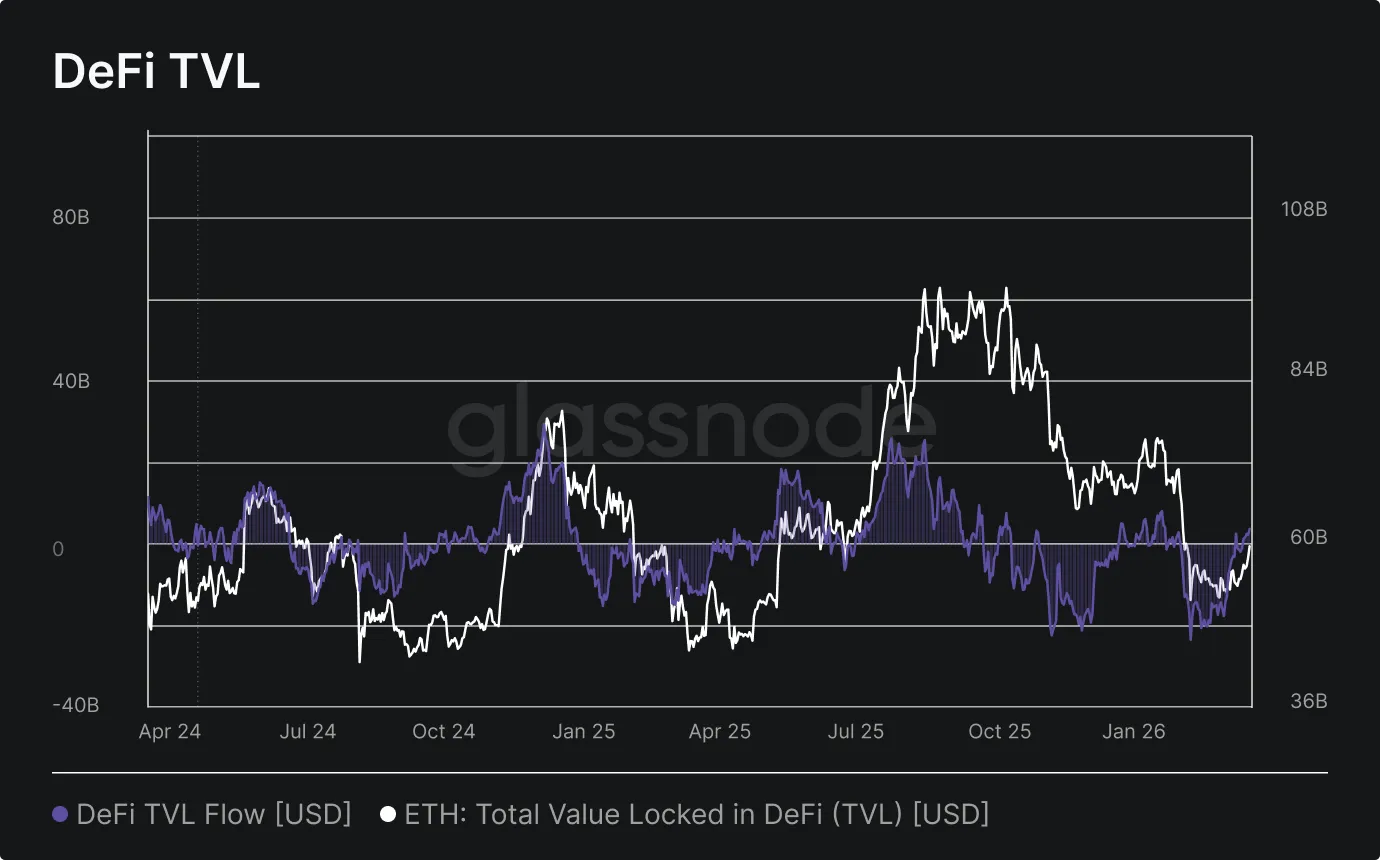
DeFi TVL & Stablecoin Cap
- DeFi TVL flows on Ethereum reversed sharply in April, erasing the March stabilization as outflows accelerated to multi-month highs in the final week.
After nearly reaching neutral at month-end March, Ethereum DeFi TVL flows deteriorated steadily through April. The first half of the month was relatively contained, with flows oscillating near neutral before turning more negative around mid-month. The picture changed materially in the final ten days, with outflows accelerating to a peak of -$11.3B around April 25 before partially recovering to -$7.6B at month-end. Total ETH locked in DeFi fell from ~$54B at month-open to ~$44.9B by close. The reversal of March's stabilization trend suggests the earlier recovery was fragile, and the renewed pace of withdrawal points to sustained allocator caution toward on-chain yield strategies heading into May.
CME Basis Yield
- CME basis yield deteriorated sharply through April for both BTC and ETH, with carry returns turning deeply negative by month-end as futures markets shifted into persistent backwardation.
After closing March at -$3.9M and +$0.9M respectively, BTC and ETH CME basis yields both briefly recovered in early-to-mid April, with BTC reaching +$3.3M and ETH +$1.7M around April 9-12. The recovery proved short-lived. Both assets deteriorated sharply through the second half of the month, with BTC closing April at -$21.2M and ETH at -$6.0M. The depth and pace of this reversal suggests futures markets moved into meaningful backwardation, removing the economic basis for cash-and-carry strategies entirely. For institutions running market-neutral books, the carry environment in April offered no compensation, reinforcing the broader picture of reduced leverage deployment and subdued institutional risk appetite.


Disclaimer: This report does not provide any investment advice. All data is provided for information and educational purposes only. No investment decision shall be based on the information provided here and you are solely responsible for your own investment decisions. Exchange balances presented are derived from Glassnode’s comprehensive database of address labels, which are amassed through both officially published exchange information and proprietary clustering algorithms. While we strive to ensure the utmost accuracy in representing exchange balances, it is important to note that these figures might not always encapsulate the entirety of an exchange’s reserves, particularly when exchanges refrain from disclosing their official addresses. We urge users to exercise caution and discretion when utilizing these metrics. Glassnode shall not be held responsible for any discrepancies or potential inaccuracies. Please read our Transparency Notice when using exchange data.