Solana Price Rallied 2,000% The Last Time This Happened, And It Just Triggered Again

bitcoinistОпубліковано о 2026-06-12Востаннє оновлено о 2026-06-12

Анотація

The Solana (SOL) price is garnering renewed attention as it trades near a key historical Fibonacci zone ($40-$60), which previously triggered a massive 2,200% rally in 2023. Analyst Crypto Patel suggests this could signal a breakout from its prolonged slump, potentially leading to new highs and even a challenge of the $1,000 mark if market conditions align, especially during an altcoin season. However, not all outlooks are bullish. Another expert, 'The Martini Guy', warns of near-term downside risks, noting SOL has broken down on weekly charts and entered an illiquid zone. He cautions it could retest $40 or even $25 if sentiment worsens. SOL is currently trading around $65, down significantly over recent weeks amid bearish market structure and a lack of bullish catalysts.

The Solana price is drawing renewed attention after months of declines, selling pressure, and mixed performance. Market analyst Crypto Patel highlighted in a recent X post that SOL is currently trading near a historical price level that previously triggered a massive 2,000% rally during the 2023 cycle. He emphasized that if history were to play out as expected, Solana could finally break out of its prolonged price slump and consolidation phase, potentially paving the way for new all-time highs.

Solana Price Reenters Zone That Triggered Explosive Past Rally

Crypto Patel is reminding investors to remember Solana’s past price behavior and its tendency to execute sharp moves. He pointed out that the last time Solana traded within the 0.5 to 0.618 Fibonacci Retracement zone, it rallied over 2,200%.

According to Patel, Solana is once again trading inside this key Fibonacci zone around the $40 to $60 range. Sharing a chart, the analyst noted that this range has historically acted as a major accumulation area for traders, with SOL’s price surging rapidly once buying pressure builds.

Given how fast the cryptocurrency tends to move, Crypto Patel has suggested that investors who position themselves strategically in this zone could benefit significantly once the market enters another bullish phase. The analyst also indicated that if the highly anticipated altcoin season finally unfolds, Solana would be among the cryptocurrencies leading the rally with a substantial upside.
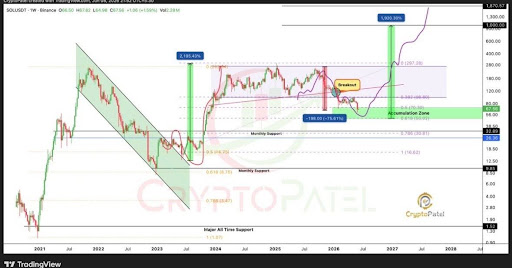
Source: Chart from Crypto Patel on X

Notably, Crypto Patel hinted that SOL might even challenge the $1,000 mark if market conditions align. However, he acknowledged that the real question is not whether Solana can hit $1,000 during this cycle, but whether investors will have enough exposure to the asset if the price actually goes parabolic. As a result, the analyst has cautioned that maintaining proper market positioning during these consolidation phases could yield higher returns for investors during a potential price breakout.

SOL Faces Fresh Downside Risk After Major Breakdown

Not all analysts are optimistic about Solana’s near-term trajectory. A well-known crypto expert, identified as ‘The Martini Guy’ on X, has warned that Solana’s price faces a serious risk of a decline. He noted that the cryptocurrency has broken down on the weekly chart and is now trading within a highly illiquid price zone, which could accelerate downward movement.

The Martini Guy explained that historically, Solana tends to move very quickly through the $40 to $80 range. If history repeats itself, SOL could dip toward the lower end of this spectrum, potentially testing $40. In more extreme scenarios, he added, a backtest toward $25 cannot be ruled out if market sentiment deteriorates further.

Notably, SOL is currently trading above $65 after declining by roughly 20% this last week and a staggering 32% over the past month. The cryptocurrency’s price structure remains inherently bearish as broader market sentiment, volatility, and a lack of sustainable bullish catalysts continue to weigh on price.

SOL trading at $65 on the 1D chart | Source: SOLUSDT on Tradingview.com

Пов'язані питання

QAccording to the article, what specific technical zone is Solana currently trading in, and what historical precedent is associated with it?

AAccording to analyst Crypto Patel, Solana is currently trading within the 0.5 to 0.618 Fibonacci Retracement zone, specifically around the $40 to $60 range. Historically, the last time Solana traded in this zone, it rallied over 2,200% during the 2023 cycle.

QWhat is the optimistic long-term price target for Solana mentioned by Crypto Patel?

ACrypto Patel hinted that if market conditions align, Solana (SOL) might even challenge the $1,000 mark during this cycle.

QWhich analyst presents a bearish view for Solana's near-term price, and what is the key risk they identify?

AA crypto expert identified as 'The Martini Guy' presents a bearish view. He warns that Solana's price faces a serious risk of a decline because it has broken down on the weekly chart and is trading within a highly illiquid price zone, which could accelerate downward movement.

QWhat are the potential downside price levels mentioned by The Martini Guy?

AThe Martini Guy suggested that Solana could dip toward $40, and in more extreme scenarios, a backtest toward $25 cannot be ruled out if market sentiment deteriorates further.

QWhat is the current price and recent performance of Solana as reported in the article?

ASolana (SOL) is currently trading above $65. It has declined by roughly 20% in the last week and approximately 32% over the past month. The broader market sentiment and a lack of bullish catalysts are weighing on its price.

Пов'язані матеріали

Why Bitcoin Holds Above $64,000 After Fed's Hard Pause

**Bitcoin Stabilizes Near $64,000 Following Hawkish Fed Pause** The cryptocurrency market, led by Bitcoin, remained stable around $64,000 despite a volatile reaction to the latest U.S. Federal Reserve meeting. The Fed paused interest rates but signaled a hawkish stance, with three committee members voting for an increase—the highest dissent since 2016. This limits risk appetite but hasn't triggered panic selling. Key market highlights include Bitcoin ETFs seeing a net inflow of $32.1 million, breaking a streak of outflows, while Ethereum ETFs experienced outflows of $18.65 million. Liquidations affected about 90,000 traders. Technically, Bitcoin finds support around $63,000-$63,500, with major resistance near $66,000. While its price is about 49% below its all-time high, institutional demand via ETFs and the absence of mass capitulation support a potential recovery scenario in the second half of the year. Major altcoins showed mixed movements, with Solana attracting capital while Ethereum faced selling pressure despite strong on-chain metrics like a growing staking queue. Regulatory news took a pause as the U.S. Senate delayed the CLARITY Act vote until at least autumn. For the final trading day of July, U.S. inflation and consumer spending data will be crucial. Bitcoin's key levels to watch are $63,000 support and $66,000 resistance. Sustained ETF inflows and Bitcoin holding above $63,000 are seen as positive signs for a potential market recovery later in the year.

cryptonews.ru2 год тому

Why Bitcoin Holds Above $64,000 After Fed's Hard Pause

cryptonews.ru2 год тому

Торгівля

Спот
活动图片





