SIREN has surged over 10% in the past 24 hours, reaching around $0.65 even as trading volume declines 8.35% to roughly $13.98M.
Such divergence highlights rising price strength alongside weakening Spot participation. Price acceleration toward the upper range has occurred despite this contraction in activity.
However, declining volume often signals thinner market participation during rallies. As a result, traders closely monitor whether buyers continue absorbing available liquidity for Siren’s [SIREN] rally continuation.
SIREN breakout rally targets the $0.70 ceiling
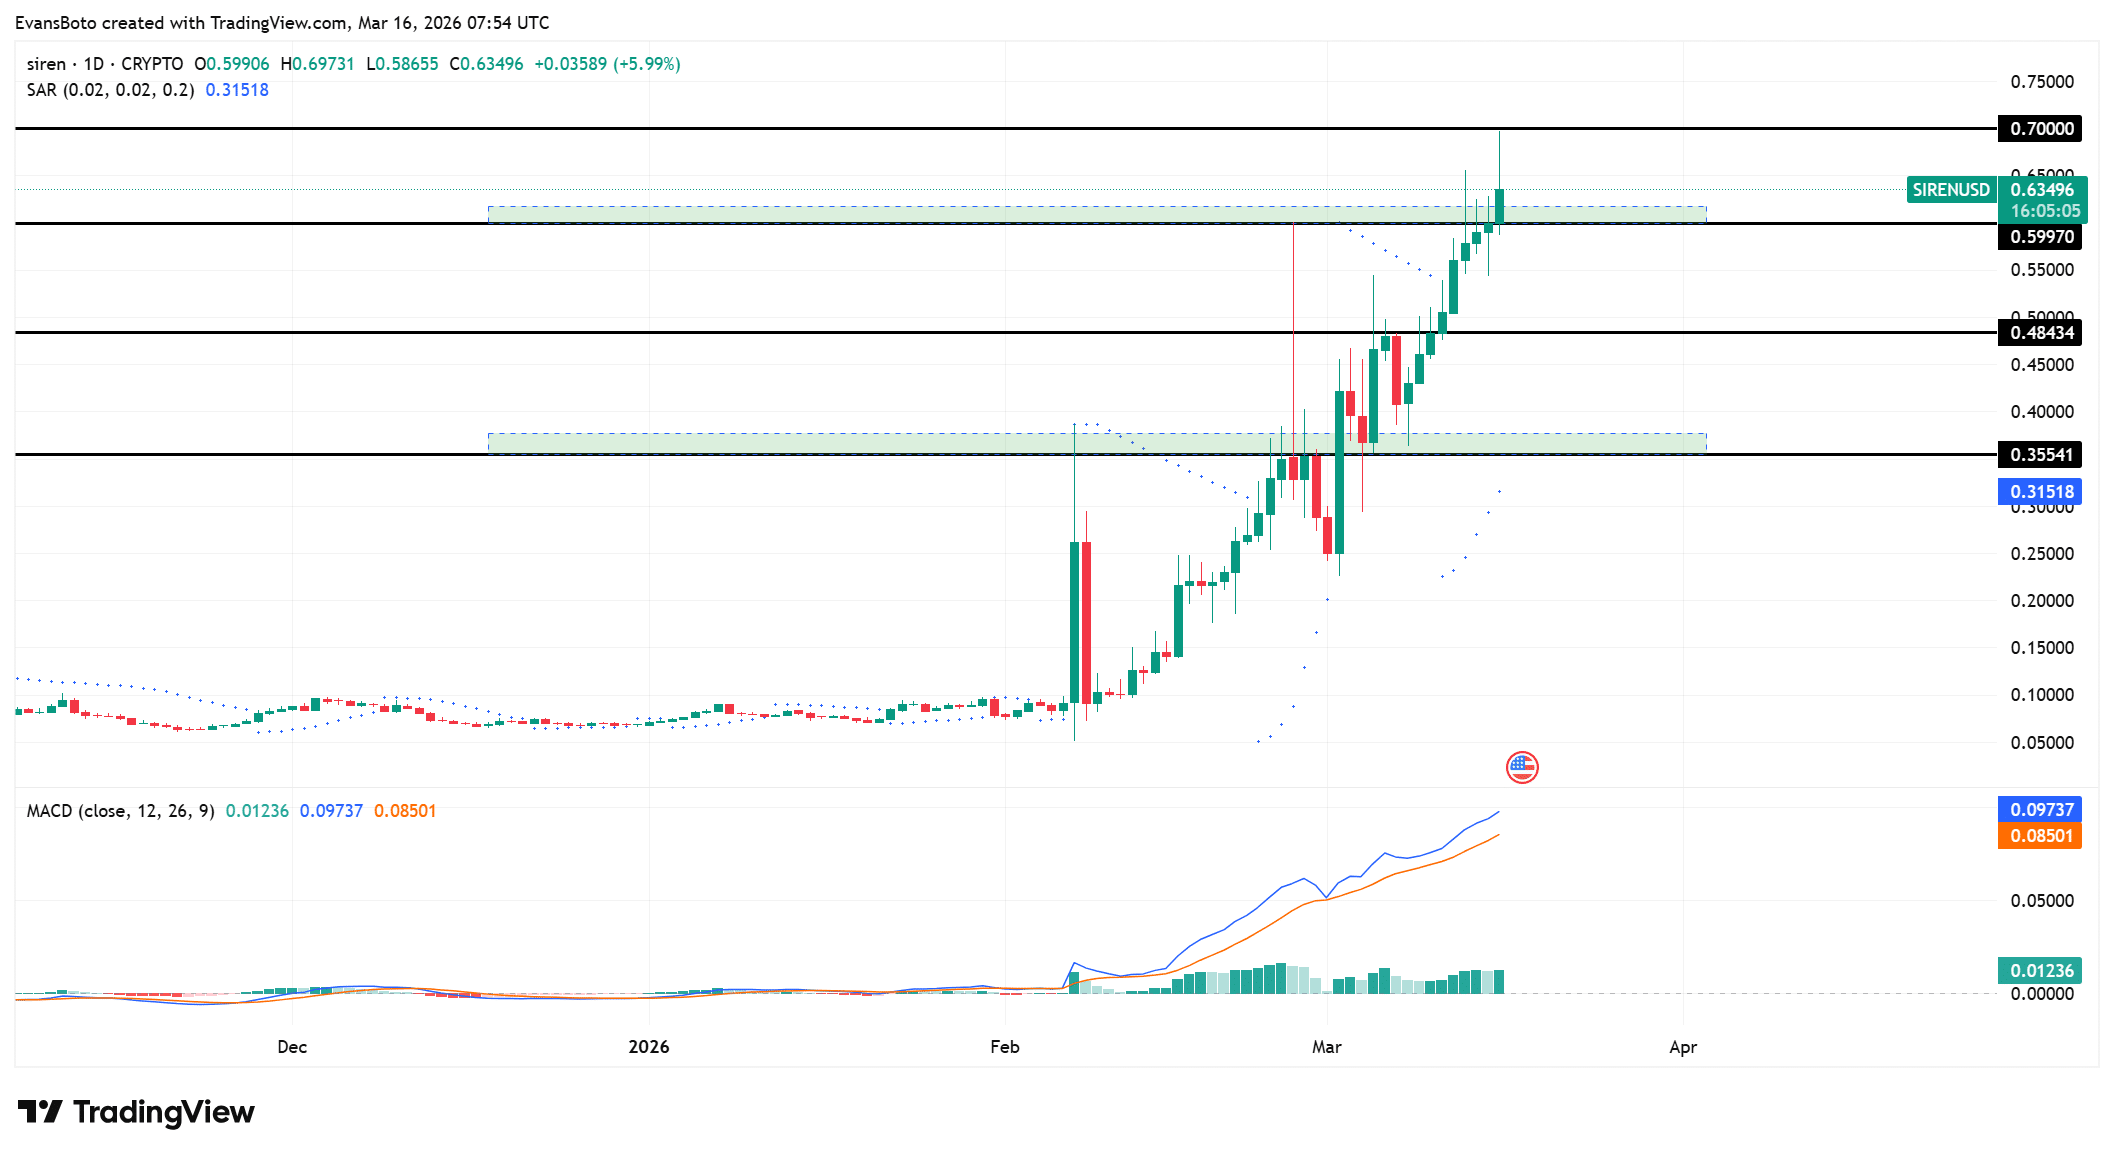
SIREN has pushed toward the $0.70 resistance after reclaiming the $0.60 breakout zone on the daily chart.
The move follows a powerful expansion from the $0.355 demand region established earlier. Price has printed successive higher highs while maintaining a strong bullish structure.
This climb shows persistent buying pressure dominating recent sessions. However, the rally now approaches a major horizontal resistance cluster near $0.70.
This zone historically limits upward continuation and often attracts profit-taking. Recent candles have already tested this area as price briefly spiked toward the upper boundary. The structure suggests strong trend continuation across recent weeks.
Parabolic SAR dots have flipped beneath the price near the $0.315 level. This shift indicates sustained upward trend confirmation after earlier consolidation phases.
Meanwhile, the MACD line has crossed above the signal line and continues rising steadily. The MACD reading currently sits near 0.097, while the signal line holds around 0.085.
This configuration signals expanding bullish strength within the trend structure. Green histogram bars have also continued increasing, reinforcing the upward directional bias.
Rising OI signals stronger trader participation
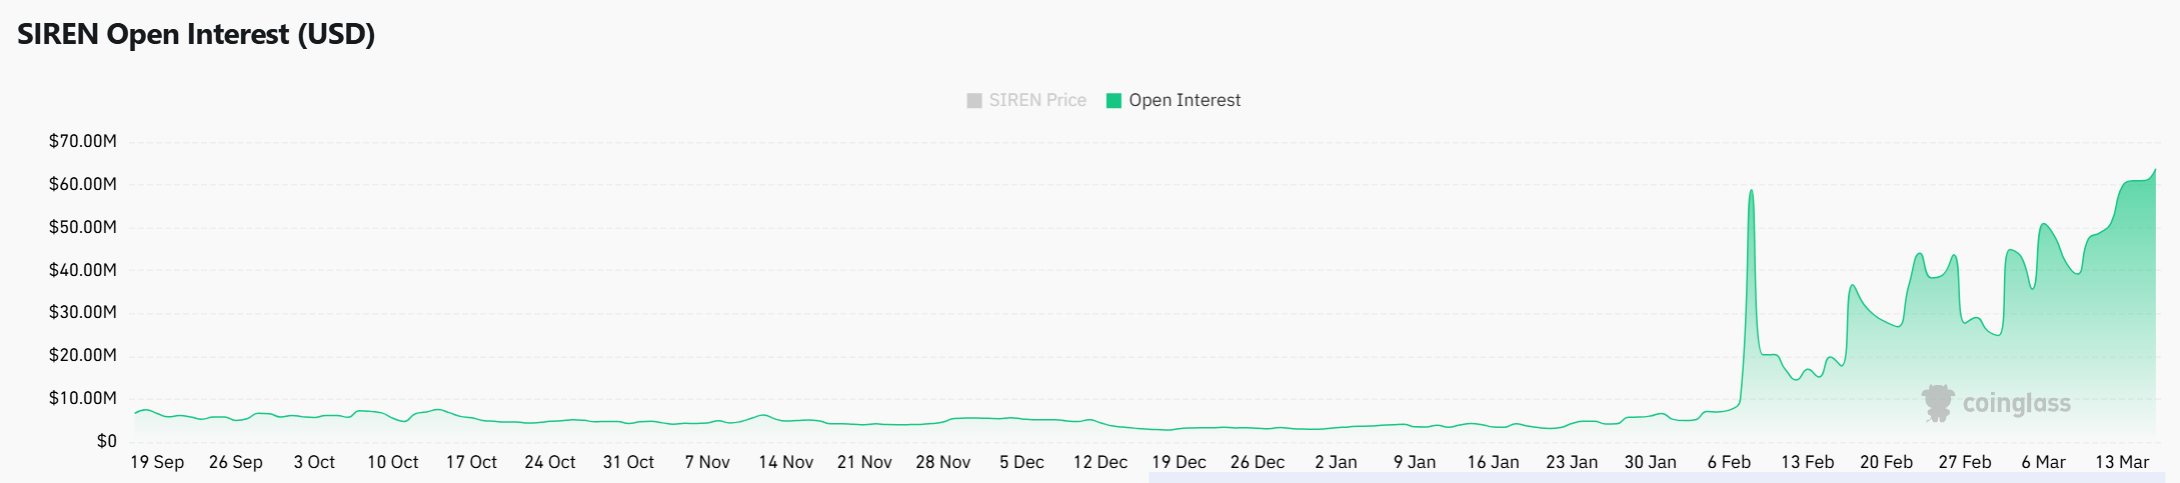
Derivatives participation has expanded rapidly as Open Interest climbed by 10.16% to approximately $67.71M.
This increase indicates rising trader involvement during the recent price surge. Growing Open Interest alongside rising price often reflects new positions entering the market.
Traders therefore appear to increase leveraged exposure as SIREN approaches resistance levels. The expansion also highlights stronger derivatives market engagement compared with earlier weeks.
Higher positioning activity frequently amplifies volatility across short-term trading sessions. However, expanding Open Interest can intensify both upward continuation and sudden reversals. Therefore, market participants continue monitoring derivatives flows carefully.
SIREN short liquidations ignite powerful squeeze
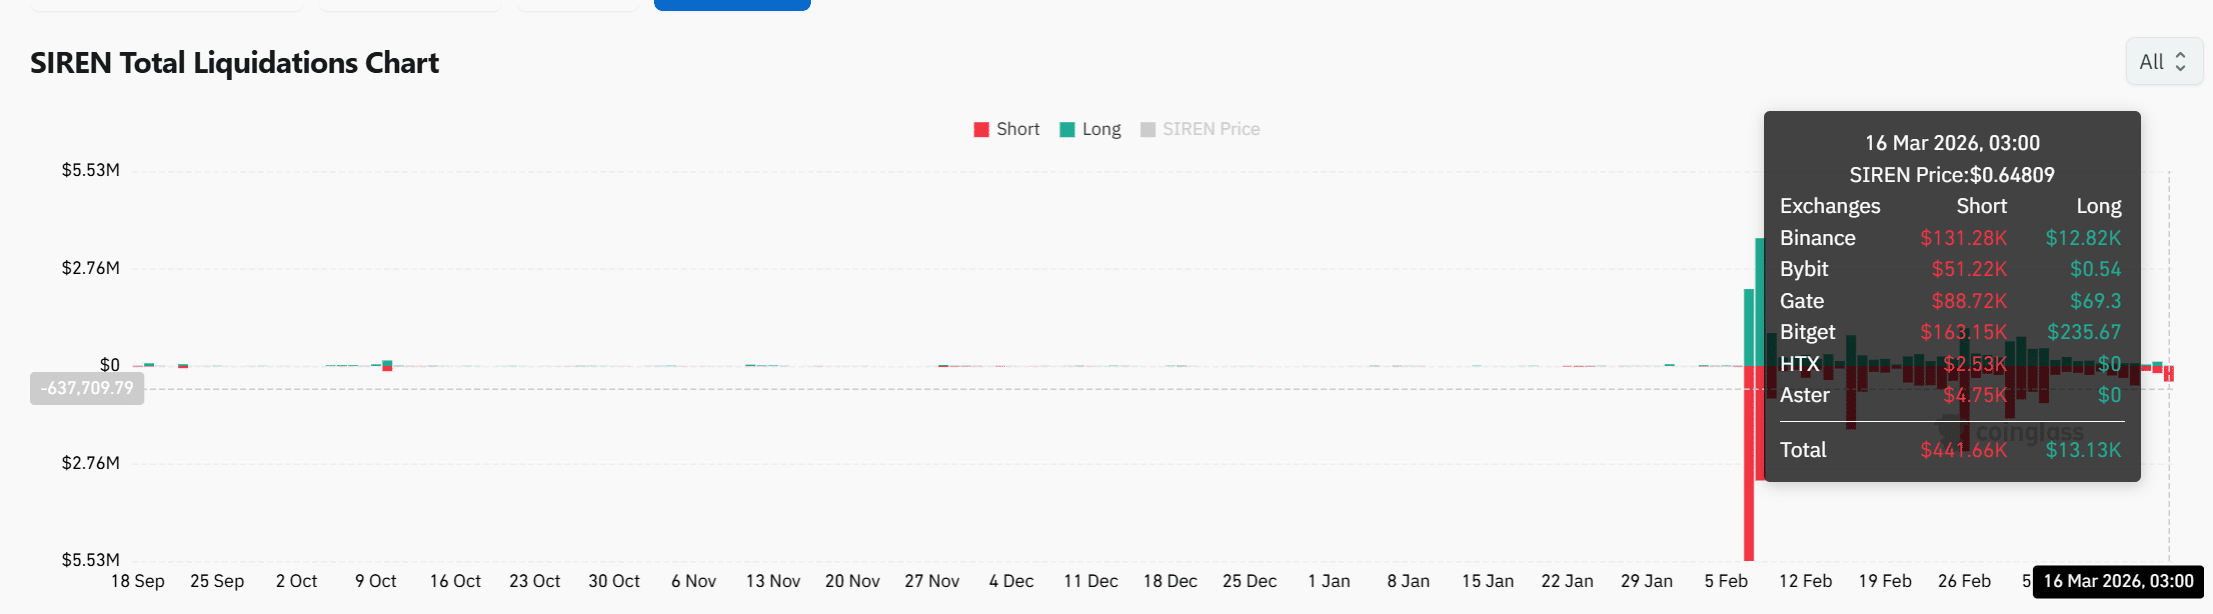
Liquidation data currently reveals strong short squeeze activity across major exchanges. Roughly $441.66K in short positions have faced liquidation compared with only $13.13K in long liquidations.
This imbalance highlights aggressive bearish positions getting forced out of the market.
Binance, Bybit, Gate, and Bitget have contributed to the majority of these liquidations. As SIREN surged upward, many short traders faced forced exits that accelerated the rally.
Such liquidation cascades often trigger rapid price expansions during strong uptrends. However, short squeezes typically amplify volatility within already rising markets.
This dynamic suggests the recent rally partly reflects forced covering rather than organic buying alone. Even so, liquidation pressure has clearly intensified the upward move toward the $0.70 resistance level.
SIREN’s rally currently draws strength from rising open interest, which has climbed to $67.71M as derivatives participation expands.
However, trading volume has dropped to about $13.98M, indicating weaker Spot participation behind the surge.
This imbalance suggests the rally may struggle to sustain above the $0.70 resistance without stronger Spot demand supporting the advance.
Final Summary
- Strong derivatives participation has fueled SIREN’s rally, yet sustained continuation requires deeper Spot market participation.
- Price strength reflects aggressive positioning and technical alignment, yet durable trends usually demand broader buyer conviction.