SIREN jumps 10% despite falling volume: Can the uptrend stay intact?

ambcryptoОпубліковано о 2026-03-16Востаннє оновлено о 2026-03-16

Анотація

SIREN surged over 10% to around $0.65 despite an 8.35% decline in trading volume to approximately $13.98M, highlighting a divergence between rising price strength and weakening spot market participation. The rally is approaching the key $0.70 resistance level, a historically significant for limiting upward moves. Technical indicators like Parabolic SAR and MACD support bullish momentum, with the MACD line rising above the signal line. Open Interest increased by 10.16% to $67.71M, indicating stronger derivatives engagement, while significant short liquidations—totaling $441.66K—suggest a short squeeze amplified the price surge. However, the decline in spot volume raises concerns about the sustainability of the rally above $0.70 without broader market participation.

SIREN has surged over 10% in the past 24 hours, reaching around $0.65 even as trading volume declines 8.35% to roughly $13.98M.

Such divergence highlights rising price strength alongside weakening Spot participation. Price acceleration toward the upper range has occurred despite this contraction in activity.

However, declining volume often signals thinner market participation during rallies. As a result, traders closely monitor whether buyers continue absorbing available liquidity for Siren’s [SIREN] rally continuation.

SIREN breakout rally targets the $0.70 ceiling

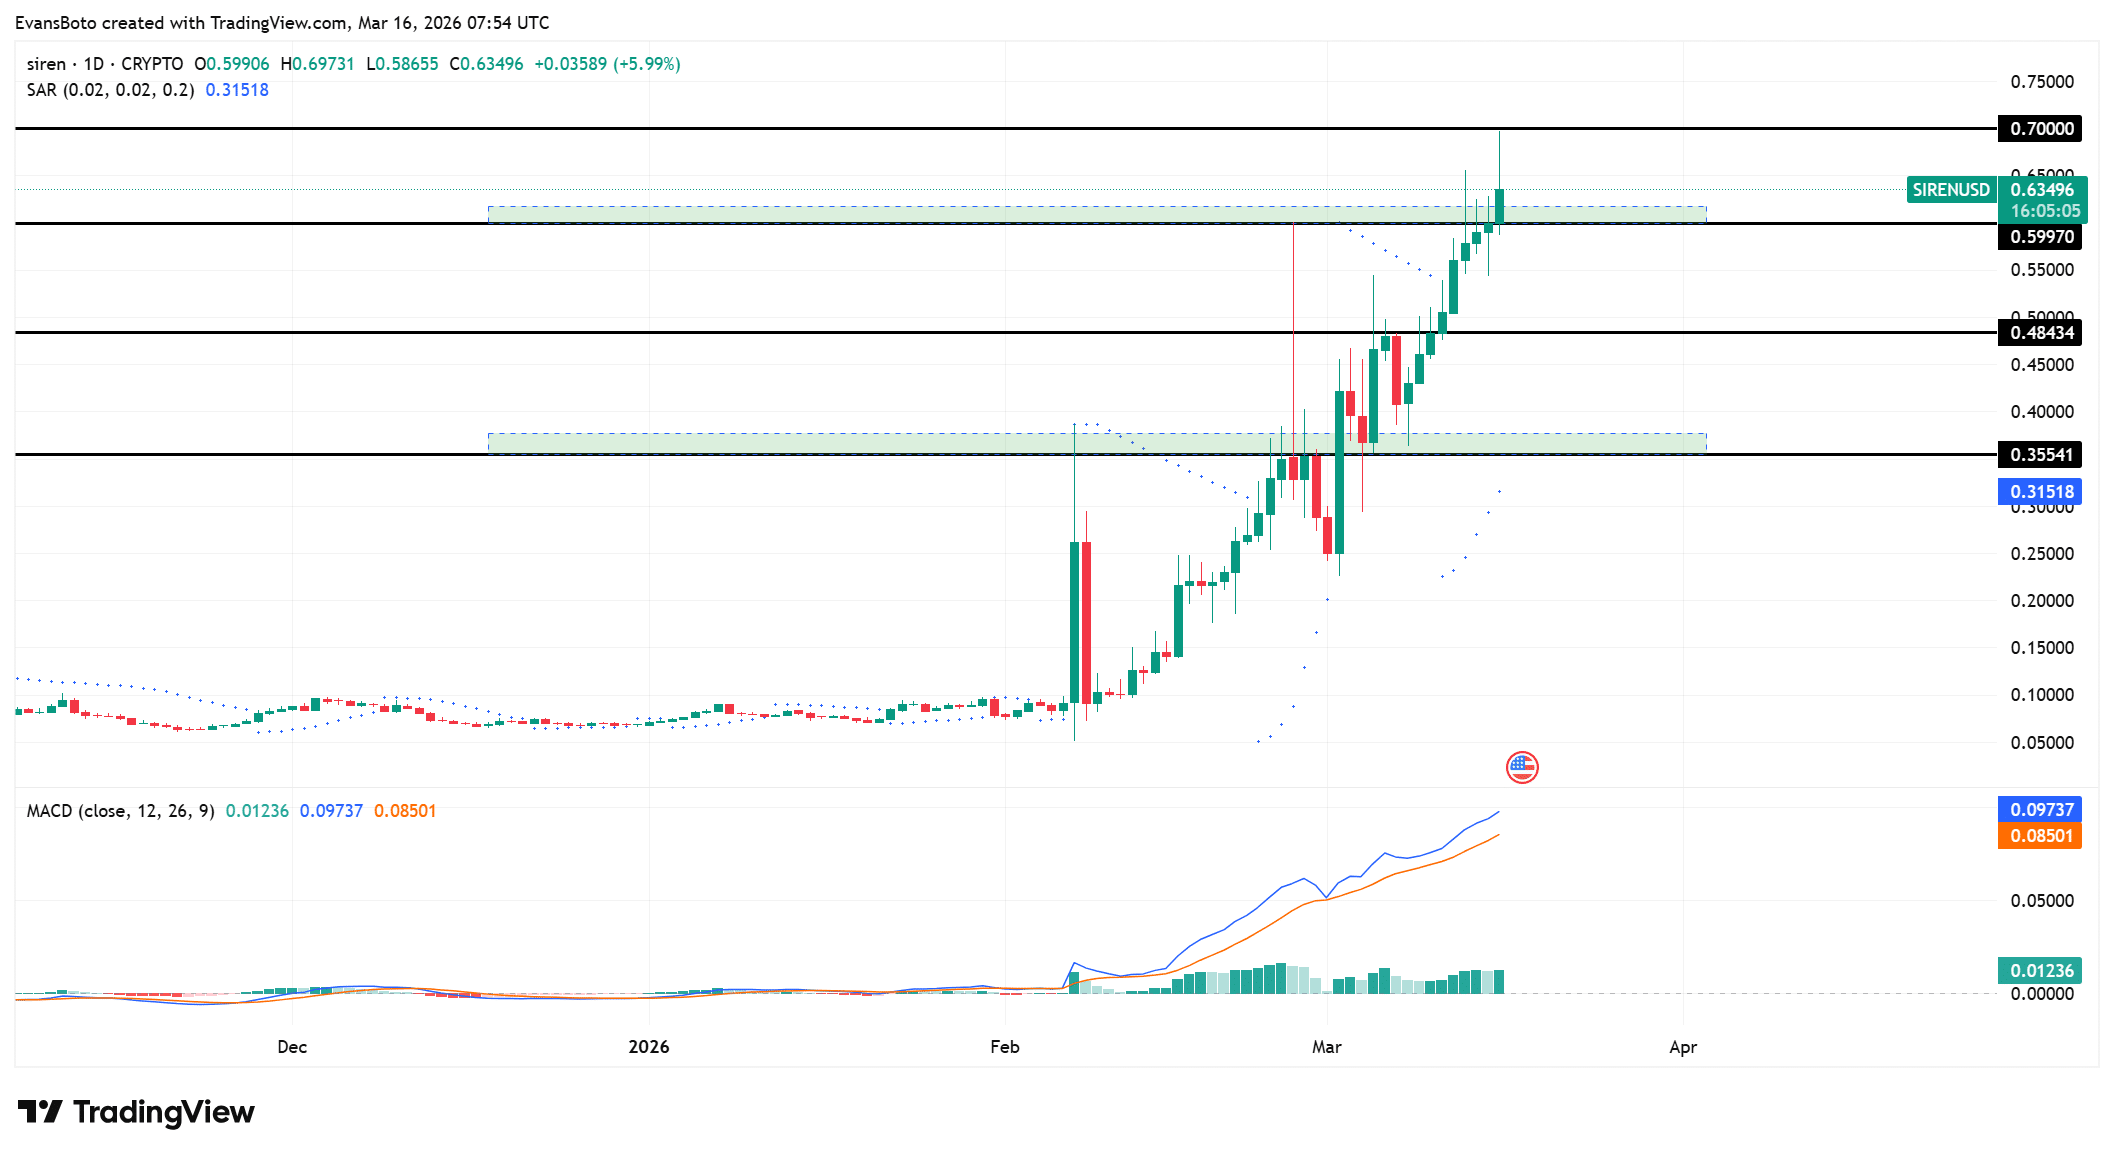
SIREN has pushed toward the $0.70 resistance after reclaiming the $0.60 breakout zone on the daily chart.

The move follows a powerful expansion from the $0.355 demand region established earlier. Price has printed successive higher highs while maintaining a strong bullish structure.

This climb shows persistent buying pressure dominating recent sessions. However, the rally now approaches a major horizontal resistance cluster near $0.70.

This zone historically limits upward continuation and often attracts profit-taking. Recent candles have already tested this area as price briefly spiked toward the upper boundary. The structure suggests strong trend continuation across recent weeks.

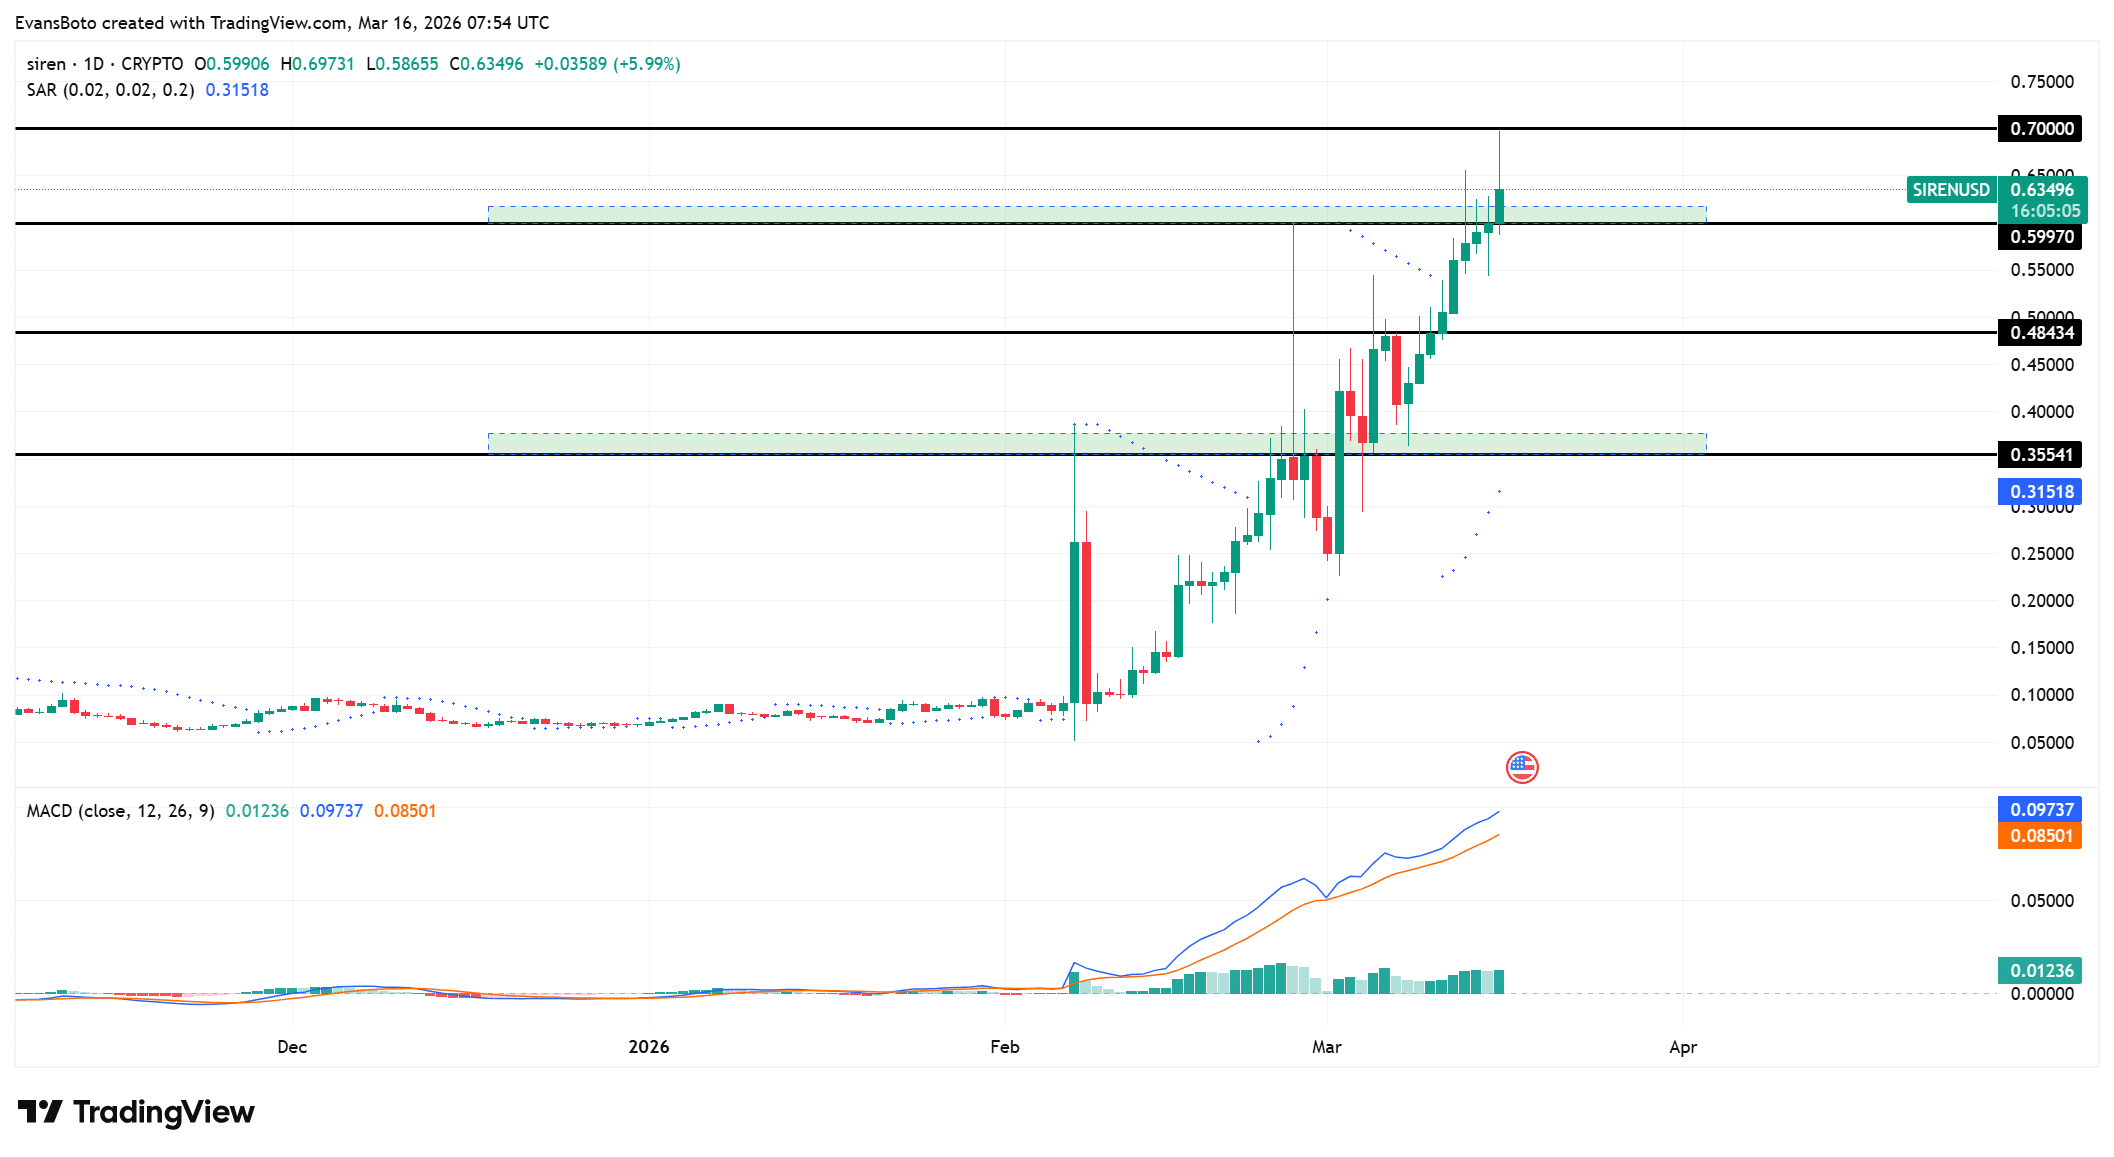
Parabolic SAR dots have flipped beneath the price near the $0.315 level. This shift indicates sustained upward trend confirmation after earlier consolidation phases.

Meanwhile, the MACD line has crossed above the signal line and continues rising steadily. The MACD reading currently sits near 0.097, while the signal line holds around 0.085.

This configuration signals expanding bullish strength within the trend structure. Green histogram bars have also continued increasing, reinforcing the upward directional bias.
Source: TradingView

Rising OI signals stronger trader participation

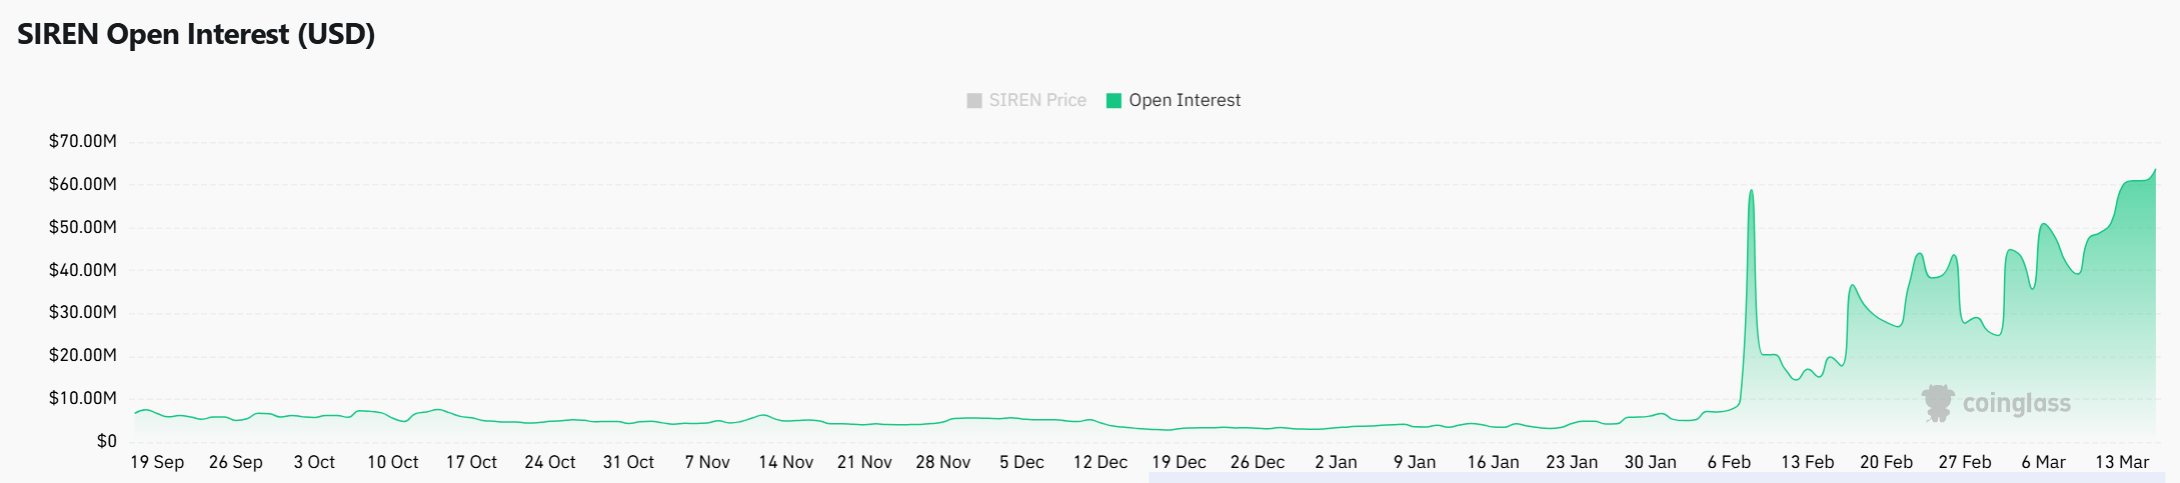
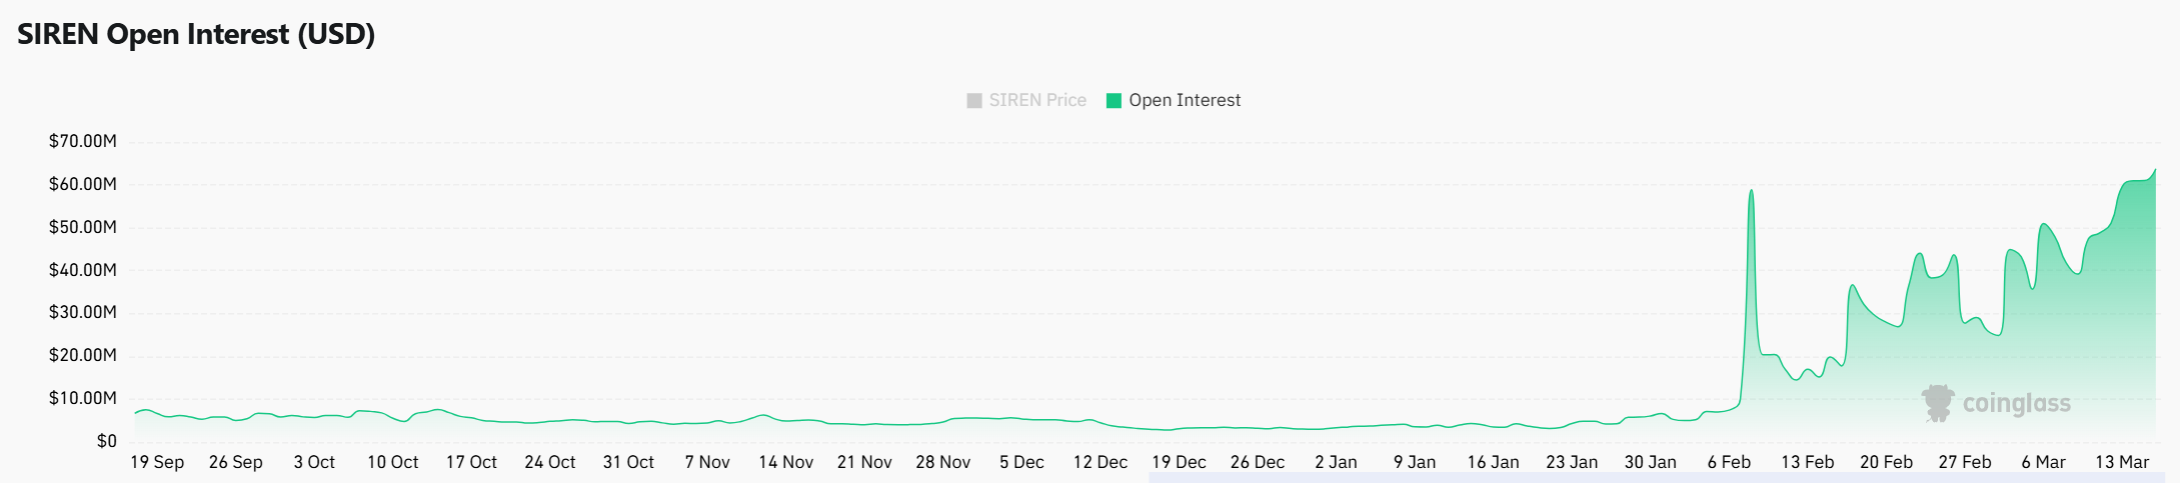
Derivatives participation has expanded rapidly as Open Interest climbed by 10.16% to approximately $67.71M.

This increase indicates rising trader involvement during the recent price surge. Growing Open Interest alongside rising price often reflects new positions entering the market.

Traders therefore appear to increase leveraged exposure as SIREN approaches resistance levels. The expansion also highlights stronger derivatives market engagement compared with earlier weeks.

Higher positioning activity frequently amplifies volatility across short-term trading sessions. However, expanding Open Interest can intensify both upward continuation and sudden reversals. Therefore, market participants continue monitoring derivatives flows carefully.
Source: CoinGlass

SIREN short liquidations ignite powerful squeeze

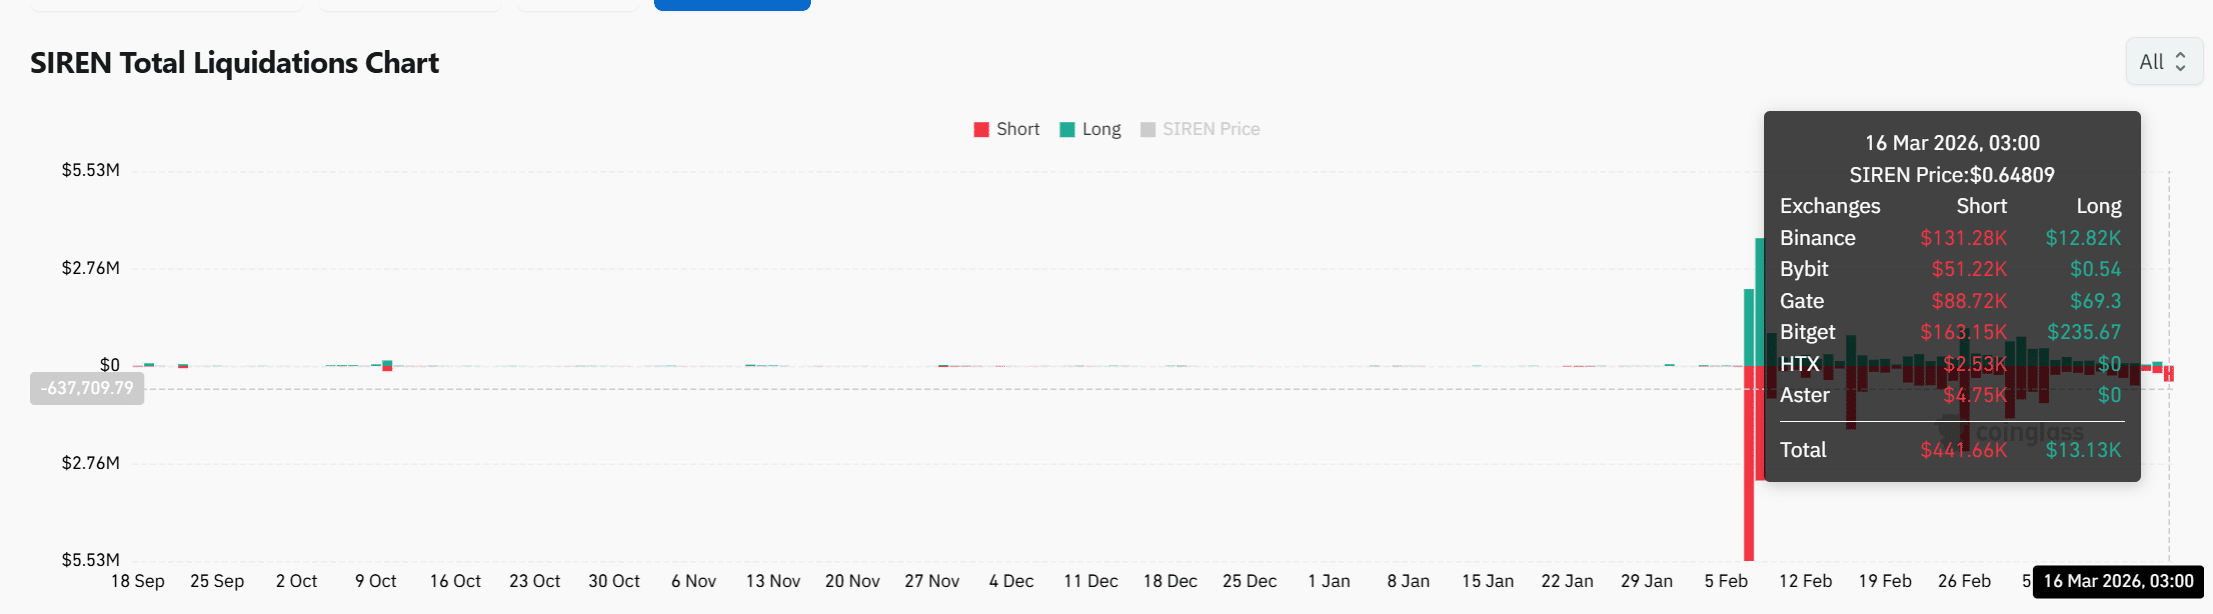
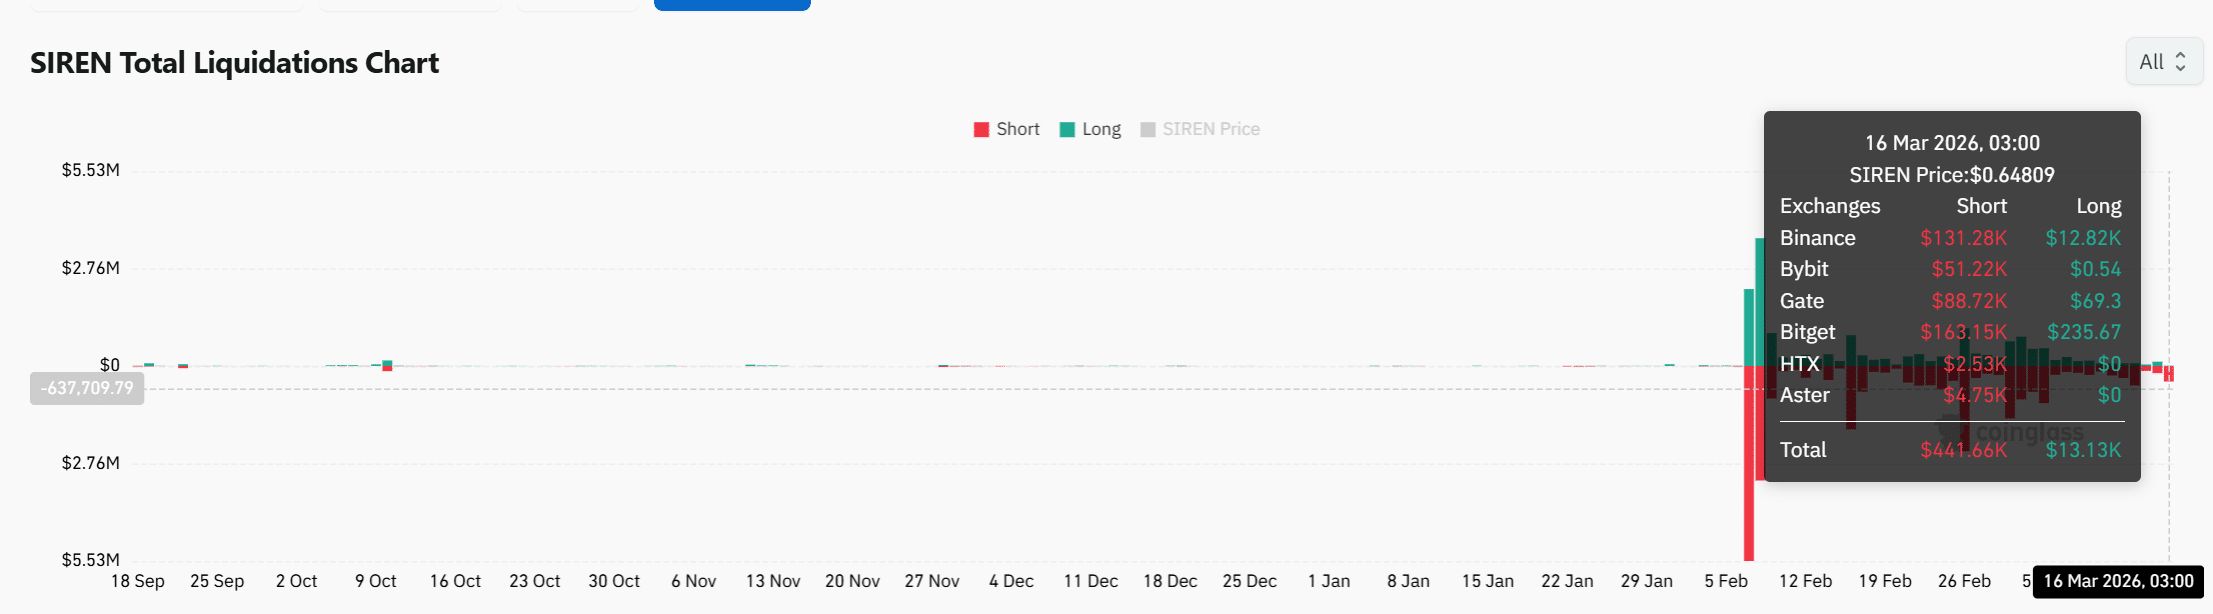
Liquidation data currently reveals strong short squeeze activity across major exchanges. Roughly $441.66K in short positions have faced liquidation compared with only $13.13K in long liquidations.

This imbalance highlights aggressive bearish positions getting forced out of the market.

Binance, Bybit, Gate, and Bitget have contributed to the majority of these liquidations. As SIREN surged upward, many short traders faced forced exits that accelerated the rally.

Such liquidation cascades often trigger rapid price expansions during strong uptrends. However, short squeezes typically amplify volatility within already rising markets.

This dynamic suggests the recent rally partly reflects forced covering rather than organic buying alone. Even so, liquidation pressure has clearly intensified the upward move toward the $0.70 resistance level.
Source: CoinGlass

SIREN’s rally currently draws strength from rising open interest, which has climbed to $67.71M as derivatives participation expands.

However, trading volume has dropped to about $13.98M, indicating weaker Spot participation behind the surge.

This imbalance suggests the rally may struggle to sustain above the $0.70 resistance without stronger Spot demand supporting the advance.


Final Summary

  • Strong derivatives participation has fueled SIREN’s rally, yet sustained continuation requires deeper Spot market participation.
  • Price strength reflects aggressive positioning and technical alignment, yet durable trends usually demand broader buyer conviction.


Пов'язані питання

QWhat is the current price of SIREN and how much has it surged in the past 24 hours?

ASIREN is currently priced around $0.65, having surged over 10% in the past 24 hours.

QDespite the price increase, what concerning trend is observed in the trading volume?

ADespite the price surge, the trading volume has declined by 8.35% to approximately $13.98 million, indicating weaker spot market participation.

QWhat key resistance level is SIREN approaching according to the technical analysis?

ASIREN is approaching a major horizontal resistance cluster near the $0.70 level, which has historically limited upward continuation.

QHow has the Open Interest (OI) changed, and what does this indicate about trader sentiment?

AOpen Interest has climbed by 10.16% to approximately $67.71 million, indicating rising trader involvement and leveraged exposure as the price surges.

QWhat does the significant imbalance between short and long liquidations suggest about the recent price movement?

AThe significant imbalance, with $441.66K in short liquidations compared to only $13.13K in long liquidations, suggests a powerful short squeeze that has accelerated the rally, adding volatility.

Пов'язані матеріали

Once-Popular Web3 Enters Wave of Layoffs

The once-hot Web3 industry is experiencing a severe wave of layoffs. While many companies attribute job cuts to AI-driven restructuring, the primary reason is often financial pressure. The Web3 sector, at the intersection of tech and finance, has been hit particularly hard. Employees at major cryptocurrency exchanges report sudden, impersonal layoffs—often with system access revoked overnight—and minimal or no severance. Common tactics include setting impossible performance targets or terminating employees for minor policy violations. The working atmosphere has become toxic, marked by intense monitoring, excessive meetings, and management obsessed with control and internal politics rather than product innovation. The industry's core business model is collapsing. Exchange revenue from trading fees and listing charges has plummeted due to a decline in quality projects and retail investor exodus. Events like the massive forced liquidation on October 10th further shattered confidence. Competition from on-chain derivatives platforms and prediction markets is intensifying the downturn. As layoffs continue, displaced workers struggle to find new opportunities. Many transition to the AI sector, but face significant bias from traditional finance and even some AI firms, which view crypto industry experience with suspicion. The current downturn appears more structural than cyclical, driven by unsustainable practices, internal strife, and a failure to innovate, raising questions about the industry's future trajectory.

marsbit10 хв тому

Once-Popular Web3 Enters Wave of Layoffs

marsbit10 хв тому

Sales Drop 26% But Prices Rise? Xiaomi's Dilemma

Xiaomi, facing a significant 26.3% year-on-year decline in global smartphone shipments in Q2 2026, has implemented its third price hike of the year. On August 2nd, prices were raised for nine models, including the flagship Mi 17 series (up 400-500 yuan) and Redmi K90/Turbo 5 series (up 300 yuan). This move completes a pattern where cost pressure, originating from surging memory chip prices, has climbed from entry-level to mid-range and now flagship products. The primary driver is a severe supply squeeze on consumer-grade DRAM and NAND flash memory, as major manufacturers like Samsung shift advanced capacity to more profitable HBM for AI applications. According to Xiaomi President Lu Weibing, memory prices for the same configuration have skyrocketed nearly fourfold since Q1 2025, adding roughly 1500 yuan to the cost of a mainstream 12GB+512GB phone. IDC estimates consumer memory costs have risen nearly 300% year-on-year. While the price increases hurt demand and contributed to the sales slump, Xiaomi's strategy of reducing entry-level models and upgrading its product mix also played a role. Domestically, its market share in China fell to 12% (5th place), while leaders Huawei and Apple saw shipments grow over 24%. To mitigate future risks, Xiaomi is accelerating its in-house "Surge" chip development and optimizing memory configurations across its lineup. Xiaomi is not alone; major brands like OPPO, vivo, and Apple have already raised prices in 2026, with industry insiders predicting another round of increases (200-800 yuan) in the second half. A full-scale industry-wide涨价 cycle is underway, forcing both manufacturers and consumers to recalibrate their strategies and purchasing decisions amid sustained cost pressures.

marsbit21 хв тому

Sales Drop 26% But Prices Rise? Xiaomi's Dilemma

marsbit21 хв тому

Three Consecutive Quarters of Decline: The Crypto Market is Experiencing Its Longest Ebb Since 2022

The cryptocurrency market experienced its third consecutive quarterly decline in Q2 2026, marking its longest downturn since 2022, according to a CoinGecko report. The total market capitalization fell 12.6% to $2.1 trillion, a retreat of roughly 52% from its October 2025 peak. Multiple indicators signal an orderly capital exit from the sector. For the first time since Q3 2023, the total stablecoin market cap shrank (-1.6% to $305.1B), indicating funds are leaving the ecosystem entirely, not just rotating to safer crypto assets. Trading volumes on centralized exchanges dropped 27.9%, while DeFi's Total Value Locked (TVL) plummeted 23.4%. Both Bitcoin (-14.2%) and Ethereum (-25.4%) underperformed traditional risk assets like equities in Q2, breaking from previous correlative narratives. Ethereum saw its first-ever three-quarter losing streak, with its market share falling to around 10%. A few areas saw growth. Prediction market volumes surged 48.7%, largely driven by sports betting. Hyperliquid's HYPE token entered the top 10 by market cap, and tokenized collectibles platforms grew, though primarily via gamified mechanics. Despite a ~9.8% Bitcoin rebound in July, historical trends suggest caution for August. The market, now ~49% below its 2025 high, is undergoing a measured retreat. Its recovery hinges on future Federal Reserve policy and the industry's ability to develop sustainable revenue streams beyond speculation.

marsbit35 хв тому

Three Consecutive Quarters of Decline: The Crypto Market is Experiencing Its Longest Ebb Since 2022

marsbit35 хв тому

Торгівля

Спот
活动图片