Semiconductor Mid-Game Check-in: How Much Left in the Tail-End Rally?

marsbitОпубліковано о 2026-08-20Востаннє оновлено о 2026-08-20

Анотація

Semiconductor Mid-Game Review: How Much is Left in the Rally? This analysis compares the current semiconductor market trend to NVIDIA's trajectory in 2024, drawing lessons on identifying market tops and bottoms. In July-August 2024, NVIDIA's stock fell 33%, triggered by a combination of "fundamental rumors" (Blackwell delays, antitrust probes) and "macro-driven asset selling" (BOJ rate hike leading to carry-trade unwinding). The low was marked by extreme panic selling across global markets. Key characteristics of a TOP include: Technical patterns like double tops or failure to break highs; Overcrowded and leveraged positioning (e.g., excessive retail and ETF inflows into a single stock like NVDA); High fragility where even a minor fundamental disappointment (e.g., a slight margin dip in stellar earnings) triggers a sharp correction. The practical action is to reduce exposure upon seeing technical warning signs combined with crowded trades. Key characteristics of a BOTTOM include: Technical reversal signals like a high-volume bullish engulfing pattern after a steep drop; Panic indicators hitting extremes (e.g., record VIX, major index crashes) signaling selling exhaustion; The downturn being driven by macro or systemic shocks unrelated to the company's core business fundamentals, creating a mispricing that quality companies eventually recover from. The conclusion is that while the current semiconductor rally may be in its later stages ("fish tail"), understanding these pa...

Author: XinGPT

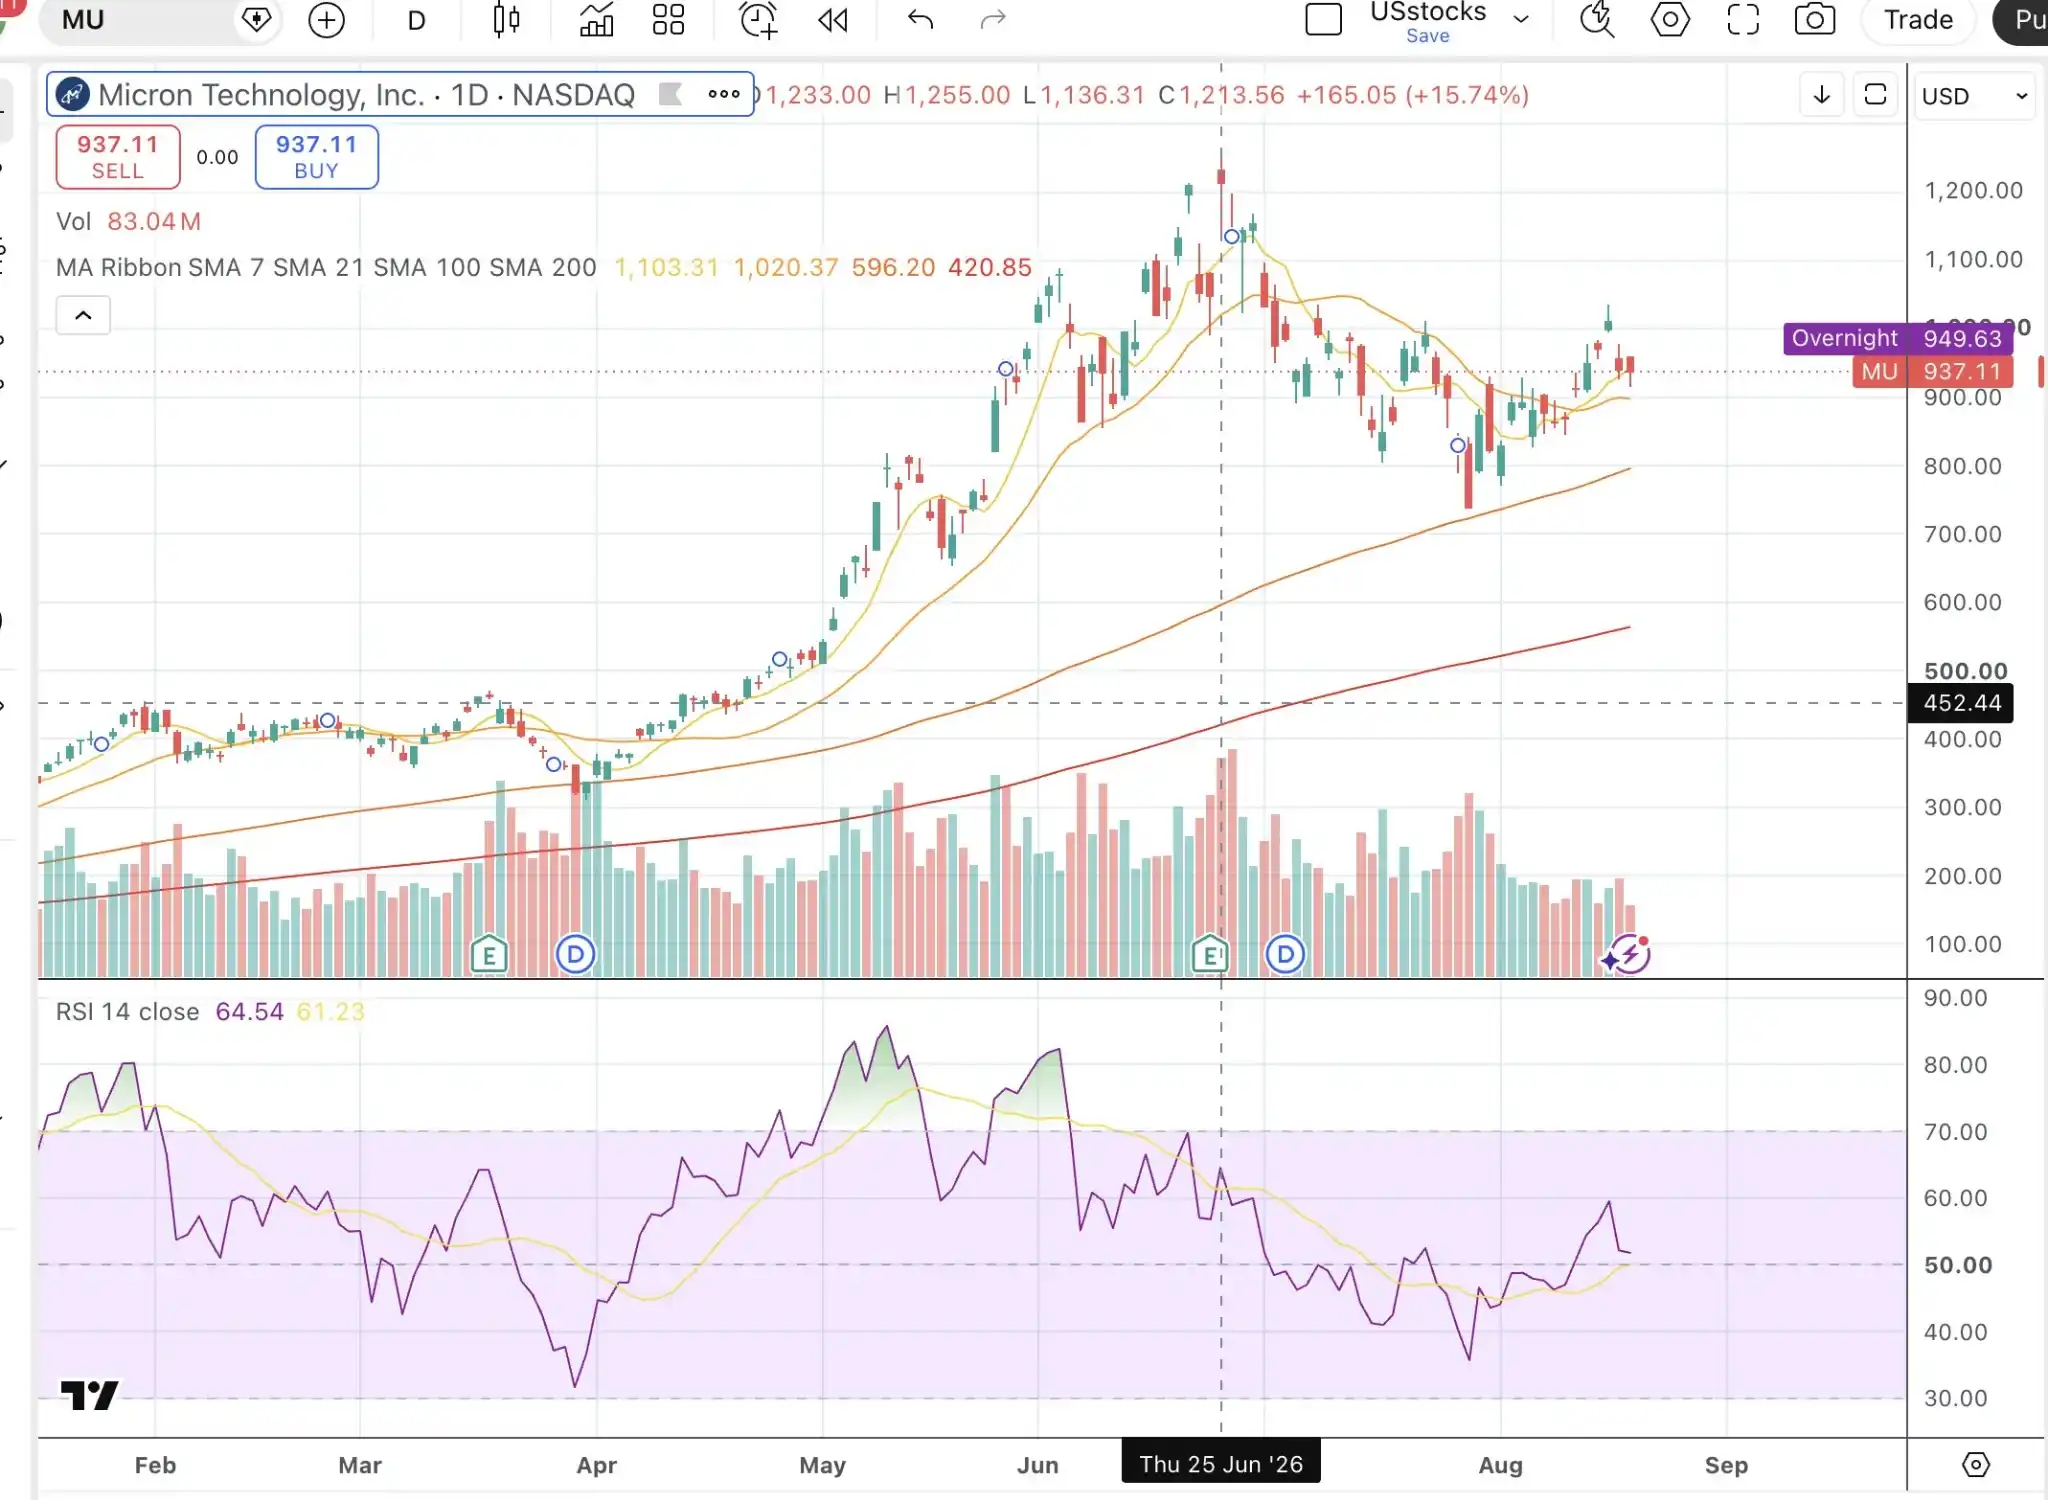
The current semiconductor market trend somewhat resembles the script from Nvidia in 2024. Let's review what happened then:

From July 11 to August 5, 2024, Nvidia fell from around $134 to $90.94, a drop of 33%.
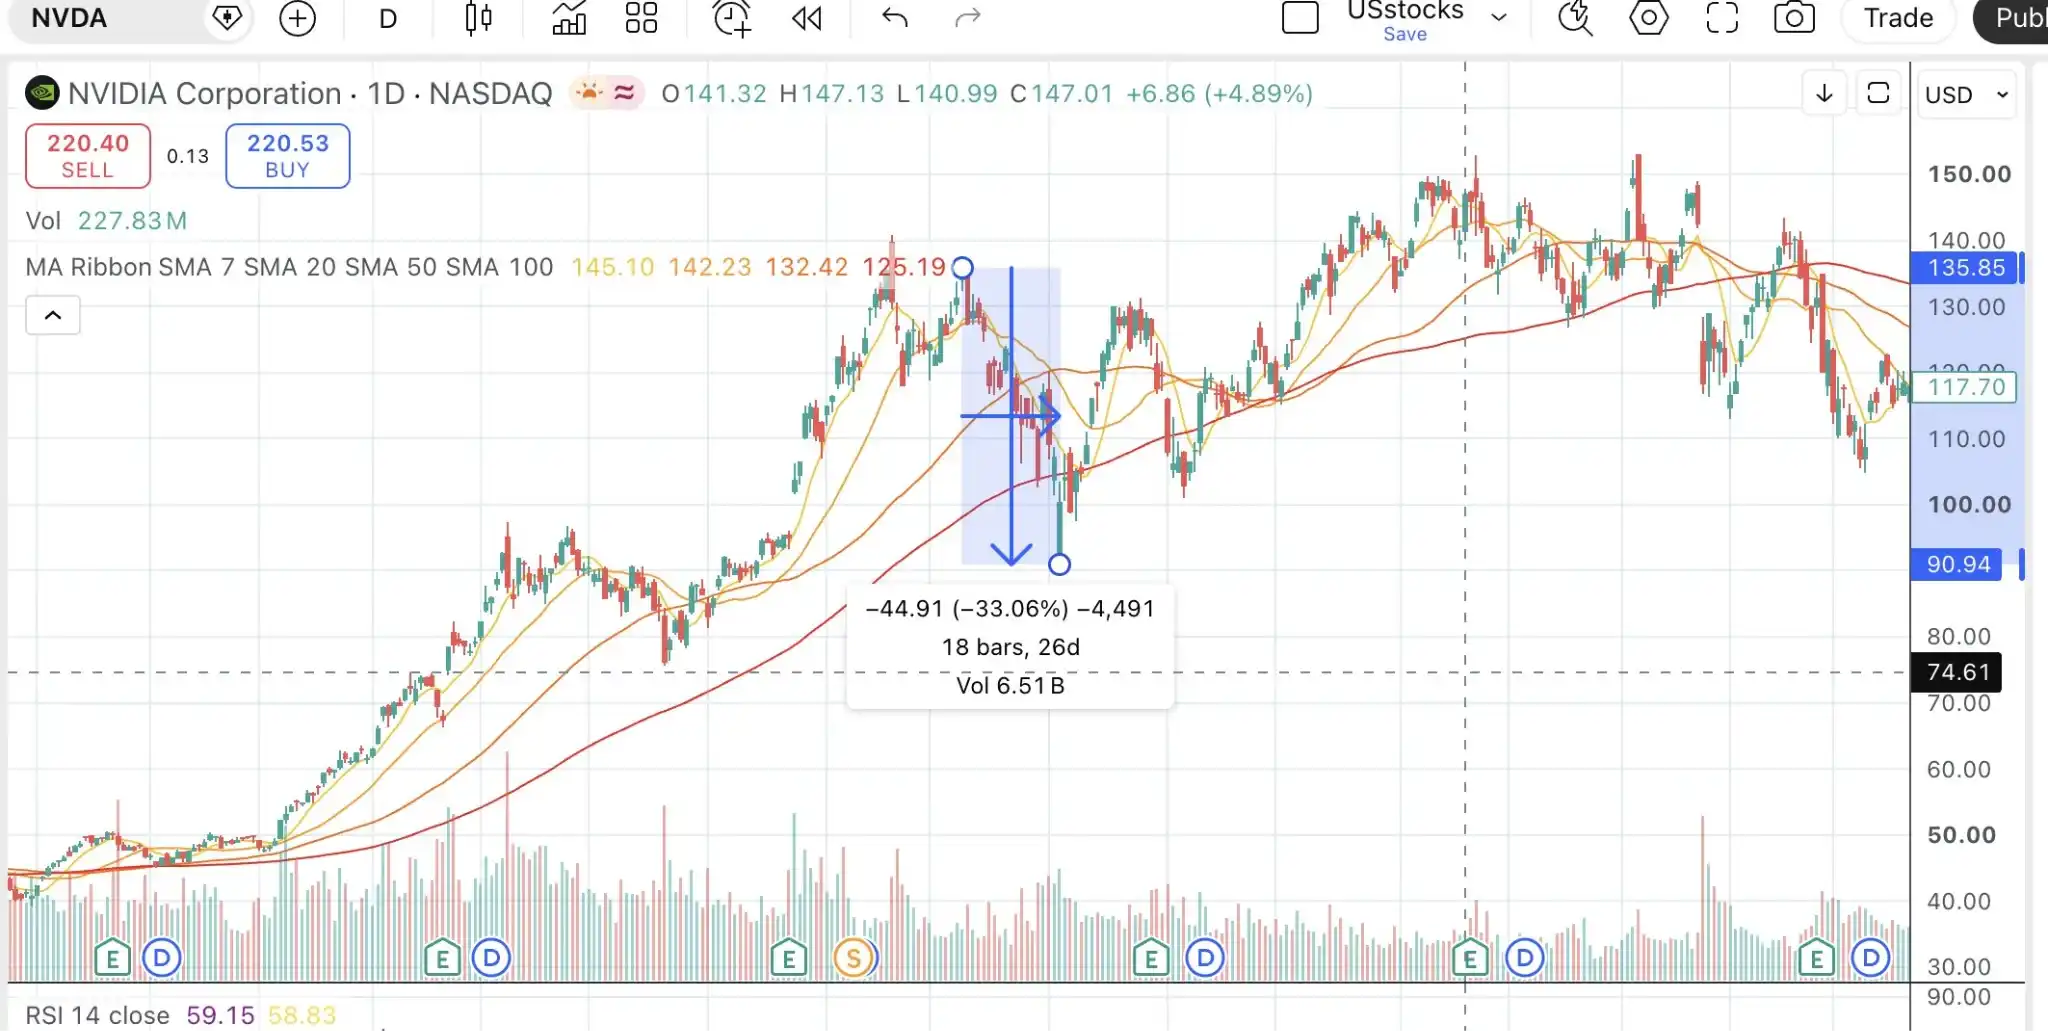
On the news front, triggers for the decline included rumors of Blackwell delays starting in July, reports of a US Department of Justice antitrust investigation, and finally, the Bank of Japan's interest rate hike on August 5th, which triggered carry trade unwinding and a panic sell-off in global risk assets, hitting the low. In other words, "a mix of fundamental rumors/small stories + macro-driven asset sell-off."

From August 8th to September 6th, over the course of a month, the stock rebounded from being oversold, coupled with some policy easing on the macro front; but it didn't surpass the previous high. Nvidia's "good but not perfect" earnings report triggered another decline.

Subsequently, on September 11th, Nvidia announced that Blackwell had entered full production and shipments would begin in Q4. Nvidia's stock rose 8% that day. Coupled with the Fed's first 50bp rate cut in 4 years, Nvidia's stock price broke to a new all-time high again on November 8th.

What can we learn from history?

1. What are the characteristics of a阶段性 (stage-wise) top?

Technical: Double top or failure to break through the previous high resistance level; simultaneously, candlestick patterns show bearish engulfing patterns;

Crowded positioning + high leverage: In June 2024, 70% of fund managers believed being long the Mag7 was the most crowded trade, while small-cap short interest approached historical records. The entire market was crowded on one side of the boat;

In the five trading days leading up to August 27, 2024, during another top interval for Nvidia's stock price, retail investors net bought $1.4 billion worth of NVDA. In the same period, the second-place, Tesla, was only at the $100-200 million level, a nearly tenfold difference. NVDL (the 2x Long NVDA ETF) had net inflows of $3.5 billion for the year and repeatedly became the most actively traded instrument intraday.

Fundamentals: On August 28th, Nvidia's earnings report showed revenue and guidance exceeding expectations, but because gross margin fell by 3%, the stock dropped nearly 7% after hours.

So, it's not hard to see that the characteristics of a stage-wise top are the emergence of topping patterns on the technical side, coupled with increased fragility in positioning (high concentration, high leverage). Once there's any hint of trouble in fundamentals or news, the stock price will immediately plummet.

The practical approach is: once technical characteristics appear for identification, and if positioning shows excessive leverage and concentration, one should immediately reduce holdings to hedge risks. Once the downtrend is confirmed, sell.

2. Bottom characteristics

Technical: On August 5th, a long-bodied candlestick after a gap down open, with sufficient volume — 553 million shares was the highest single-day trading volume in that period, exceeding all surrounding trading days. On August 6th, it closed above the previous day's body, confirming an engulfing pattern. On the 7th, a pullback did not break the previous low.

These three days formed the technical signal for a bottom.
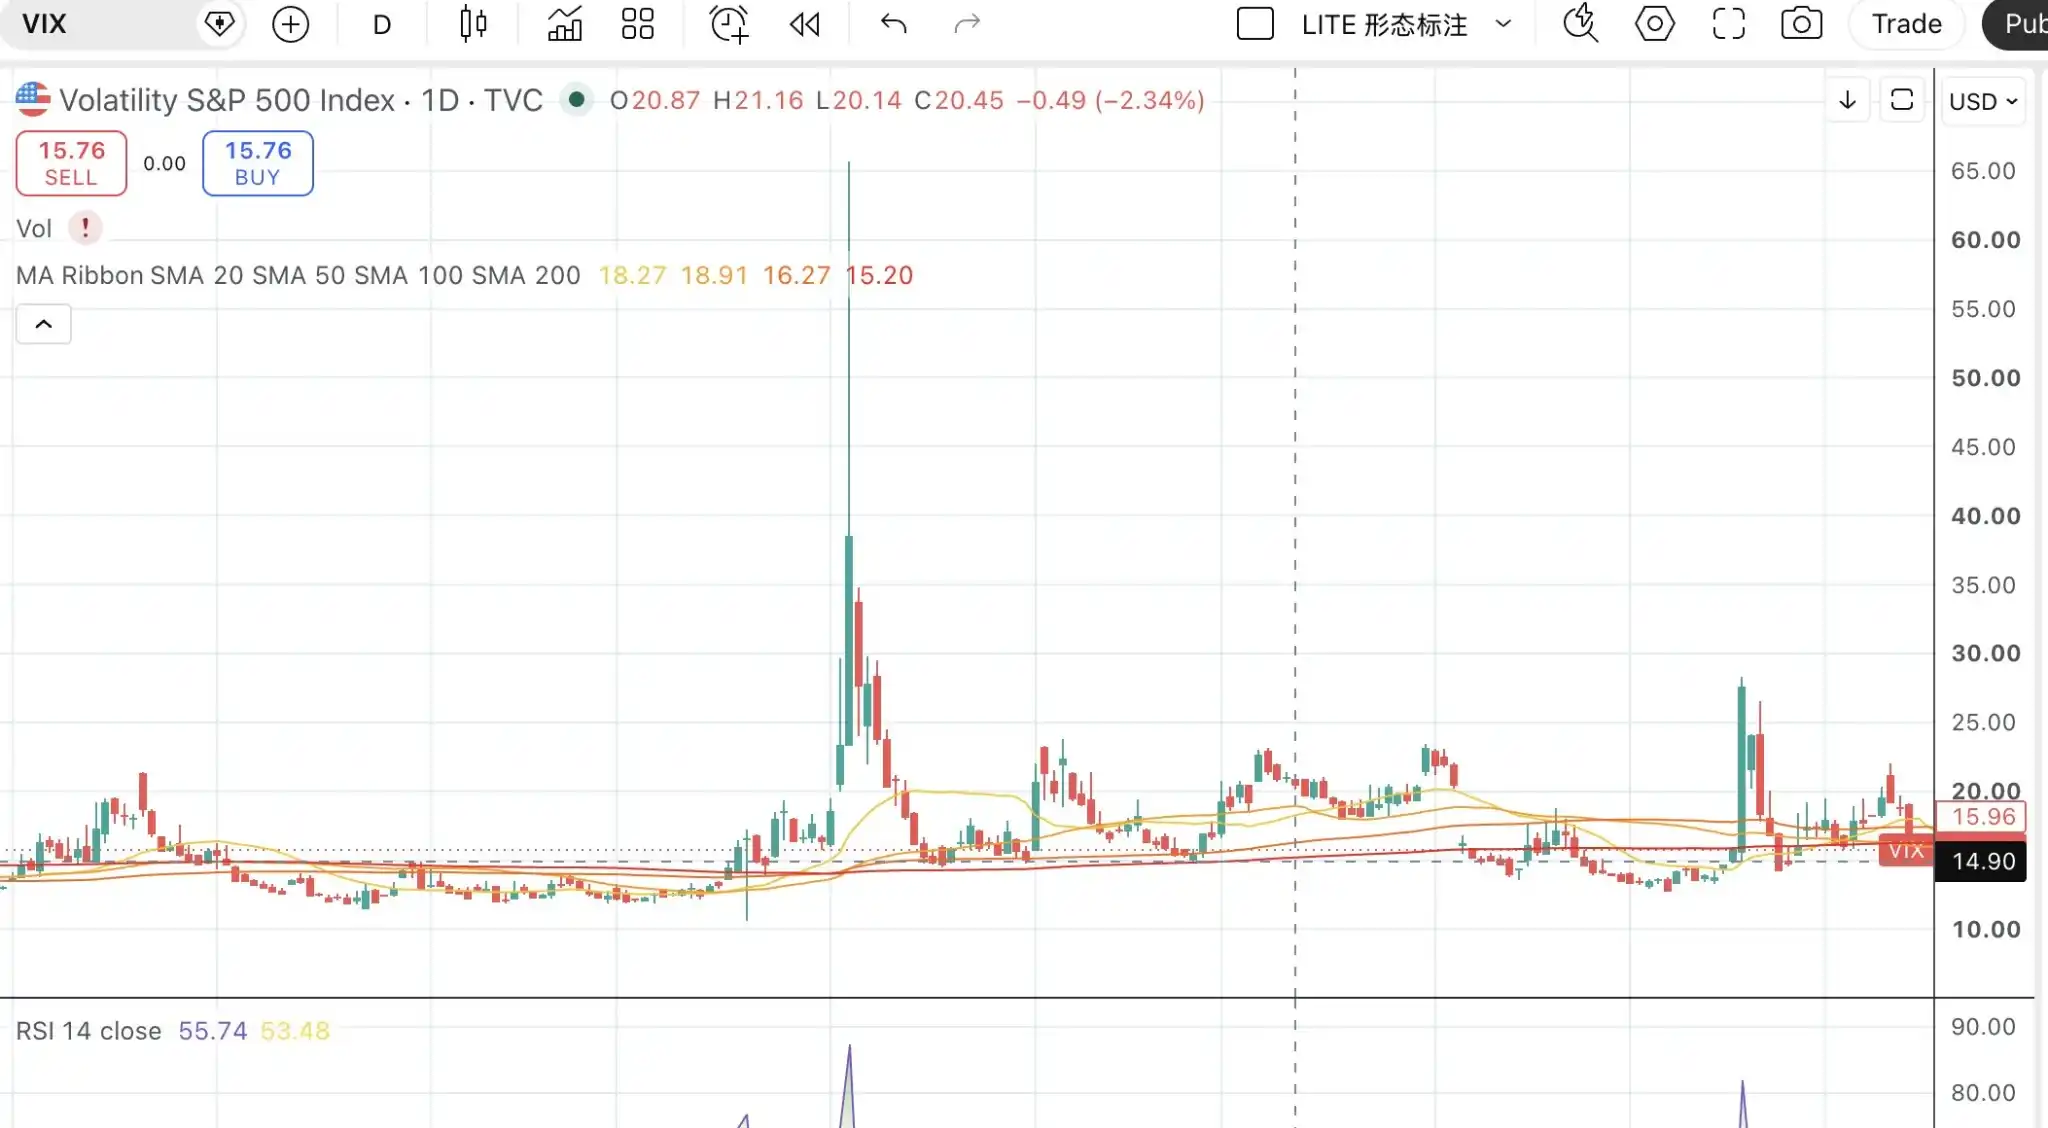
We further confirm with positioning: The VIX指数 (VIX index) hit a record that day, reaching 65 intraday (the third highest in history);外围市场 (peripheral markets) like the Nikkei were down -12.4% (largest since 1987), KOSPI down -9% triggering a circuit breaker. All market-level恐慌指标 (panic indicators) were off the charts, also meaning selling pressure reached an extreme;

Fundamentally, the main bearish trigger chain was the BoJ's rate hike on July 31st, yen carry trade unwinding, and the US July non-farm payrolls at 114k, far below expectations. This was a macro-driven sell-off for the broader market, unrelated to Nvidia's fundamentals.

The rebound on September 6th followed similar logic, just not as extreme as on August 5th.

We can also identify bottom characteristics: first, technical patterns begin to show bottoming formations, especially confirmed by volume; second, the logic of the decline does not touch the core business fundamentals of the enterprise. It's more often a one-off macro event or short-term shock for the broader market. Ultimately, quality companies will see their prices修复 (recover from) the erroneous sell-off.
Трендові криптовалюти

Пов'язані питання

QWhat is the main analogy the author draws to analyze the current semiconductor market situation?

AThe author analogizes the current semiconductor market situation to the script of Nvidia in 2024, specifically comparing the potential phase of the semiconductor cycle ('fish tail' phase) to Nvidia's price action pattern from mid-2024.

QWhat were the combined factors that led to Nvidia's sharp decline in July-August 2024 according to the article?

AThe sharp decline was triggered by a combination of factors: fundamental rumors (like Blackwell delay), regulatory news (DOJ antitrust investigation), and a macro event (the Bank of Japan's rate hike leading to carry trade unwinding and a panic sell-off in global risk assets).

QAccording to the article, what are the key characteristics of a 'stage top' (díng) in a stock's price movement?

AThe key characteristics are: technical chart patterns showing a top (like a double top or failure to break previous highs), crowded and highly leveraged capital inflows which increase fragility, and a subsequent negative catalyst from fundamentals or news that triggers a sharp price drop.

QWhat technical and market signals indicated the formation of a bottom for Nvidia on August 5, 2024?

AThe bottom was indicated by technical signals: a long-bodied bullish candlestick on high volume (the highest in that period) on August 5th, followed by a confirming pattern in the next two days. Market signals included extreme fear indicators like a spike in the VIX index and major sell-offs in other global markets, suggesting selling pressure had peaked.

QWhat practical trading advice does the article suggest once signs of a potential top appear?

AThe article suggests that once technical top signals appear, especially if accompanied by signs of excessive leverage and crowded positioning, an investor should immediately reduce position size to hedge risk. If a confirmed downtrend begins, one should sell the position.

Пов'язані матеріали

Just Now, For the First Time in Human History, AI Cures Cancer

A Historic Leap: First AI-Designed, Personalized mRNA Cancer Therapy Succeeds in Phase 3 Trial In a landmark achievement for oncology, Moderna and Merck announced that their personalized mRNA cancer vaccine, intismeran autogene, has met its primary and key secondary endpoints in a global Phase 3 trial for high-risk melanoma. This marks the first successful Phase 3 result for an mRNA cancer therapy and a pioneering example of AI-driven, individualized medicine. The trial involved 1,137 patients with surgically resected stage IIB-IV melanoma. Participants received either the personalized mRNA vaccine combined with Merck's PD-1 inhibitor Keytruda or Keytruda alone. The combination therapy demonstrated a statistically significant and clinically meaningful improvement in recurrence-free survival (RFS) and distant metastasis-free survival (DMFS). The breakthrough lies in the "one-patient, one-therapy" approach. After tumor removal, AI algorithms analyze the patient's tumor DNA to identify up to 34 unique neoantigens—protein fragments specific to their cancer cells. Moderna's automated platform then designs and manufactures a custom mRNA vaccine encoding these targets. When administered, the vaccine trains the patient's immune system to recognize and destroy residual cancer cells expressing those neoantigens, while Keytruda helps activate the immune response. This success validates a powerful platform technology. Moderna and Merck are already expanding trials to other solid tumors, including non-small cell lung cancer and pancreatic cancer. With regulatory submissions planned, the therapy could be available for patients as early as 2027. The achievement signifies a new era where AI and mRNA technology converge to create highly targeted, effective cancer treatments.

marsbit2 хв тому

Just Now, For the First Time in Human History, AI Cures Cancer

marsbit2 хв тому

AI Debt Flood Peaks: September is the True Test for U.S. Treasuries

As U.S. Treasury yields show temporary signs of stabilizing, a more significant stress test looms. Following the Treasury's recent announcement to expand its buyback program for long-term bonds, easing market concerns, analysts warn the relief may be short-lived. The core challenge is a massive wave of investment-grade corporate bond issuance—estimated to reach $200 billion in September alone after the Labor Day holiday—driven primarily by Big Tech firms financing AI infrastructure. Companies like Microsoft, Alphabet, and Amazon are aggressively raising long-term debt to fund data centers, advanced chips, and AI services. This AI-related issuance is reaching record levels, competing directly with long-term Treasury bonds due to the tech firms' strong credit ratings and extended maturities. While Treasury buybacks provided a psychological boost, their scale remains small relative to overall debt. The AI financing surge, combined with persistent U.S. fiscal deficits, sticky inflation, and Federal Reserve uncertainty, is reshaping fixed-income supply and demand dynamics. Risks are building. Analysts caution that if Treasury yields stabilize, corporate bond spreads could widen, increasing market volatility. Some investors see parallels with the pre-2008 era of off-balance-sheet financing, raising concerns about capital deployment outpacing business model viability. With inflation pressures lingering globally and the total U.S. debt exceeding $40 trillion, the delicate balance between supply and demand in bond markets will face a true test in September.

marsbit3 хв тому

AI Debt Flood Peaks: September is the True Test for U.S. Treasuries

marsbit3 хв тому

Торгівля

Спот

Популярні статті

Як купити CHECK

Ласкаво просимо до HTX.com! Ми зробили покупку Checkmate (CHECK) простою та зручною. Дотримуйтесь нашої покрокової інструкції, щоб розпочати свою криптовалютну подорож.Крок 1: Створіть обліковий запис на HTXВикористовуйте свою електронну пошту або номер телефону, щоб зареєструвати обліковий запис на HTX безплатно. Пройдіть безпроблемну реєстрацію й отримайте доступ до всіх функцій.ЗареєструватисьКрок 2: Перейдіть до розділу Купити крипту і виберіть спосіб оплатиКредитна/дебетова картка: використовуйте вашу картку Visa або Mastercard, щоб миттєво купити Checkmate (CHECK).Баланс: використовуйте кошти з балансу вашого рахунку HTX для безперешкодної торгівлі.Треті особи: ми додали популярні способи оплати, такі як Google Pay та Apple Pay, щоб підвищити зручність.P2P: Торгуйте безпосередньо з іншими користувачами на HTX.Позабіржова торгівля (OTC): ми пропонуємо індивідуальні послуги та конкурентні обмінні курси для трейдерів.Крок 3: Зберігайте свої Checkmate (CHECK)Після придбання Checkmate (CHECK) збережіть його у своєму обліковому записі на HTX. Крім того, ви можете відправити його в інше місце за допомогою блокчейн-переказу або використовувати його для торгівлі іншими криптовалютами.Крок 4: Торгівля Checkmate (CHECK)Легко торгуйте Checkmate (CHECK) на спотовому ринку HTX. Просто увійдіть до свого облікового запису, виберіть торгову пару, укладайте угоди та спостерігайте за ними в режимі реального часу. Ми пропонуємо зручний досвід як для початківців, так і для досвідчених трейдерів.

426 переглядів усьогоОпубліковано 2026.01.19Оновлено 2026.06.02

Як купити CHECK

Обговорення

Ласкаво просимо до спільноти HTX. Тут ви можете бути в курсі останніх подій розвитку платформи та отримати доступ до професійної ринкової інформації. Нижче представлені думки користувачів щодо ціни CHECK (CHECK).

活动图片