Reading Trends from Data: The Logic Behind the Crypto Market Rebound and Potential Risks

marsbitОпубліковано о 2025-12-29Востаннє оновлено о 2025-12-29

Анотація

Analysis of the crypto market rebound and underlying risks, based on data for the week of Dec 20-26. Bitcoin found technical support at the $85,000 level, bouncing from a low of $84,500. While a technical rebound is underway, key data suggests the market is not yet on a solid footing for a sustained trend reversal. Key short-term data points show mixed picture: * **Stablecoins:** Net issuance remained negative at -$326M, but the outflow rate slowed by 60% week-over-week. * **BTC ETFs:** Net outflows worsened significantly to -$664.37M, a crucial headwind. A return to net inflows is deemed essential for a true reversal. * **OTC Premiums:** USDT and USDC premiums fell to 97.86% and 98.36% respectively, indicating weak demand and persistent capital outflows. * **ETH ETFs:** Outflows narrowed considerably to -$139.53M from the previous week, providing some relative stability for Ethereum. Mid-term on-chain data revealed minor accumulation by addresses holding 100-1K BTC, while larger wallets (10K-100K BTC) reduced holdings. Strong筹码 accumulation was noted near the $87,100 price point, suggesting it could become a key support level. The altcoin market (TOTAL3) saw a modest 1.95% gain but overall sentiment remained weak. Key observations include: * Low trading activity and a subdued market sentiment index. * BTC dominance held high at 65.76%, indicating altcoins continue to underperform Bitcoin. * Meme coins and high-profile tokens saw sporadic gains, but lacked s...

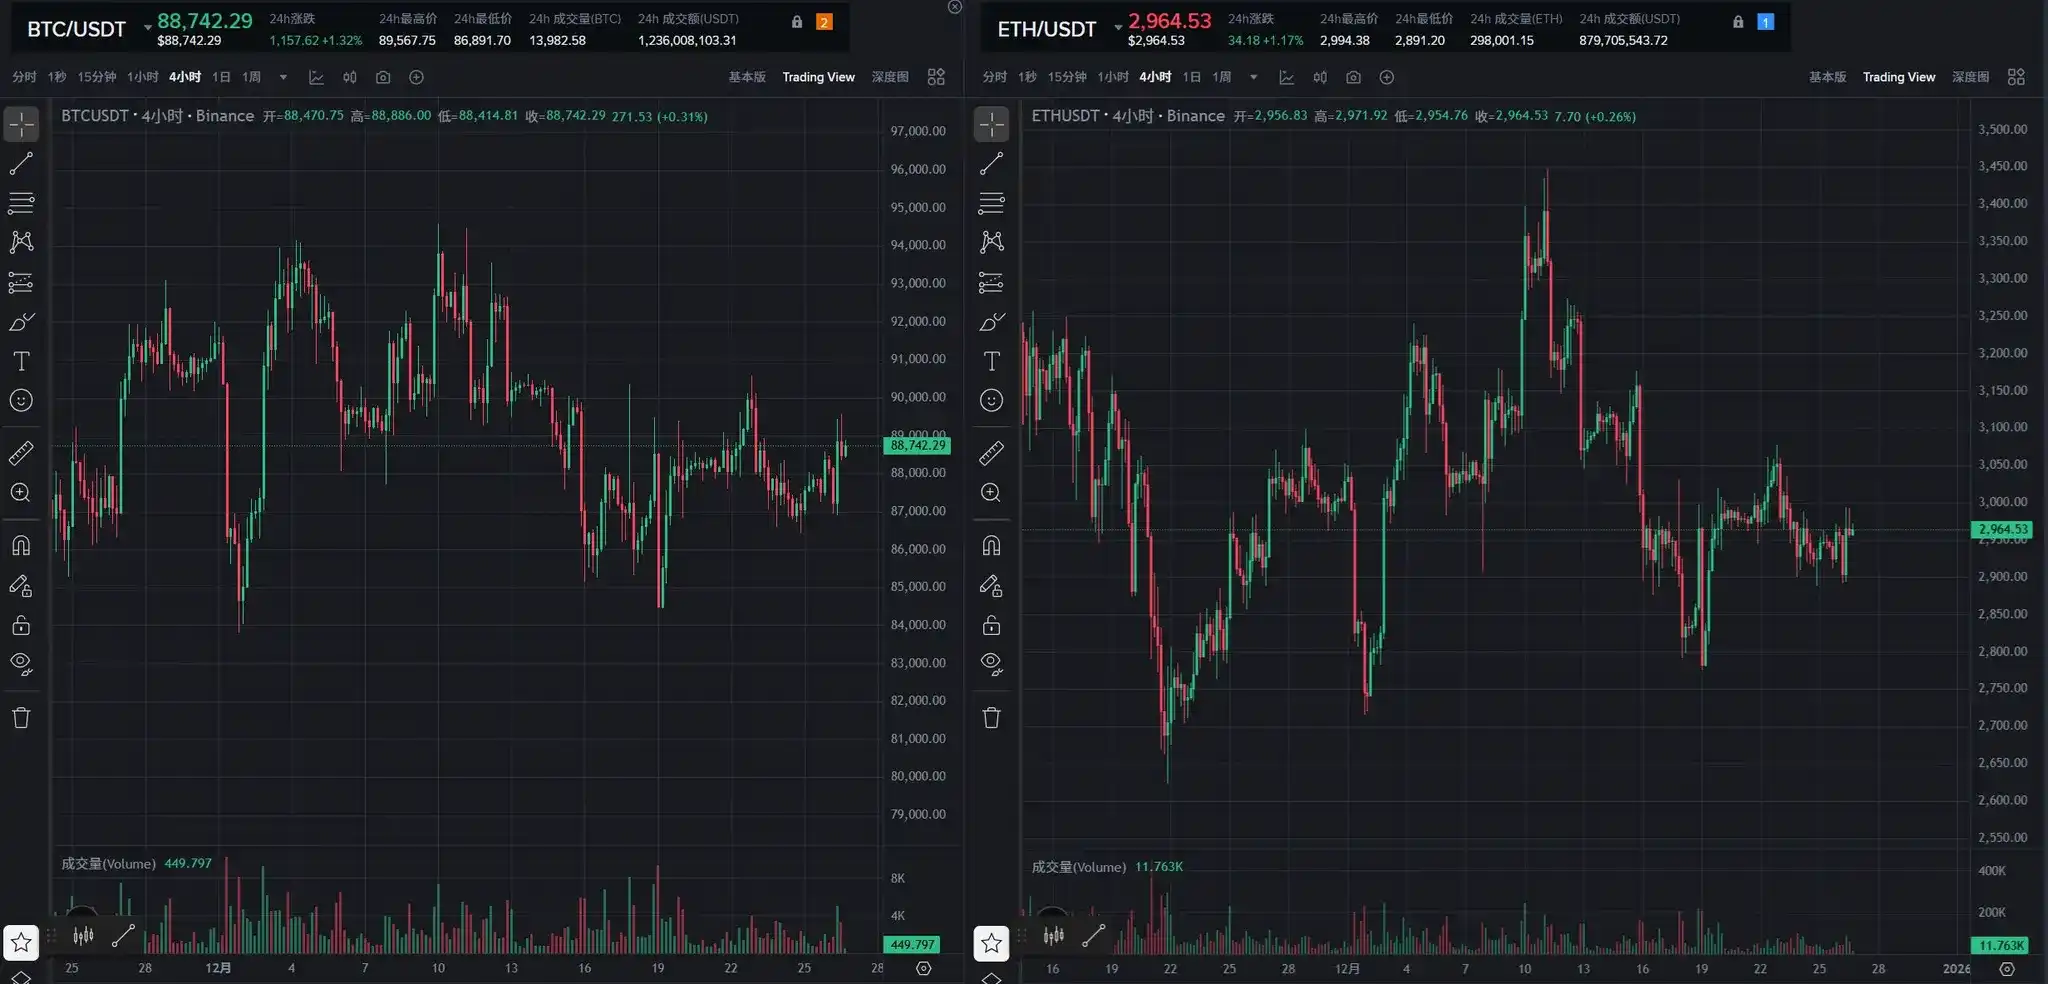
Last week, the market showed a downward trend, and the technical support level of $85,000 we previously emphasized proved effective. After BTC touched a low of $84,500 on Friday, it began a rebound this week. From both daily and weekly perspectives, the support level of $85,000 was validated after the previous continuous decline. Over the weekend, the market maintained its rebound momentum, showing an overall pattern of fluctuating recovery.
2. Mid- to Short-Term Data Changes Affecting the Market This Week

2.1 Stablecoin Fund Flows

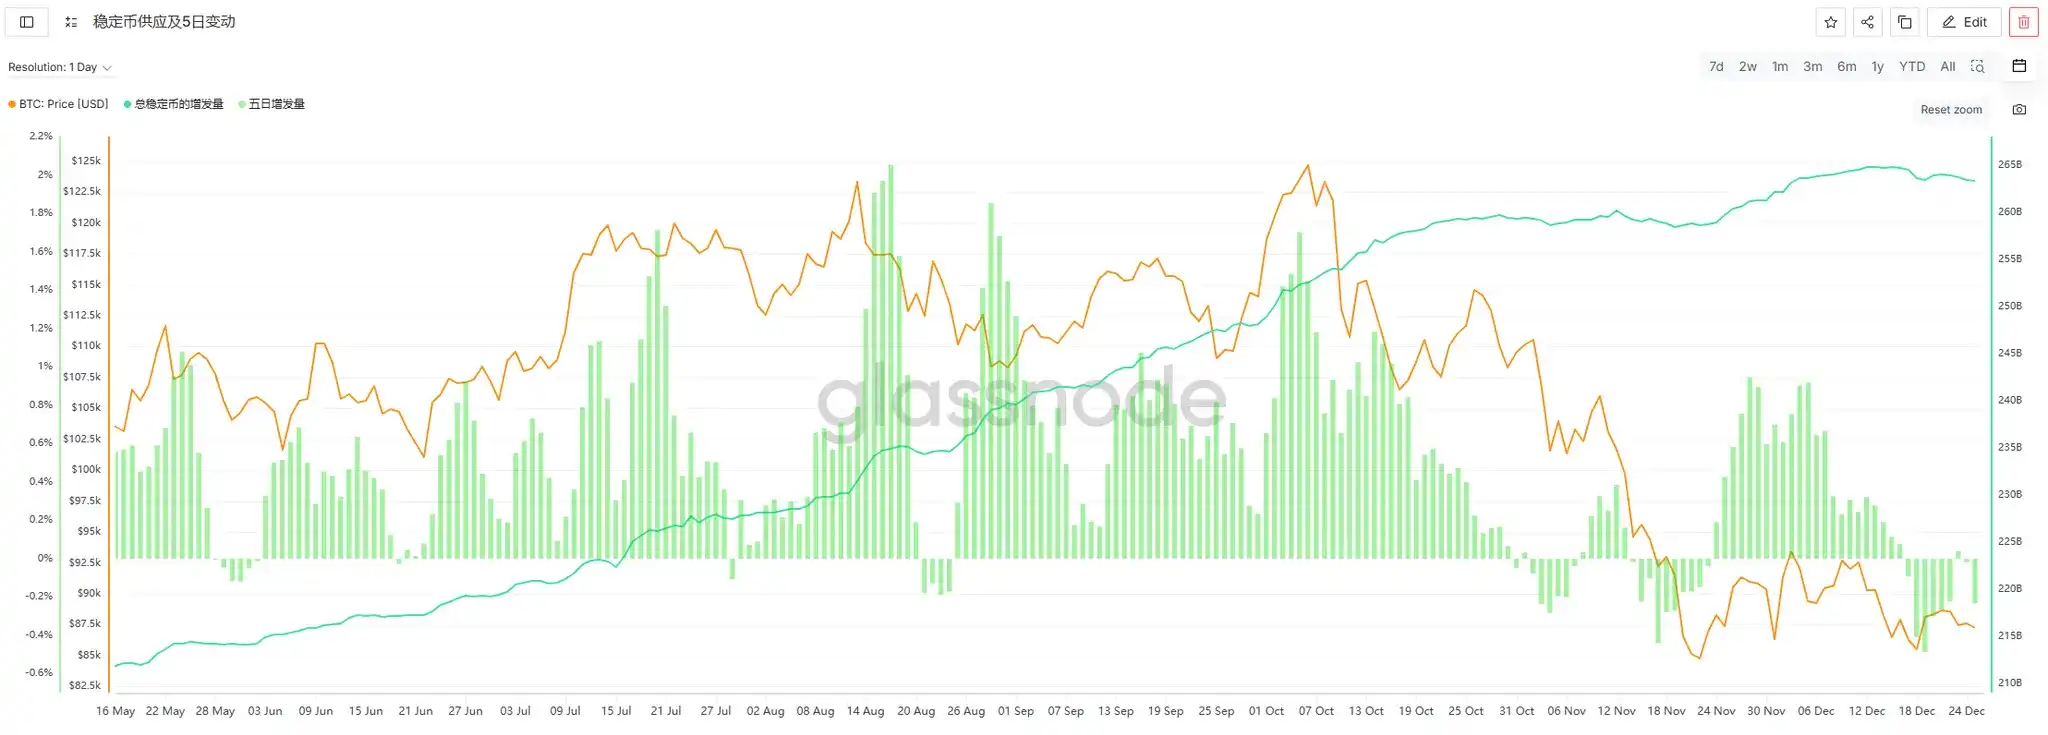
This week (12/20-12/26), the weekly issuance of stablecoins was -$326 million, indicating continued outflow of funds, but the scale of outflow has significantly narrowed. Compared to last week's negative issuance of -$824 million, the average daily negative issuance this week decreased from -$117.7 million to -$46.5 million, representing a 60% increase in overall fund flow. The broader market was mainly volatile this week without sustained declines, which aligns with the trend of reduced stablecoin outflows.
2.2 ETF Fund Flows

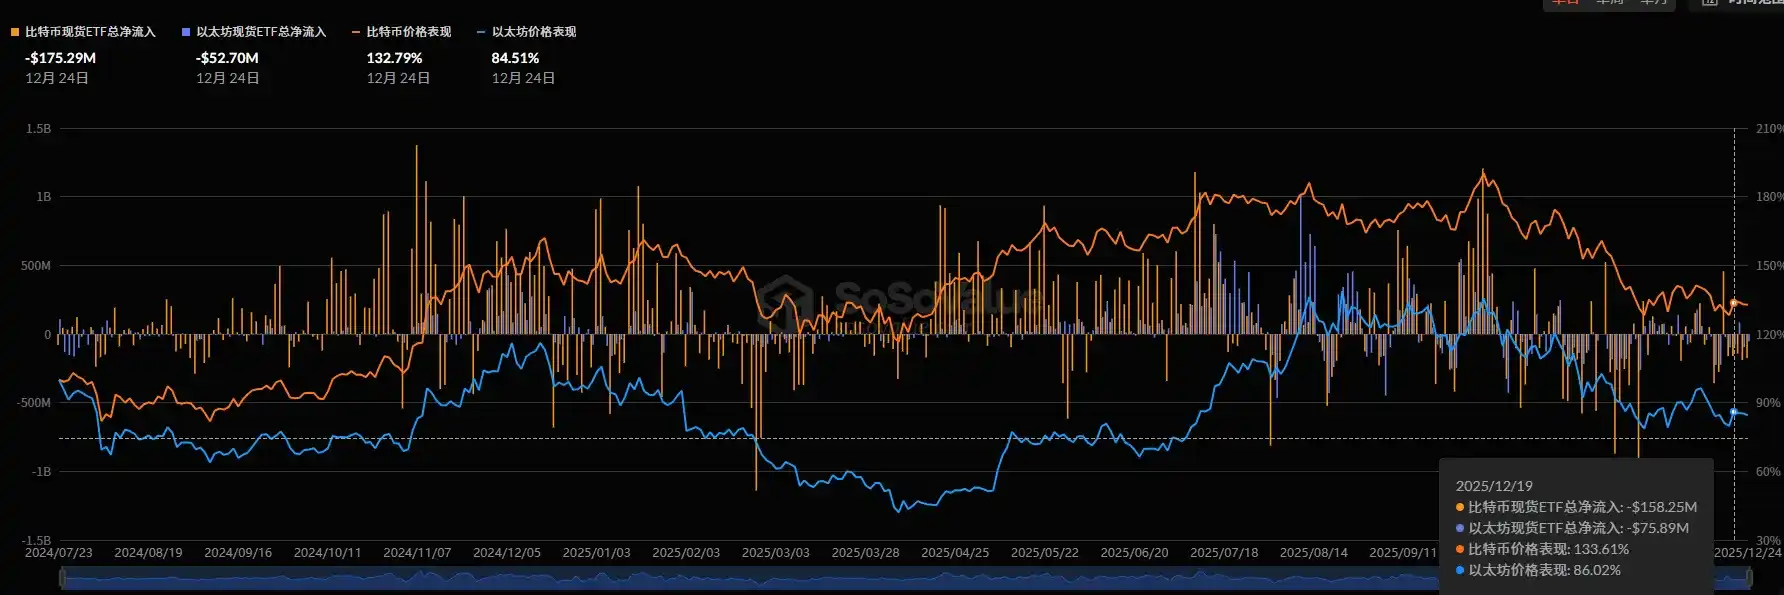
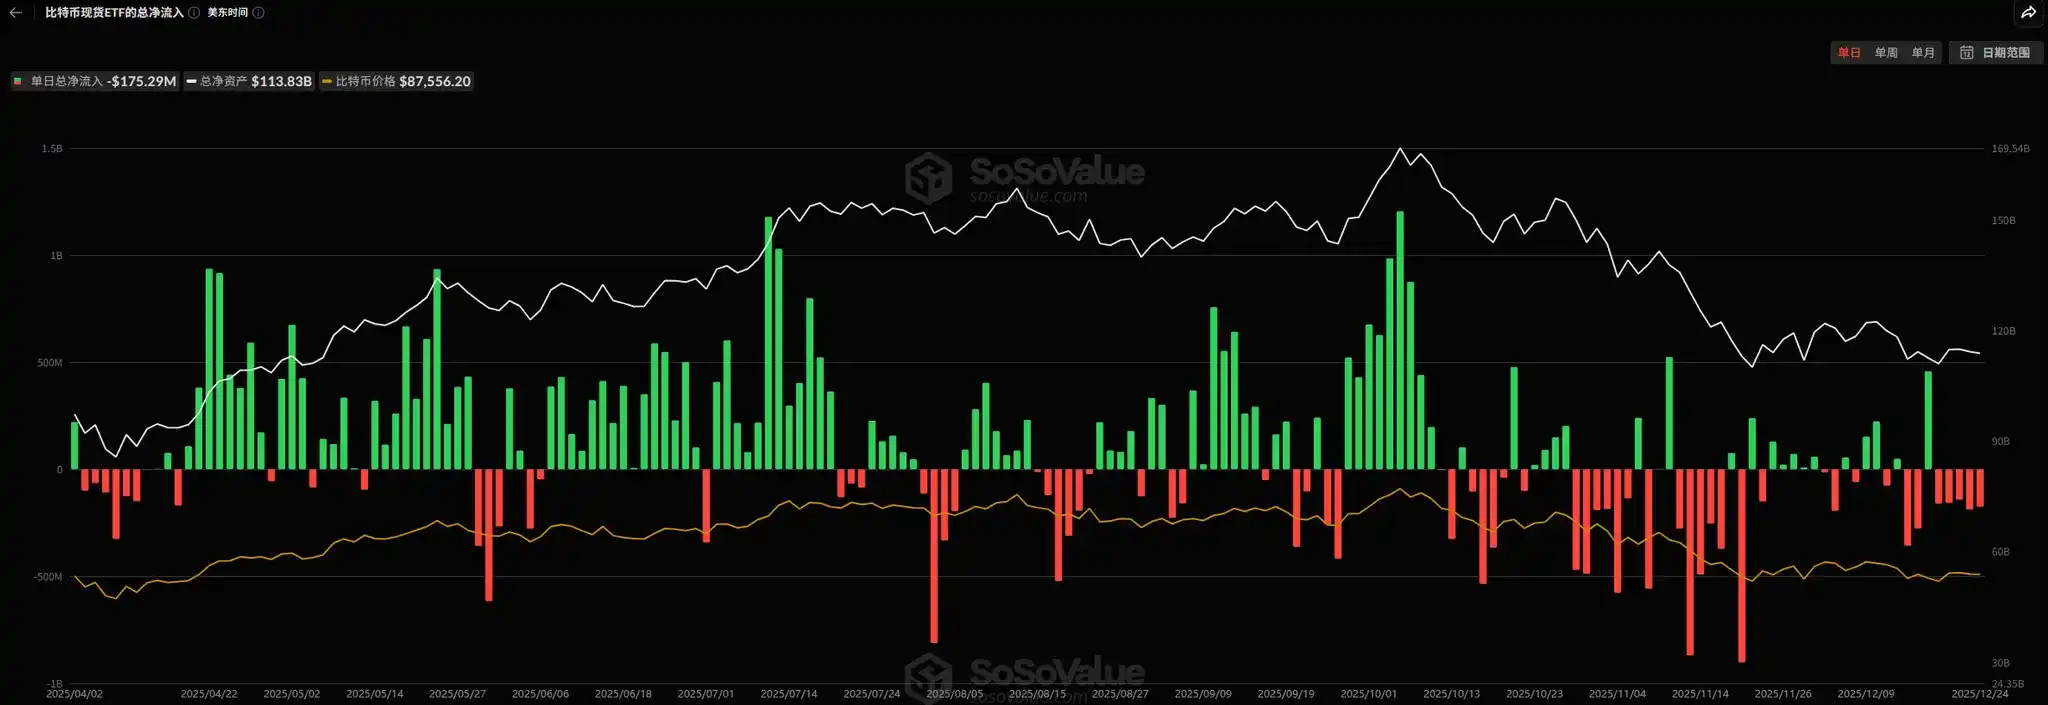
This week, the net outflow of Bitcoin ETFs further expanded, reaching $664.37 million, an increase of $374.72 million compared to last week. Based on daily fund flow data, there is no sign of a regular reduction in ETF net outflows yet. Although BTC prices have rebounded, this can only be characterized as a short-term technical rebound. For the market to achieve a trend reversal, the return of Bitcoin ETFs to net inflows is a core prerequisite.
2.3 Off-Market Discount/Premium

This week, the off-market discount/premium rates for USDT and USDC slightly declined. The current USDT discount/premium is 97.86%, and USDC is 98.36%, both at relatively low levels for the year. This phenomenon reflects continued低迷 market sentiment, insufficient off-market funds for bargain hunting, and some signs of capital outflow.

2.4 Ethereum ETF

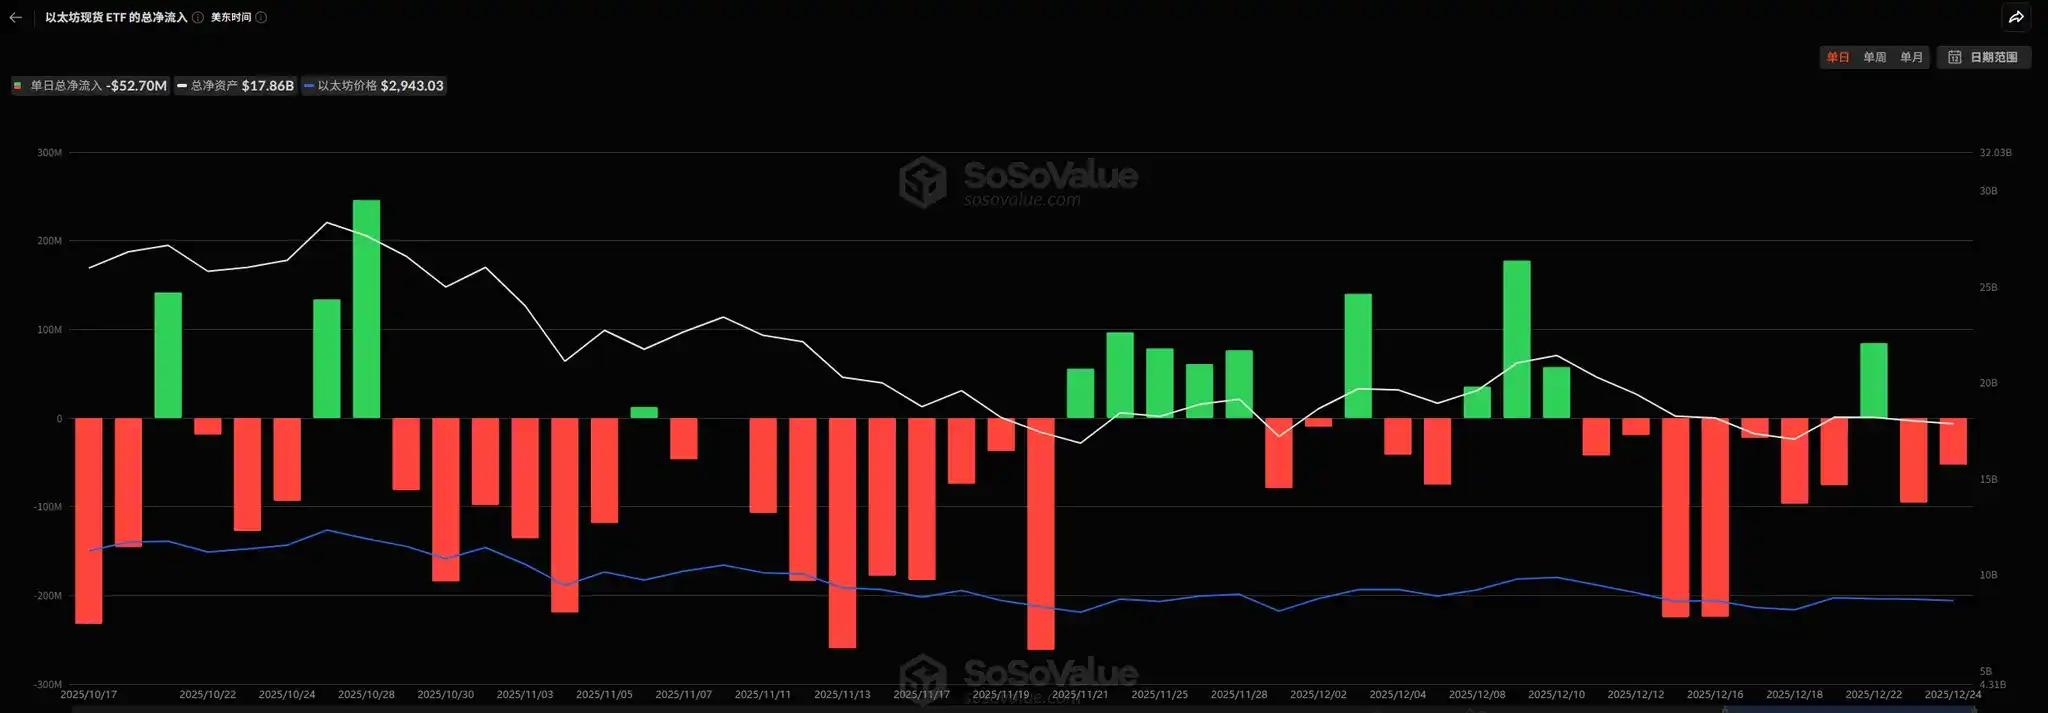
This week, the net outflow of Ethereum ETFs was -$139.53 million, a significant reduction compared to last week's net outflow of $587.5 million. Ethereum prices showed volatile movements this week without sustained declines, echoing the narrowed ETF outflows. If this trend can be maintained, it will provide strong support for Ethereum's rebound.
2.5 Total Crypto Market Capitalization

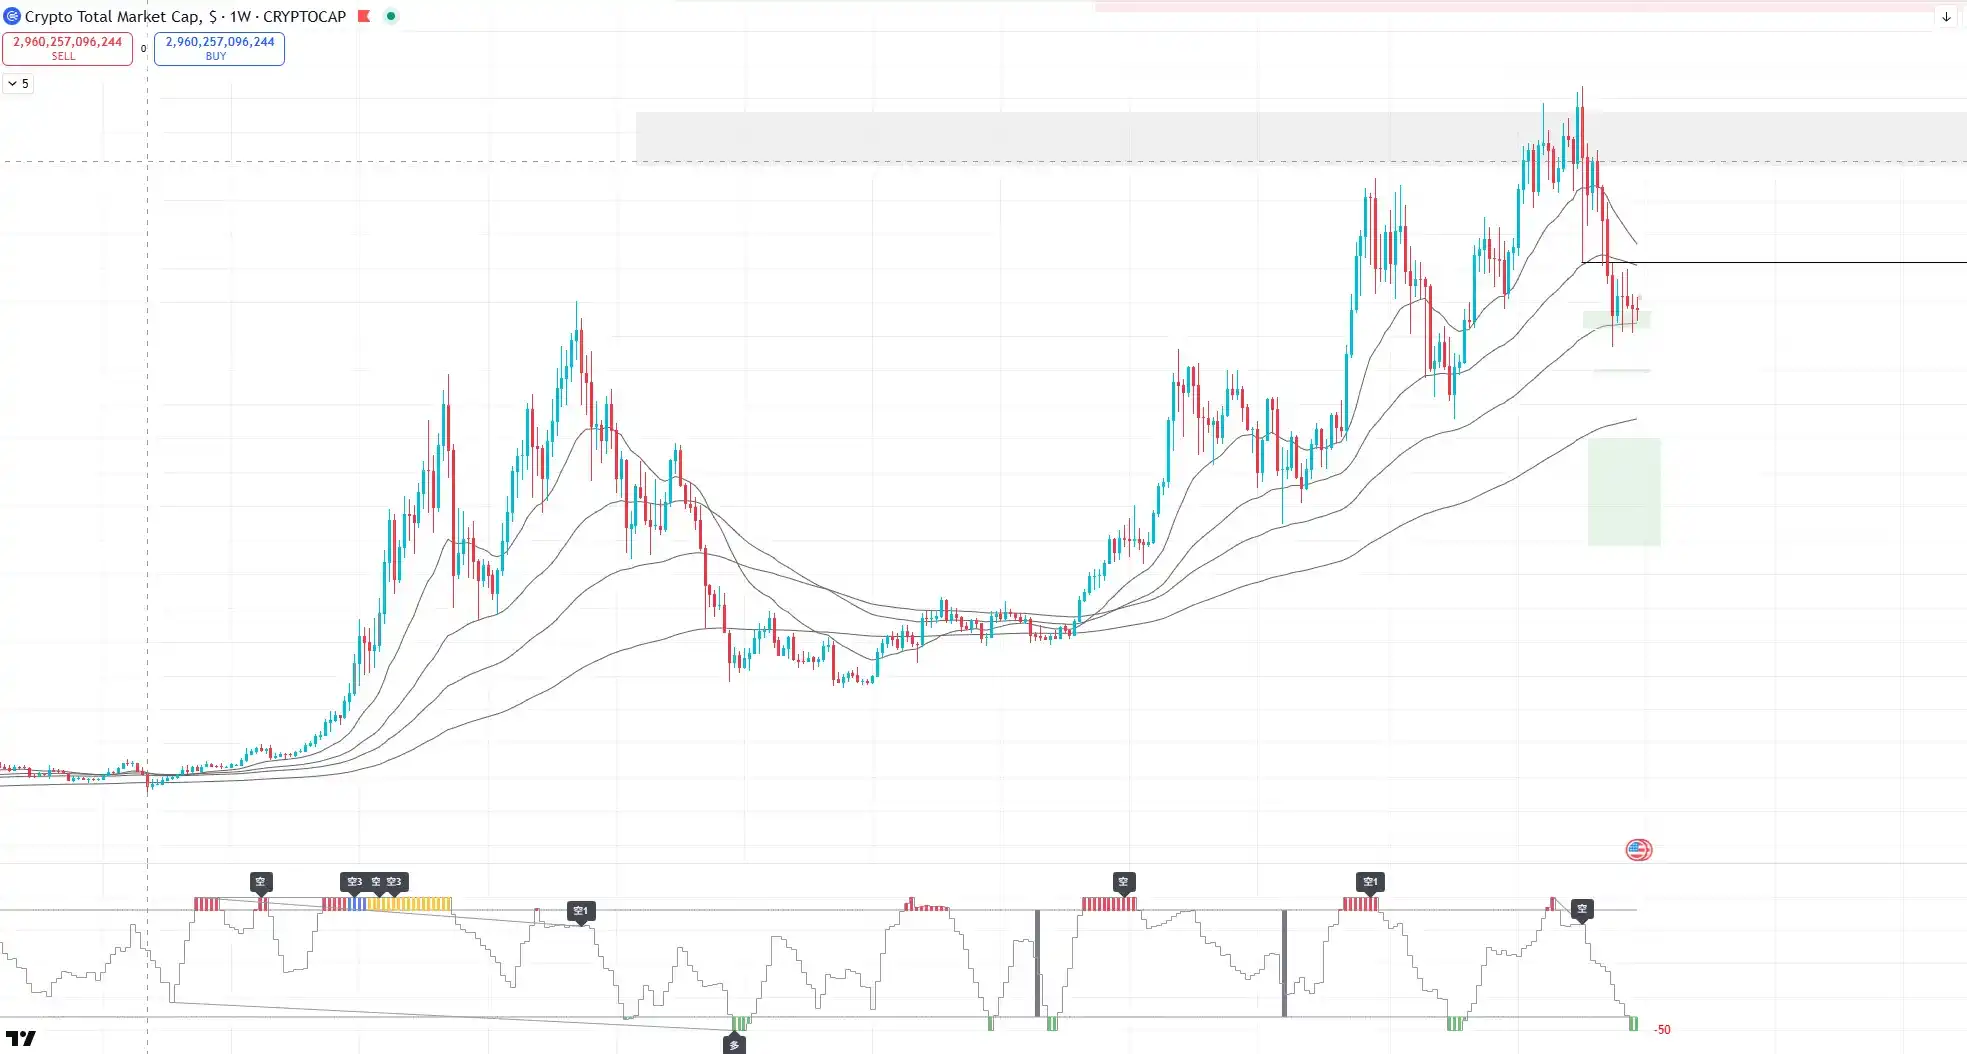
This week, the total crypto market capitalization fell to around $3 trillion, precisely touching the weekly EMA100 moving average. The indicator currently shows a weekly oversold signal. Combined with the historical performance of weekly oversold signals since 2021, the market has the potential for a rebound from a technical perspective.
3. Mid-Term Data Changes Affecting the Market This Week

Holding Address Distribution and URPD

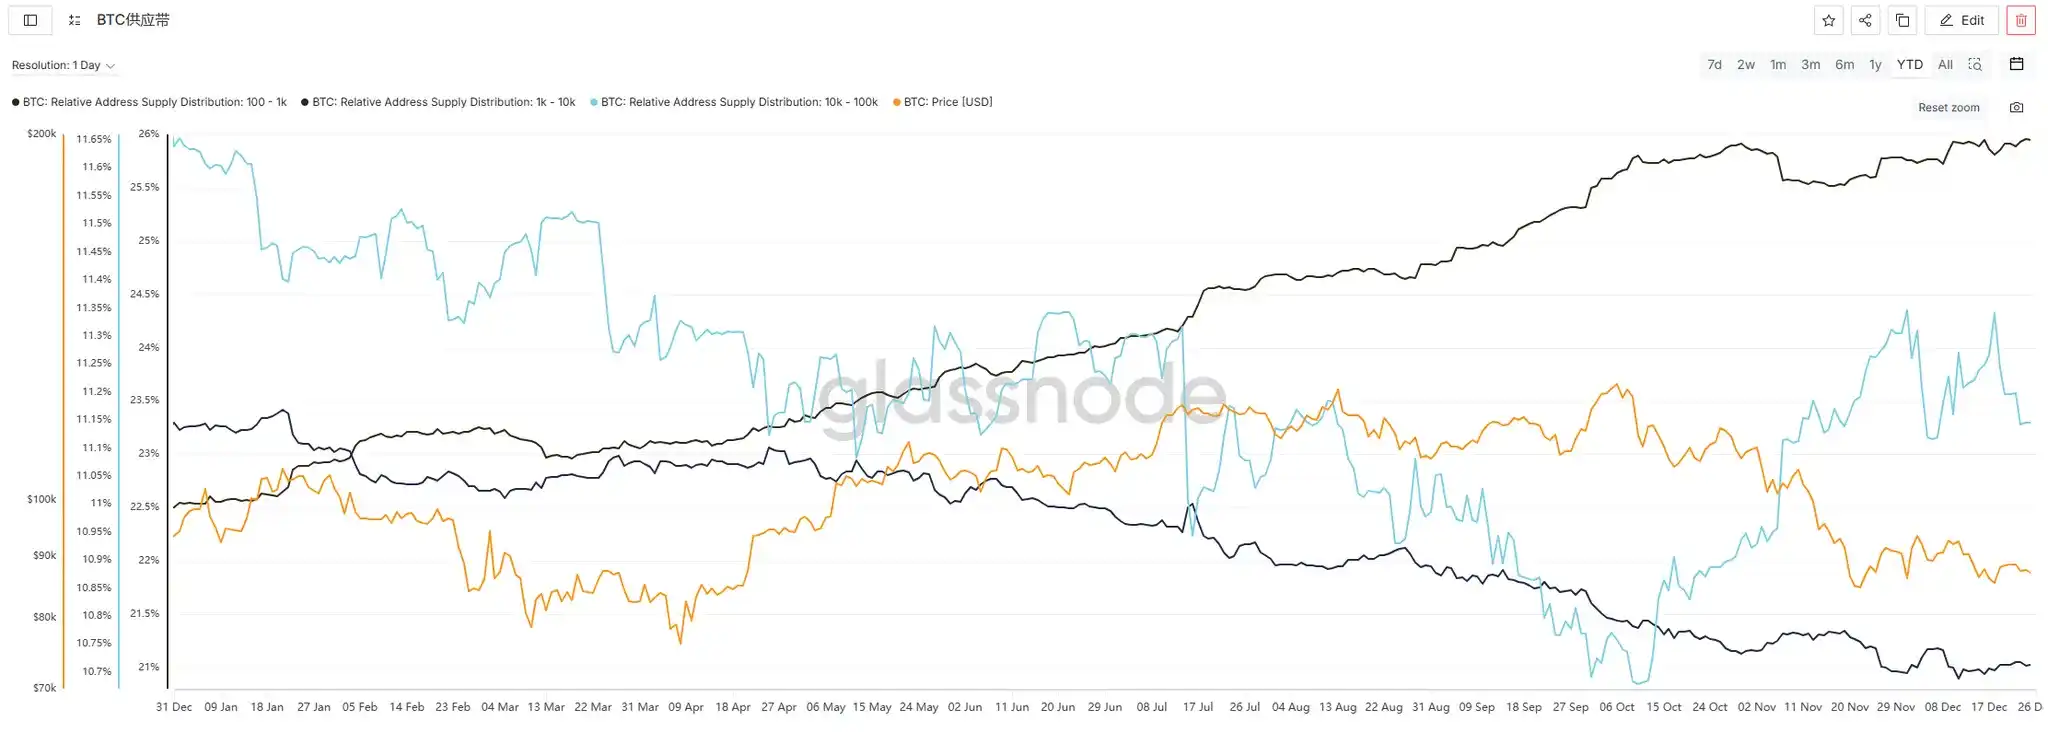
In terms of Bitcoin holding address distribution, the proportion of addresses holding 100-1K BTC increased from 25.813% to 25.951%, showing a slight accumulation trend. The proportion of addresses holding 10K-100K BTC decreased from 11.341% to 11.146%, indicating some reduction. The proportion of addresses holding 1K-10K BTC slightly increased from 20.972% to 21.022%, showing overall minor fluctuations.
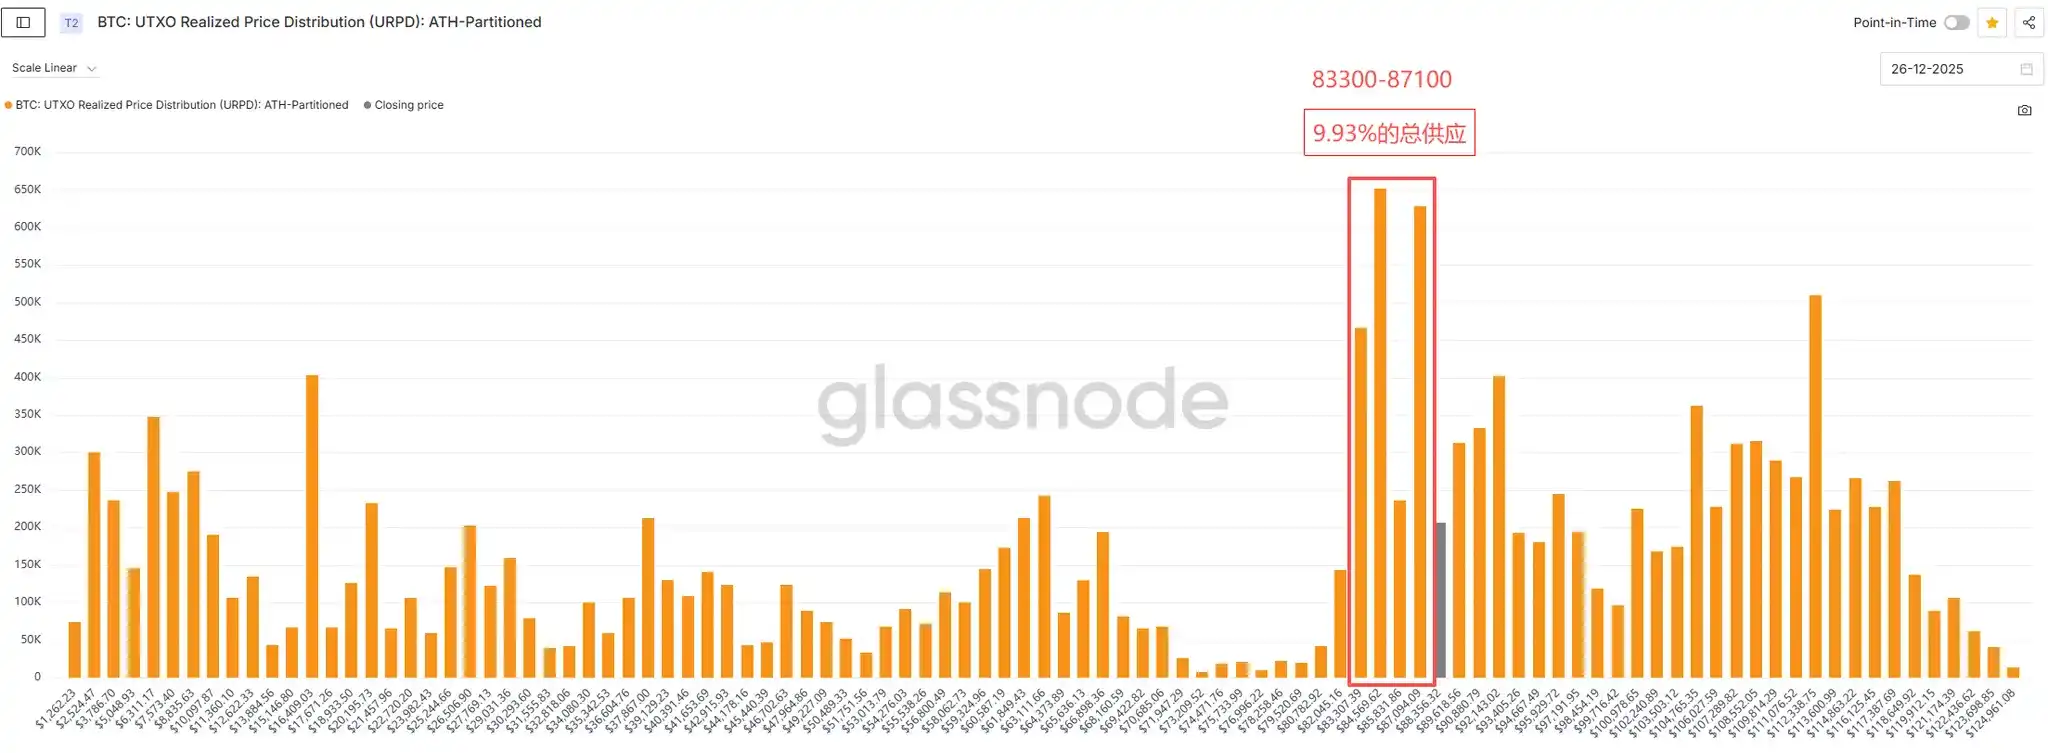
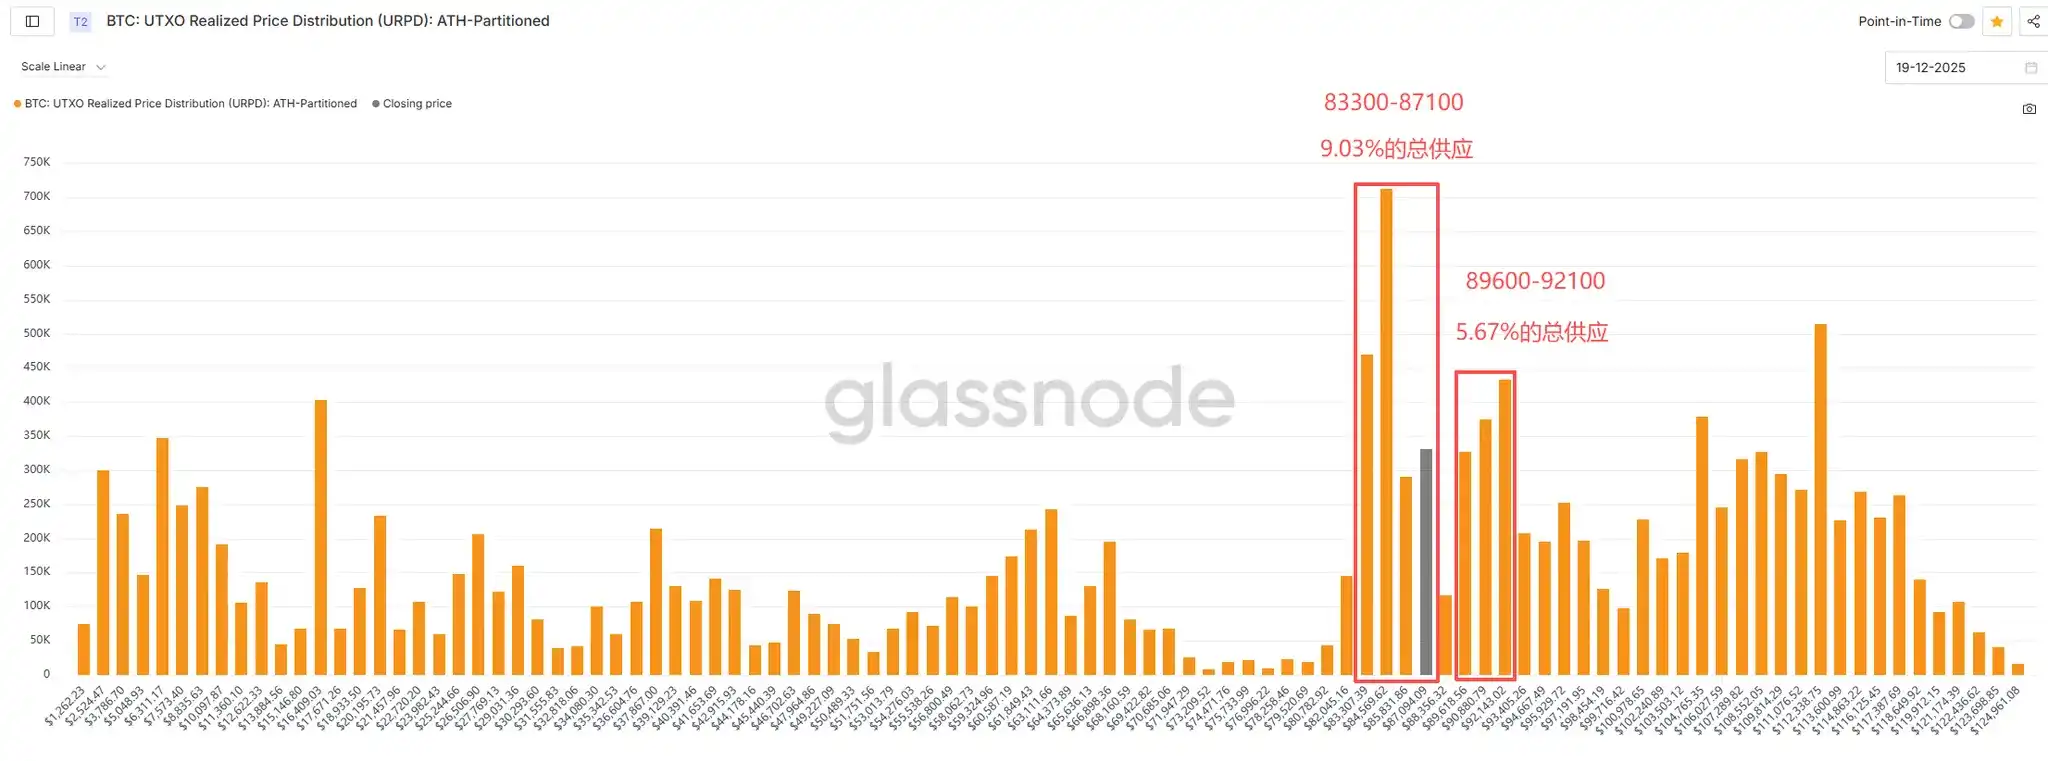
Regarding BTC筹码结构 (chip structure), the accumulation of筹码 in the $83,300-$87,100 price range increased from 9.03% of total supply to 9.93%, a rise of 0.9 percentage points. Specifically, the accumulation near $87,100 reached 3.15% of total supply, showing significant turnover compared to last week and intense battle between bulls and bears. This price level is expected to form strong support going forward.
4. Altcoin Market Analysis

This altcoin market analysis will be conducted from three main sections: Market Overview, Secondary Market Performance, and Primary Market Data, providing a comprehensive view of the current altcoin market dynamics.

4.1 Market Overview

Altcoin Market Capitalization

This Friday, TOTAL3 (total market cap excluding BTC and ETH) reached $822.3 billion, a环比 (week-on-week) increase of 1.95%. BTC traded in a narrow range around $88,000 this week, with low volatility. Despite continued rebounds in US stocks and A-shares, BTC did not follow suit, while commodity markets performed strongly. From a fund flow perspective, BTC still ranks lower in traditional financial allocation systems. In the absence of significant incremental funds, it is likely to maintain range-bound fluctuations.

On-Chain TVL Overview

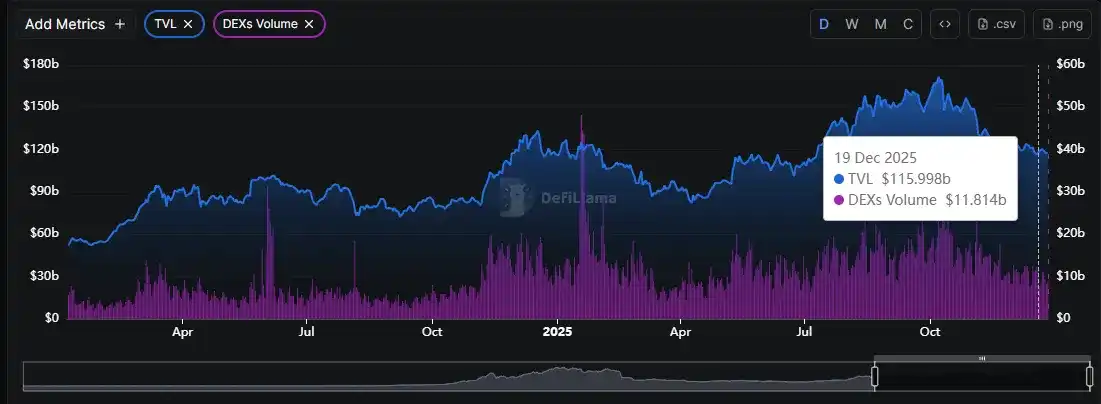
The total on-chain TVL reached $117.5 billion, a环比 increase of 1.29%, showing an overall volatile trend. The amount of ETH staked remained stable, with a trend of fluctuating upward, reflecting relatively solid confidence among long-term holders.
Stablecoin Market Cap and Exchange Reserves

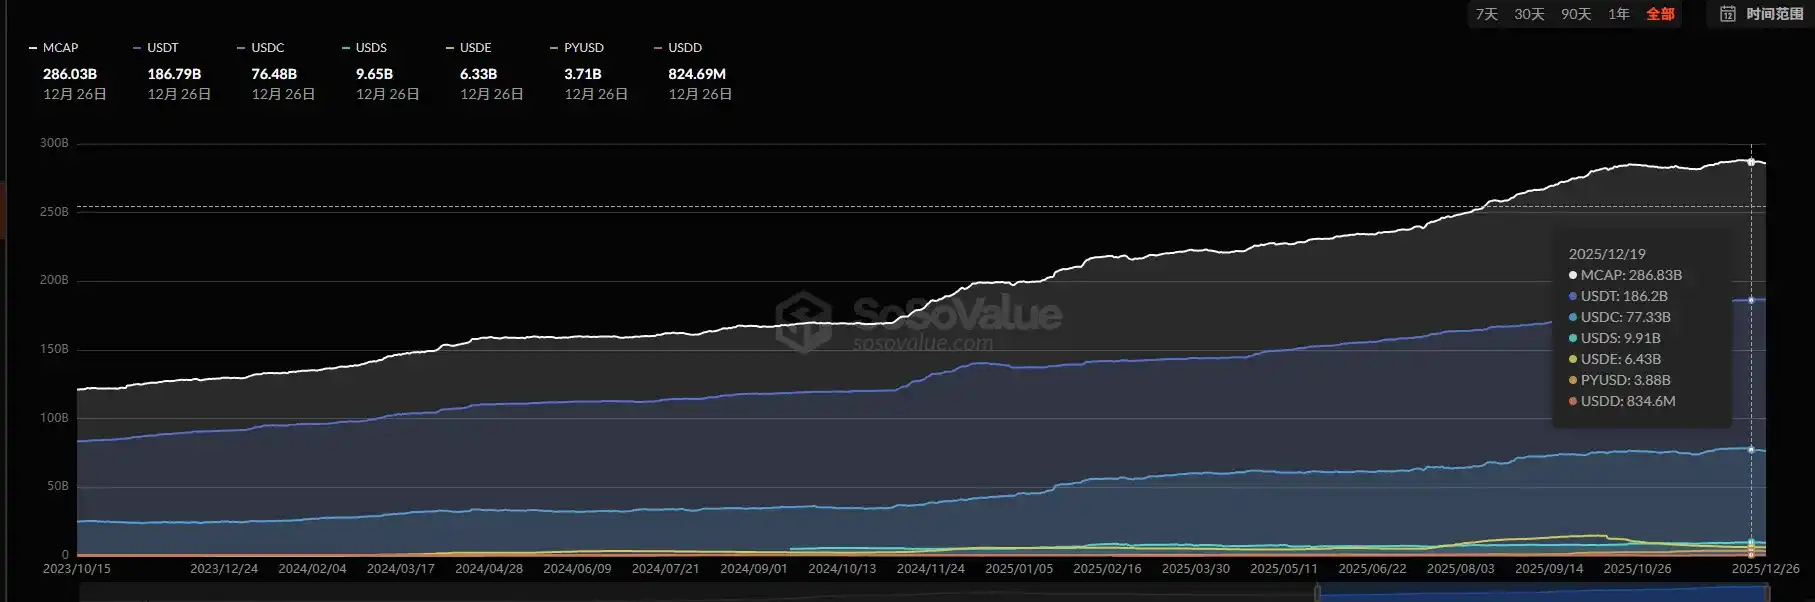
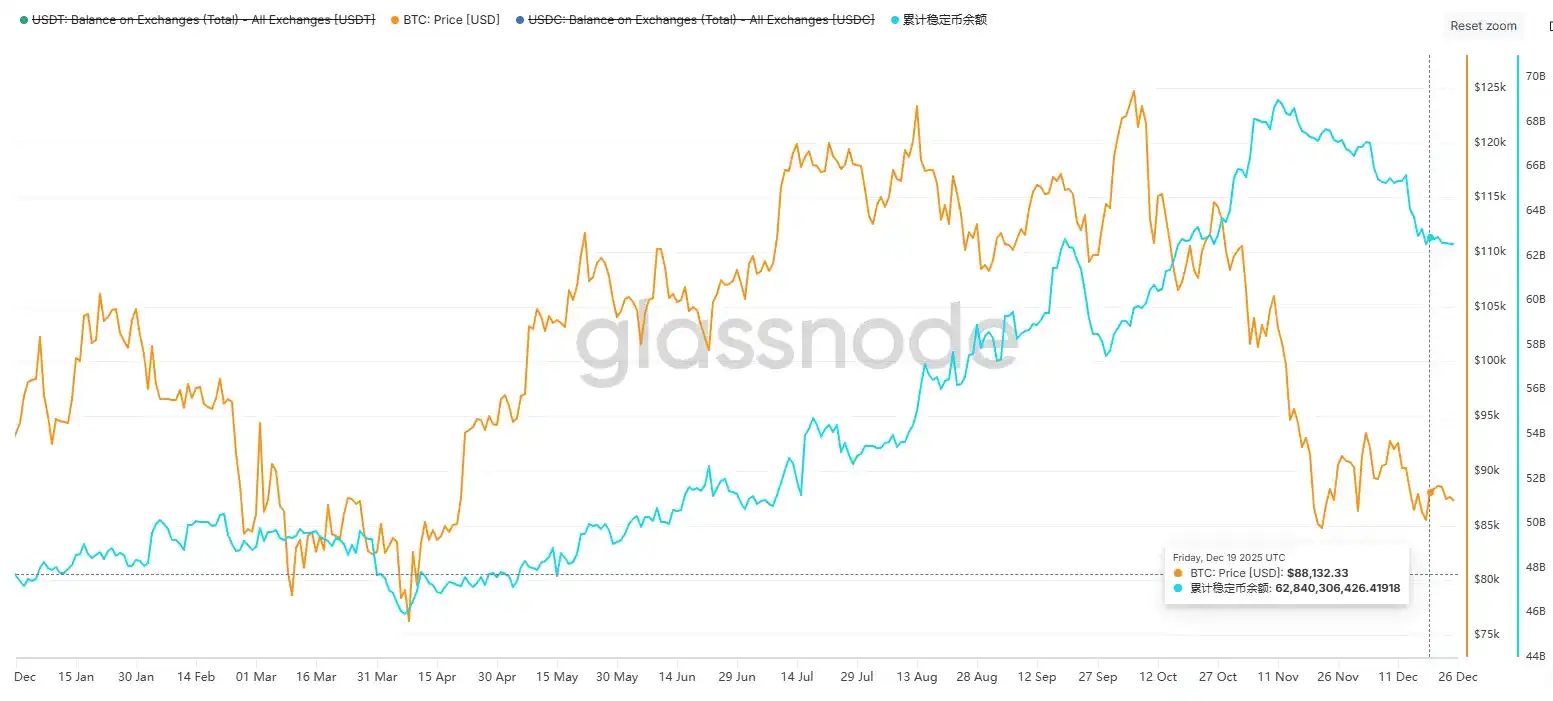
The total stablecoin market cap was $286 billion, a环比 decrease of 0.28%, with fiat-backed stablecoins experiencing a net outflow of $800 million. The current crypto market performance is disconnected from traditional financial markets, showing relative weakness. Market sentiment has not明显恢复 (significantly recovered), with a strong wait-and-see atmosphere. Exchange stablecoin balances slightly decreased this week, and there was no stablecoin inflow during BTC's rebound, indicating the market has not fully stabilized.
Altcoin Index and Market Sentiment

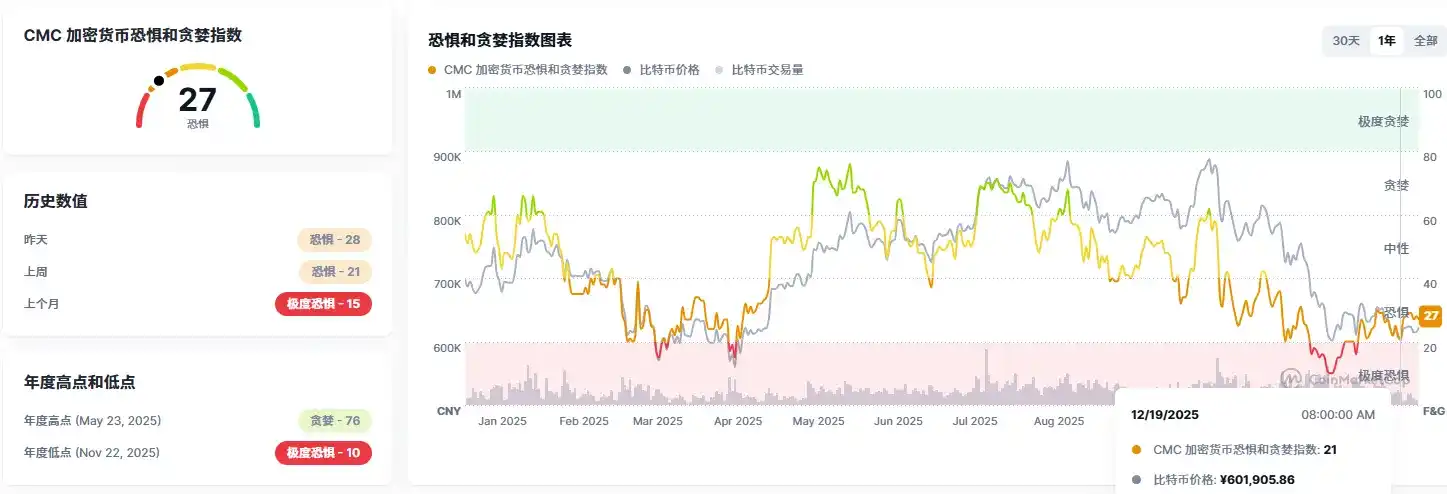
This Friday, the altcoin index was 16. Major altcoins maintained low-level fluctuations, with low market trading activity. The market sentiment index rose to 27, an improvement from last week.个别 (Individual) altcoins performed actively, but overall热度 (heat) was insufficient.

Altcoin Overview

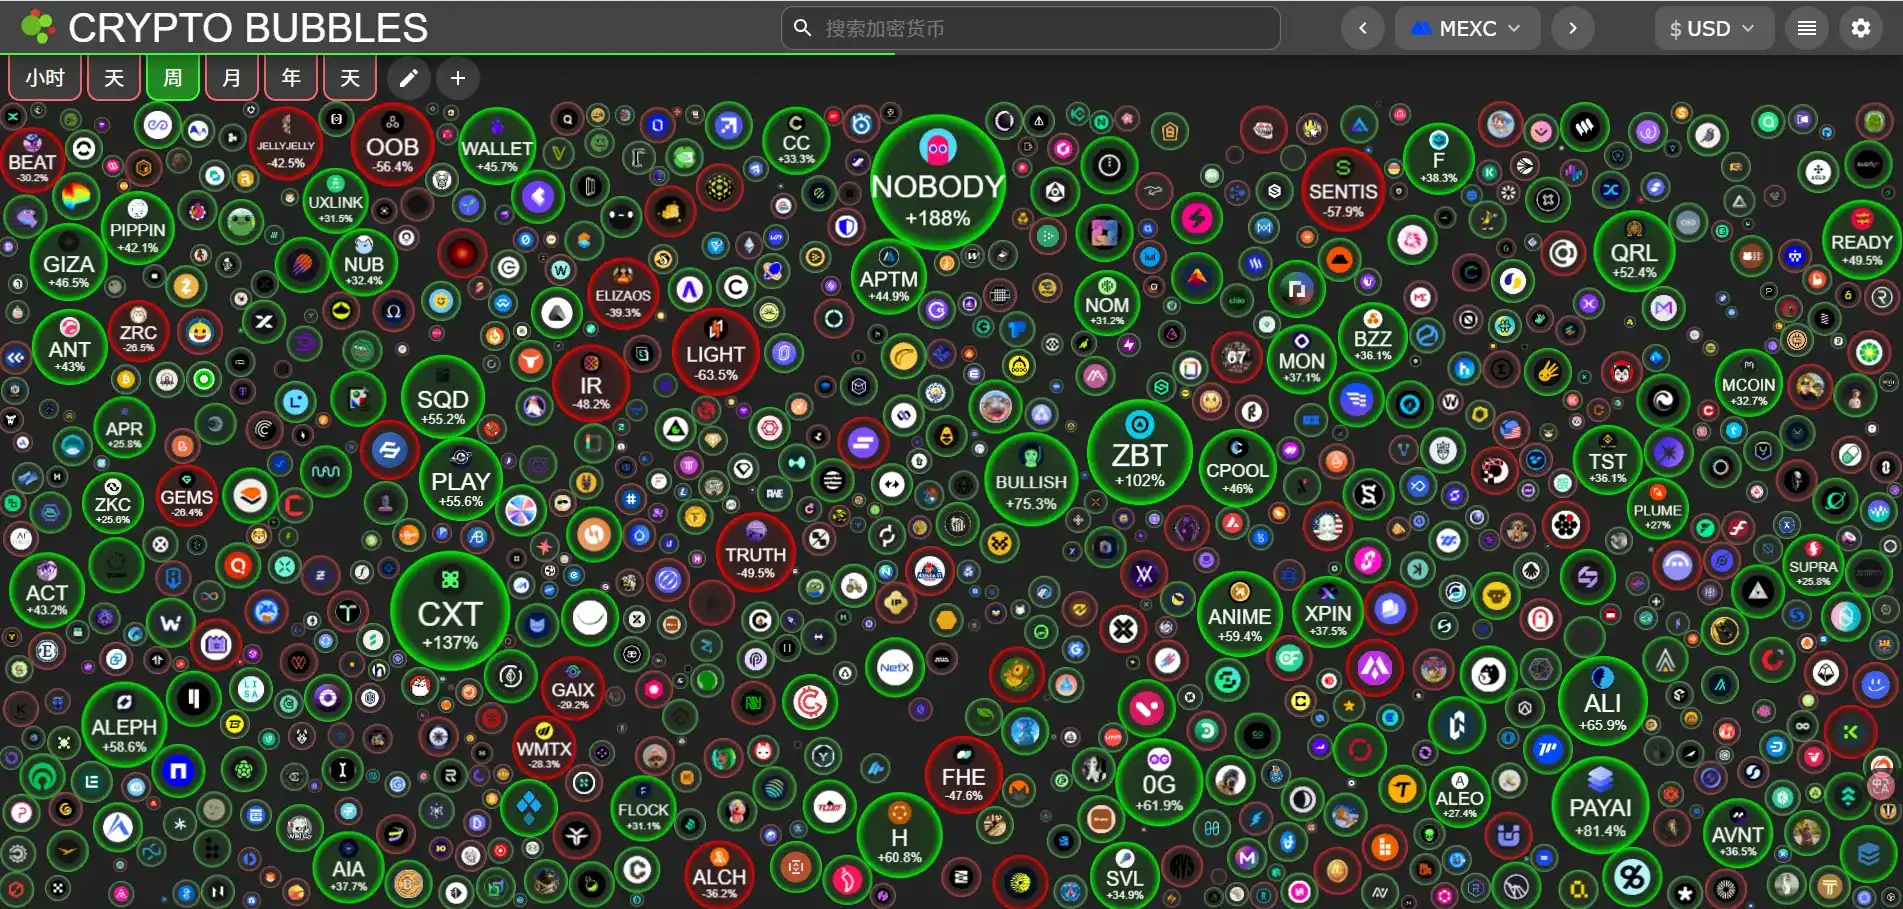
This week, the altcoin market showed an overall volatile pattern, with some tokens逆势走高 (rising against the trend). Benefiting from marginally improved stock market sentiment, the short-term sentiment and downside space of the crypto market received some support. Better-performing tokens were mainly concentrated in small-cap MEME coins and high-profile hot tokens, but the sustainability of the rally was weak, making it difficult to form sector联动效应 (linkage effects).

Top-Selling Indicator and Altcoin Heat

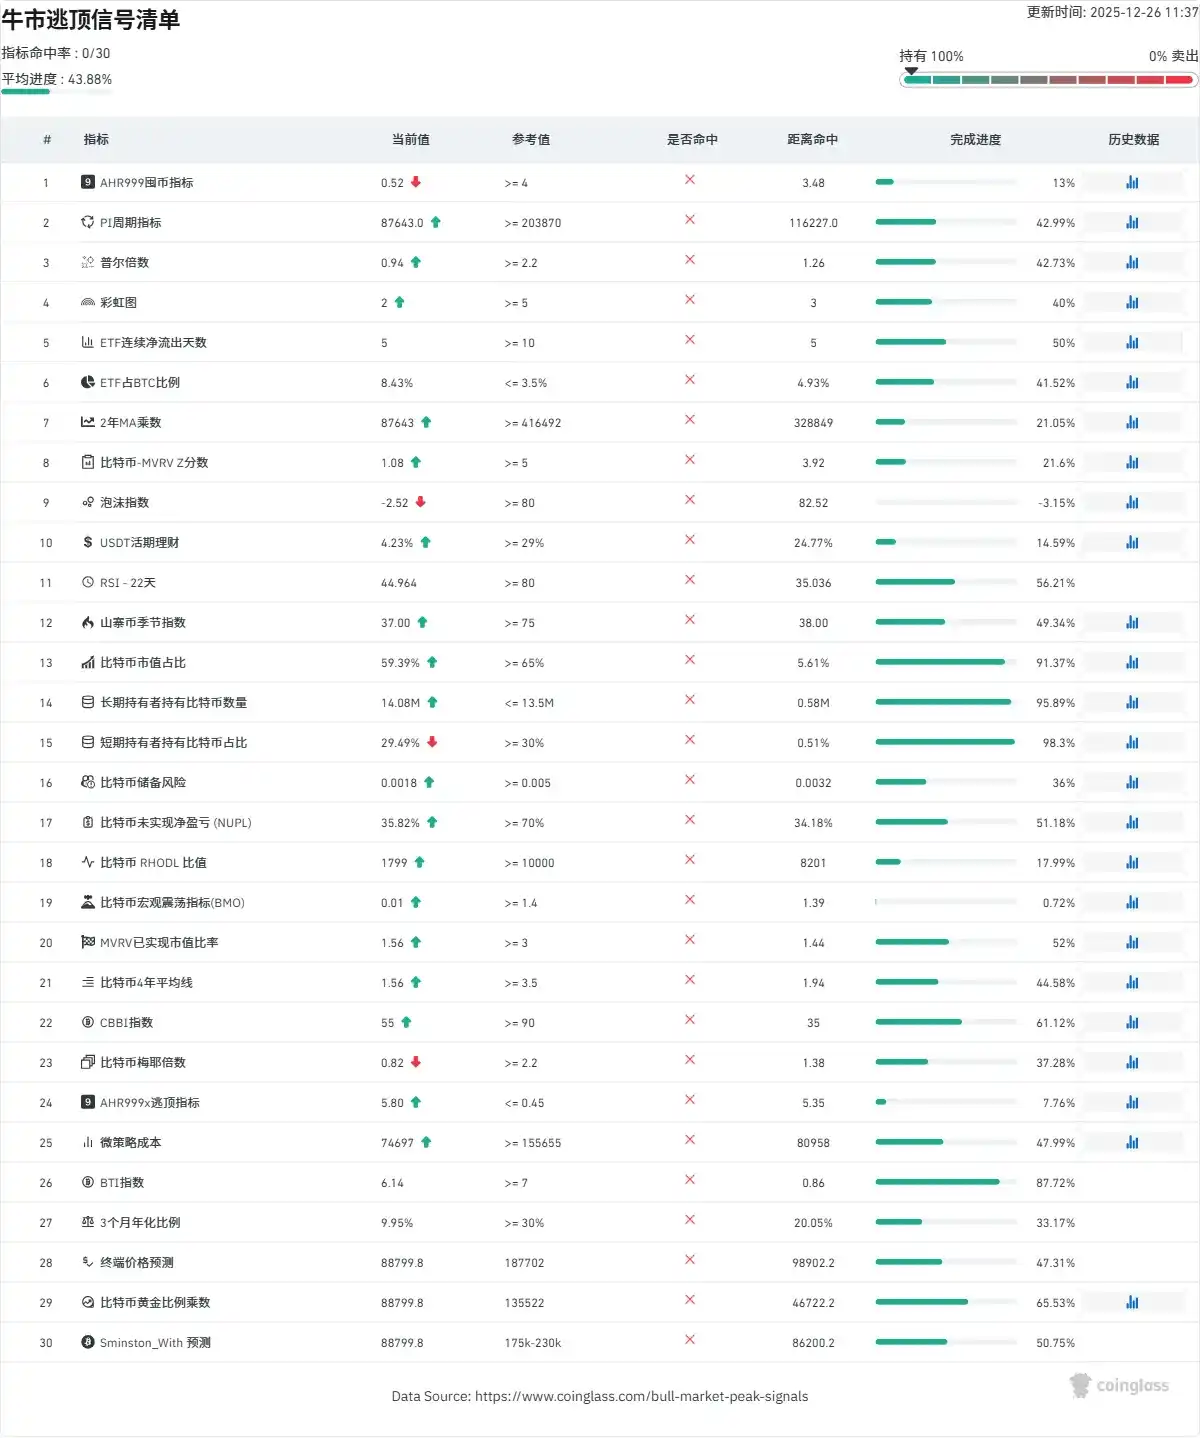
This week, the top-selling indicator did not trigger an alarm, but the proportion of short-term BTC holders increased significantly, approaching the warning threshold. Caution is needed against short-term correction risks. From the perspective of funding rates, most altcoins still had negative rates this week, but overall showed a marginal improvement trend, indicating a slight回暖 (recovery) in market speculation sentiment.

4.2 Secondary Market Analysis

4.2.1 Altcoin Strength Analysis

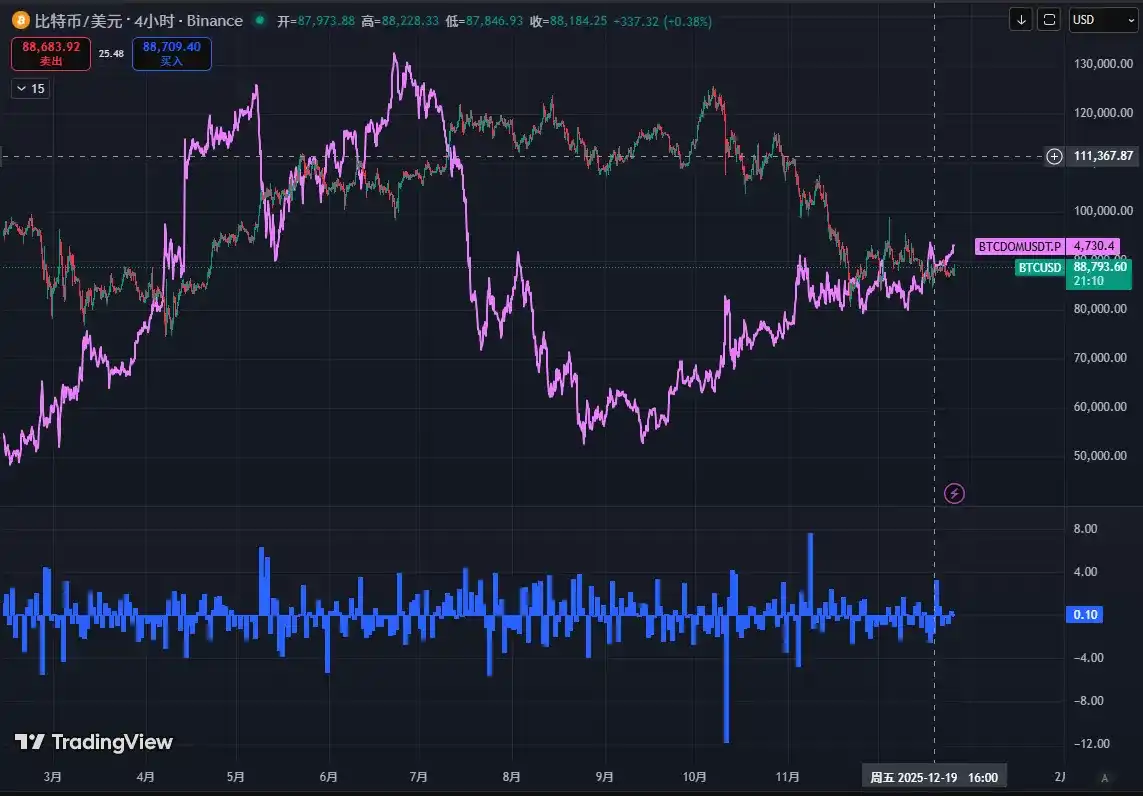
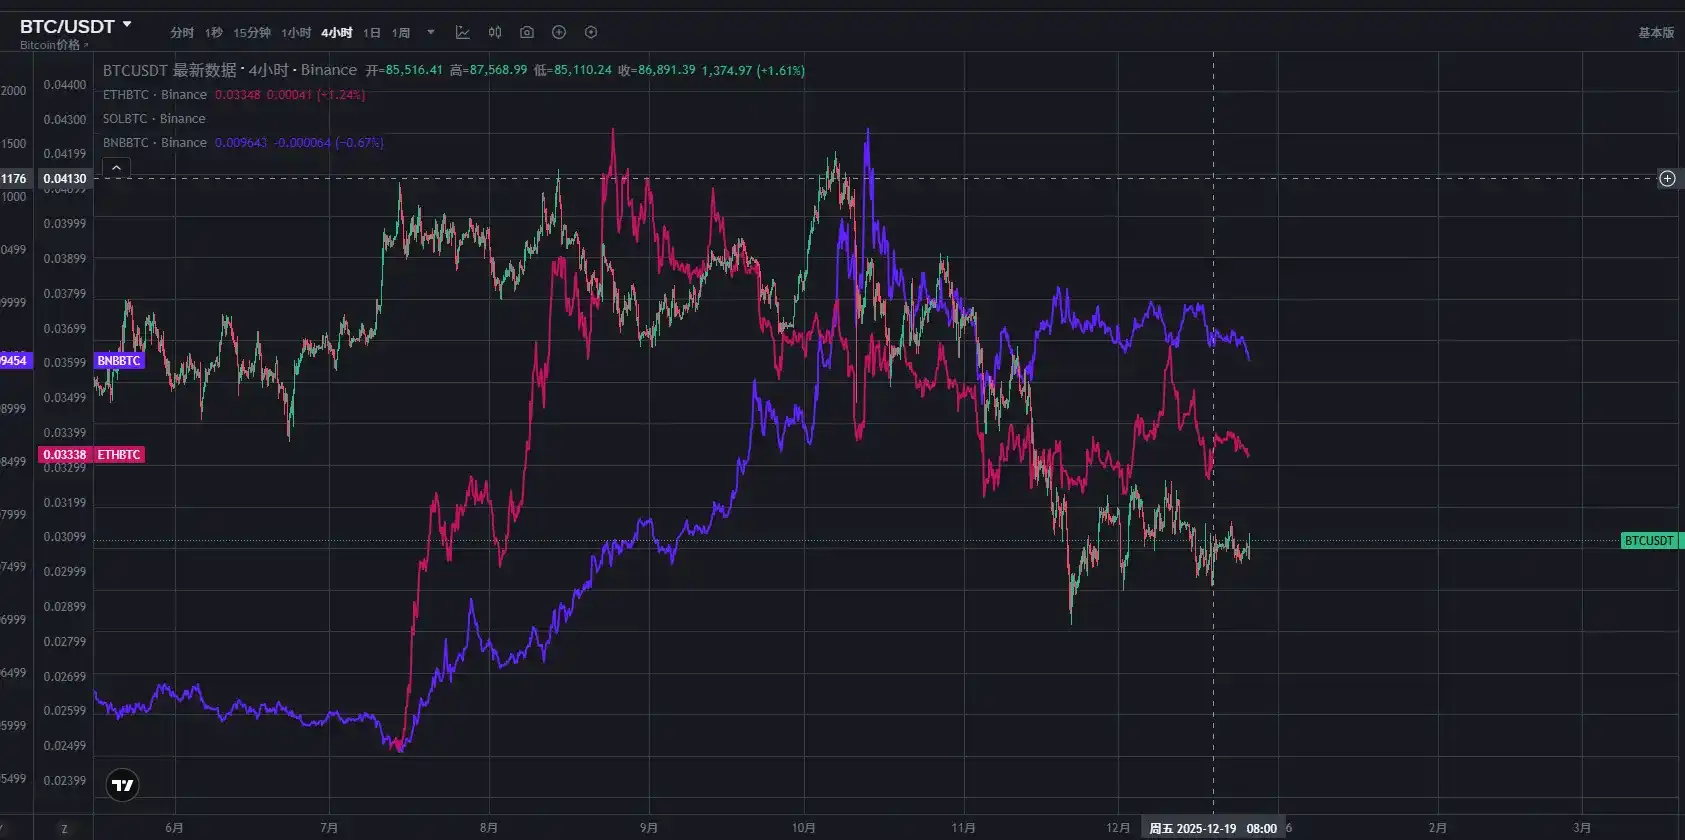
BTC's market share this week was 65.76%, a环比 increase of 0.1%, maintaining recent high-level fluctuations. Mainstream exchange rate pairs like SOL/BTC, ETH/BTC, and BNB/BTC fluctuated lower this week, overall still in a volatile or volatile downward channel. The weak pattern of altcoins relative to BTC has not significantly changed.

4.2.2 Market Flow

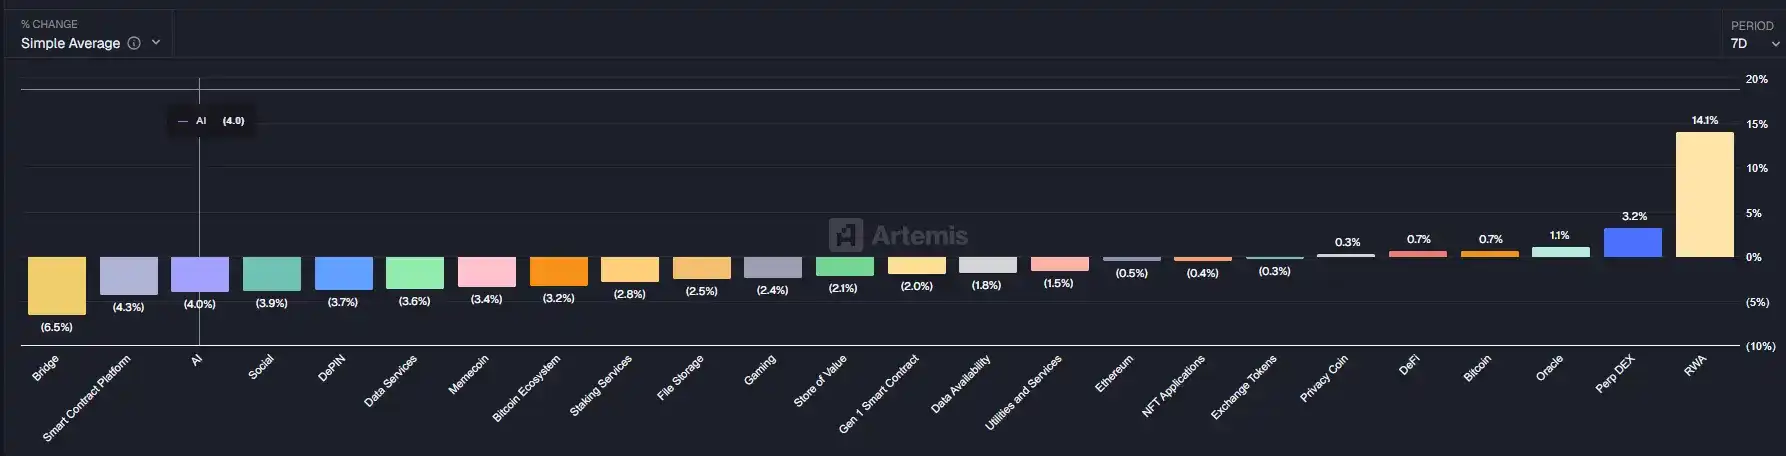
In terms of sector performance, gains and losses were differentiated this week. The RWA and PerpDEX sectors led the gains, becoming the market focus. These two sectors align with long-term market development trends and continue to attract fund attention. Regarding institutional funds, BTC and ETH ETFs continued outflows this week, with no signs of stabilization yet. Data company Bitmine did not conduct relevant purchase operations this week, indicating low institutional participation.

4.3 Primary Market Data Analysis

4.3.1 Status of the Four Major Public Chains

This week, the TVL of the four major public chains showed a slight upward trend, but the increase was lower than the price increase. Among them, ETH TVL rose from $67.2 billion to $68.1 billion, a环比 increase of 1.48%. SOL and BSC TVL remained stable at $8.3 billion and $6.4 billion, respectively. BASE TVL increased from $4.2 billion to $4.4 billion, a环比 increase of 4.76%, performing relatively突出 (outstandingly).

4.3.2 On-Chain Data Analysis

On-Chain Asset Flows

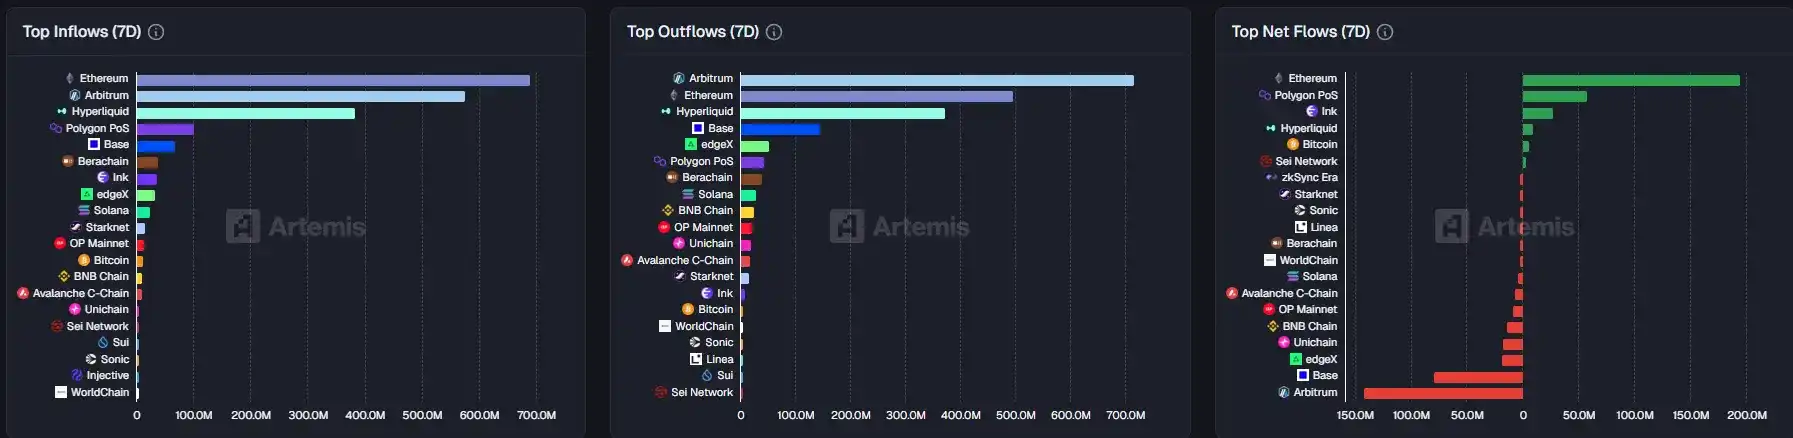
This week, USDT issuance led, while USDC experienced significant outflows. CEX funds continued to withdraw substantially, indicating that short-term market liquidity remains tight. In terms of DeFi bridge asset flows, the ETH chain had the largest net inflow, while the ARB chain had the most outflows. Overall fund flow规模 (scale) was small, and market volatility narrowed rapidly.

On-Chain User Activity and Speculative Sentiment

This week, on-chain user activity was generally average but showed a marginal improvement trend. DEX protocol revenue, active user numbers, and trading volume increased slightly环比, but overall热度 was not high, with limited gains. Market speculative sentiment is still in a low-level repair stage.

On-Chain Boom-Bust Index

Combining the TVL changes of the four major public chains and on-chain data performance, a weighted summary forms the On-Chain Boom-Bust Index (out of 100). The specific range definitions are as follows:

Extreme Prosperity: 80 points and above

Rising Line: 60-79 points

Recession Line: 50-59 points

Bear Market: 30-49 points

Data for this report was compiled and edited by WolfDAO. Please contact us if you have any questions for updates;

Author: WolfDAO( X : @10xWolfdao )

Трендові криптовалюти

ctr
CitreaCTR
wstusdt
wrapped stUSDTWSTUSDT
apr
aPrioriAPR
ctx
Cryptex FinanceCTX
audio
AudiusAUDIO
mantra
MantraMANTRA
waxl
AxelarWAXL
bill
Billions NetworkBILL
pyth
PYTH (Pyth)PYTH
rune
THORChainRUNE
velodrome
Velodrome FinanceVELODROME
brev
BrevisBREV
zrx
ZRX(0X)ZRX
cake
PancakeSwapCAKE
jst
JUSTJST

Пов'язані питання

QWhat was the key technical support level for BTC mentioned in the article, and how did it perform?

AThe key technical support level for BTC was $85,000. It was tested and held effectively, as BTC touched a low of $84,500 before initiating a rebound, confirming the strength of this support.

QAccording to the stablecoin data, what was the trend in net issuance, and what does it indicate about market funds?

AThe net issuance of stablecoins was negative at -$326 million for the week, indicating a continued outflow of funds. However, the rate of outflow significantly narrowed compared to the previous week, falling from a daily average of -$117.7 million to -$46.5 million, suggesting a 60% improvement in fund flow and correlating with a stabilizing market that did not see sustained declines.

QWhat is identified as a core prerequisite for a trend reversal in the Bitcoin market?

AA return to net inflows for Bitcoin ETFs is identified as the core prerequisite for the market to achieve a trend reversal. The article states that despite a technical price rebound, the continued and expanding net outflows from ETFs prevent a sustainable upward trend.

QWhat does the low OTC premium rate for USDT and USDC suggest about market sentiment?

AThe low OTC premium rates for USDT (97.86%) and USDC (98.36%), which are at yearly lows, suggest that market sentiment remains pessimistic. It indicates a lack of strong buying interest from off-exchange funds and the presence of capital outflows.

QWhat was the overall trend for the altcoin market (TOTAL3), and which types of tokens performed relatively well?

AThe total market cap of altcoins (TOTAL3) increased by 1.95% to $822.3 billion, showing a震荡 (volatile/oscillating) trend. Performance was better among small-cap meme coins and high-profile trending tokens, but the rallies were short-lived and failed to create sustained sector-wide momentum.

Пов'язані матеріали

Gate Research Institute: The 'Wall Street-ization' Wave of Crypto Financial Products – Competition or Integration?

The article titled "Gate Research Institute: Are Crypto Financial Products Sparking a 'Wall Street' Wave—Competition or Convergence?" explores the evolving relationship between the crypto ecosystem and traditional finance (TradFi). The piece begins by reflecting on Bitcoin's original 2009 vision of decentralization, disintermediation, and moving away from banks. It then contrasts this with the 2024 landscape, where key crypto assets like Bitcoin are increasingly held through Wall Street products like ETFs issued by giants like BlackRock. The article questions whether this signifies that TradFi is systematically taking over the rights to issue, price, custody, and distribute crypto financial assets. The core argument is that this is not a zero-sum takeover but rather a bidirectional convergence where each side addresses the other's weaknesses. Crypto offers 24/7 global markets, programmable settlement, and open access but lacks compliant channels, institutional-grade custody, deep fiat liquidity, and mainstream distribution. TradFi possesses these but is constrained by legacy systems, limited operating hours, and slow settlement. Two primary convergence paths are highlighted: * **Path A (CEX to TradFi):** Exemplified by Gate, which has progressed from offering tokenized stocks and CFDs to providing direct, real stock trading (US, Hong Kong, South Korea) within its platform, using USDT. * **Path B (TradFi to Crypto):** Exemplified by Robinhood, which has integrated crypto trading, acquired exchanges like Bitstamp, and is moving traditional assets like stocks onto the blockchain via tokenization and its own Layer 2. Both paths are ultimately competing to become the next-generation, unified financial account—a "super account" where users can seamlessly trade cryptocurrencies, stocks, ETFs, RWA (Real World Assets), and tokenized treasury products in one interface. The growth of RWA and tokenized treasuries (e.g., BlackRock's BUIDL) is presented as the asset-layer fusion, providing stable, yield-bearing assets on-chain and acting as a bridge between the two worlds. In conclusion, the "Wall Street-ization" of crypto is framed as a mutual transformation. Decentralized ideals persist in the protocol layer, while at the application layer, a more efficient, global, and accessible unified capital market is emerging from this convergence. The future competition lies not between crypto exchanges and stockbrokers, but between platforms vying to offer the most comprehensive asset coverage, liquidity, and user experience within a single account.

marsbit3 хв тому

Gate Research Institute: The 'Wall Street-ization' Wave of Crypto Financial Products – Competition or Integration?

marsbit3 хв тому

Claude's Major New Feature: Screen Recording + Voice, Distilling Your Skills into AI Tasks in One Click

Claude has introduced a major new feature called "Record a Skill," available for Pro, Max, and Team users. This function, found in the Claude desktop app's CoWork menu, allows users to create reusable AI skills simply by recording their screen and providing voice narration while performing a task. Claude then automatically analyzes the recording and generates a functional Skill. A hands-on test confirmed the feature works seamlessly. Users start recording via the Skills manager, perform their workflow while verbally explaining the steps and logic, and avoid including sensitive information. After recording, Claude processes the content and creates the Skill, which can be saved and later invoked with a slash command (/). This eliminates the need for manual adjustments or writing complex instruction files. The innovation goes beyond mere efficiency. Previously, creating a Skill required writing a detailed SKILL.md file in Markdown—a significant barrier for non-technical users. "Record a Skill" bypasses this by directly capturing both actions and the implicit reasoning shared in the narration. This lowers the barrier to knowledge transfer and automation, addressing a core challenge in corporate knowledge management: the difficulty of getting experts to write and maintain documentation. However, the feature also highlights a shift in the nature of work. A case study from March 2026 showed a freelancer whose five-year client relationship was effectively replaced by a hand-coded Claude Skill automating their content workflow. With the even lower barrier of screen recording, the ability to distill personal expertise into automatable skills accelerates this trend. The "moat" for work is moving from simply knowing how to do a task to mastering tasks that are difficult or impossible to automate.

marsbit7 хв тому

Claude's Major New Feature: Screen Recording + Voice, Distilling Your Skills into AI Tasks in One Click

marsbit7 хв тому

Feeding AI "Noise" Can Also Boost Scores, This Work Enables Positive Transfer with Noise

Feeding "Noise" to AI Can Improve Performance: A Method Enables Positive Transfer from Noise This work, Semi-Supervised Noise Adaptation (SSNA), introduces a Noise Adaptation Framework (NAF) that challenges traditional transfer learning. Instead of requiring a labeled source domain of real data (e.g., images, text), NAF uses randomly generated Gaussian noise as the source. For a target task with C classes, it constructs C noise clusters by sampling from Gaussian distributions. Although this synthetic noise contains no semantic meaning, NAF trains it to form a discriminative class structure in a shared representation space—clustering same-class noise and separating different classes. The key is aligning this learned structure from the noise domain to the real, sparsely labeled target domain. A small number of target labels are still essential to establish the correspondence between noise clusters and actual classes. The training objective combines: 1) supervised loss on the few labeled target samples, 2) classification loss for the noise to build its structure, and 3) a distribution alignment loss (using Negative Domain Similarity) to minimize the gap between the noise and target domains in the shared space. Experiments show significant gains in few-label settings. With just 4 labels per class, NAF with a ResNet-18 backbone improves accuracy over a standard supervised baseline (ERM) by +12.35% on CIFAR-10, +7.61% on CIFAR-100, +4.38% on DTD-47, and +2.74% on Caltech-101. It also benefits fine-grained datasets and scales to ImageNet-1K (with 100 labels/class) and text classification (AG News). NAF can be integrated into existing semi-supervised methods like FixMatch for further gains. Ablation studies confirm the transferred benefit comes from the discriminative structure of the noise, not randomness itself. Collapsing all noise into a single point causes negative transfer, while increasing separation between noise cluster centers improves performance. The amount of noise per class is less critical once a basic structure forms. In conclusion, this work demonstrates that for positive transfer, the semantic content of source data may not be necessary. What can be effectively transferred is the *organizational structure* of categories within a representation space. This offers a promising alternative for scenarios where real source data is unavailable due to privacy, copyright, or procurement constraints.

marsbit9 хв тому

Feeding AI "Noise" Can Also Boost Scores, This Work Enables Positive Transfer with Noise

marsbit9 хв тому

Торгівля

Спот

Популярні статті

Як купити O

Ласкаво просимо до HTX.com! Ми зробили покупку O1 exchange (O) простою та зручною. Дотримуйтесь нашої покрокової інструкції, щоб розпочати свою криптовалютну подорож.Крок 1: Створіть обліковий запис на HTXВикористовуйте свою електронну пошту або номер телефону, щоб зареєструвати обліковий запис на HTX безплатно. Пройдіть безпроблемну реєстрацію й отримайте доступ до всіх функцій.ЗареєструватисьКрок 2: Перейдіть до розділу Купити крипту і виберіть спосіб оплатиКредитна/дебетова картка: використовуйте вашу картку Visa або Mastercard, щоб миттєво купити O1 exchange (O).Баланс: використовуйте кошти з балансу вашого рахунку HTX для безперешкодної торгівлі.Треті особи: ми додали популярні способи оплати, такі як Google Pay та Apple Pay, щоб підвищити зручність.P2P: Торгуйте безпосередньо з іншими користувачами на HTX.Позабіржова торгівля (OTC): ми пропонуємо індивідуальні послуги та конкурентні обмінні курси для трейдерів.Крок 3: Зберігайте свої O1 exchange (O)Після придбання O1 exchange (O) збережіть його у своєму обліковому записі на HTX. Крім того, ви можете відправити його в інше місце за допомогою блокчейн-переказу або використовувати його для торгівлі іншими криптовалютами.Крок 4: Торгівля O1 exchange (O)Легко торгуйте O1 exchange (O) на спотовому ринку HTX. Просто увійдіть до свого облікового запису, виберіть торгову пару, укладайте угоди та спостерігайте за ними в режимі реального часу. Ми пропонуємо зручний досвід як для початківців, так і для досвідчених трейдерів.

155 переглядів усьогоОпубліковано 2026.06.19Оновлено 2026.06.19

Як купити O

Як купити PROS

Ласкаво просимо до HTX.com! Ми зробили покупку Pharos (PROS) простою та зручною. Дотримуйтесь нашої покрокової інструкції, щоб розпочати свою криптовалютну подорож.Крок 1: Створіть обліковий запис на HTXВикористовуйте свою електронну пошту або номер телефону, щоб зареєструвати обліковий запис на HTX безплатно. Пройдіть безпроблемну реєстрацію й отримайте доступ до всіх функцій.ЗареєструватисьКрок 2: Перейдіть до розділу Купити крипту і виберіть спосіб оплатиКредитна/дебетова картка: використовуйте вашу картку Visa або Mastercard, щоб миттєво купити Pharos (PROS).Баланс: використовуйте кошти з балансу вашого рахунку HTX для безперешкодної торгівлі.Треті особи: ми додали популярні способи оплати, такі як Google Pay та Apple Pay, щоб підвищити зручність.P2P: Торгуйте безпосередньо з іншими користувачами на HTX.Позабіржова торгівля (OTC): ми пропонуємо індивідуальні послуги та конкурентні обмінні курси для трейдерів.Крок 3: Зберігайте свої Pharos (PROS)Після придбання Pharos (PROS) збережіть його у своєму обліковому записі на HTX. Крім того, ви можете відправити його в інше місце за допомогою блокчейн-переказу або використовувати його для торгівлі іншими криптовалютами.Крок 4: Торгівля Pharos (PROS)Легко торгуйте Pharos (PROS) на спотовому ринку HTX. Просто увійдіть до свого облікового запису, виберіть торгову пару, укладайте угоди та спостерігайте за ними в режимі реального часу. Ми пропонуємо зручний досвід як для початківців, так і для досвідчених трейдерів.

206 переглядів усьогоОпубліковано 2026.06.22Оновлено 2026.06.22

Як купити PROS

Що таке VERONA

I. Вступ до проекту VERONA - це блокчейн, створений для всіх, скрізь, через абстракцію ланцюга. Використовуючи свій загальний шар абстракції, VERONA вирізняється інтеграцією складних функцій блокчейну, таких як рахунки, підписи та взаємодія, безпосередньо на рівні протоколу. Цей підхід дозволяє взаємодіяти з блокчейн-додатками без необхідності розуміти основні технології.1) Основна інформація Назва: VERONA (VERONA)III. Пов'язані посилання Офіційне посилання на сайт: https://xion.burnt.com/ Біла книга: https://xion.burnt.com/whitepaper.pdf Експлорери: https://explorer.burnt.com/ Соціальні мережі: https://x.com/burnt_xion Примітка: Вступ до проекту взято з матеріалів, опублікованих або наданих офіційною командою проекту, які є лише для довідки і не є інвестиційною порадою. HTX не несе відповідальності за будь-які прямі або непрямі збитки, що виникають внаслідок цього.

137 переглядів усьогоОпубліковано 2026.06.22Оновлено 2026.06.22

Що таке VERONA

Обговорення

Ласкаво просимо до спільноти HTX. Тут ви можете бути в курсі останніх подій розвитку платформи та отримати доступ до професійної ринкової інформації. Нижче представлені думки користувачів щодо ціни A (A).

活动图片