PIPPIN falls hard after $0.90 peak – Can bulls take back control?

ambcryptoОпубліковано о 2026-03-24Востаннє оновлено о 2026-03-24

Анотація

PIPPIN's price experienced a sharp decline from its peak of $0.90, falling to around $0.0915, driven by aggressive selling pressure and long liquidations. Open Interest dropped by 40%, indicating a significant exit of speculative capital and a fragile market structure. However, the token has recently stabilized between $0.082 and $0.10, with RSI recovering from oversold levels and trading volume declining—suggesting seller exhaustion. A break above the $0.113 resistance could signal a short-term bullish reversal, potentially pushing the price toward $0.15.

Pippin’s [PIPPIN] price action reflects classic memecoin expansion followed by rapid unwinding, as momentum shifts from hype to distribution.

The rally from $0.20–$0.30 into the $0.90 peak shows aggressive speculative inflows, likely driven by social momentum and short-term positioning.

As the price approached $0.90, selling pressure intensified, leading to a sharp drop toward $0.15, which marked the first major profit-taking phase. This move weakened the structure, as buyers failed to sustain higher levels, allowing momentum to fade.

Source: TradingView

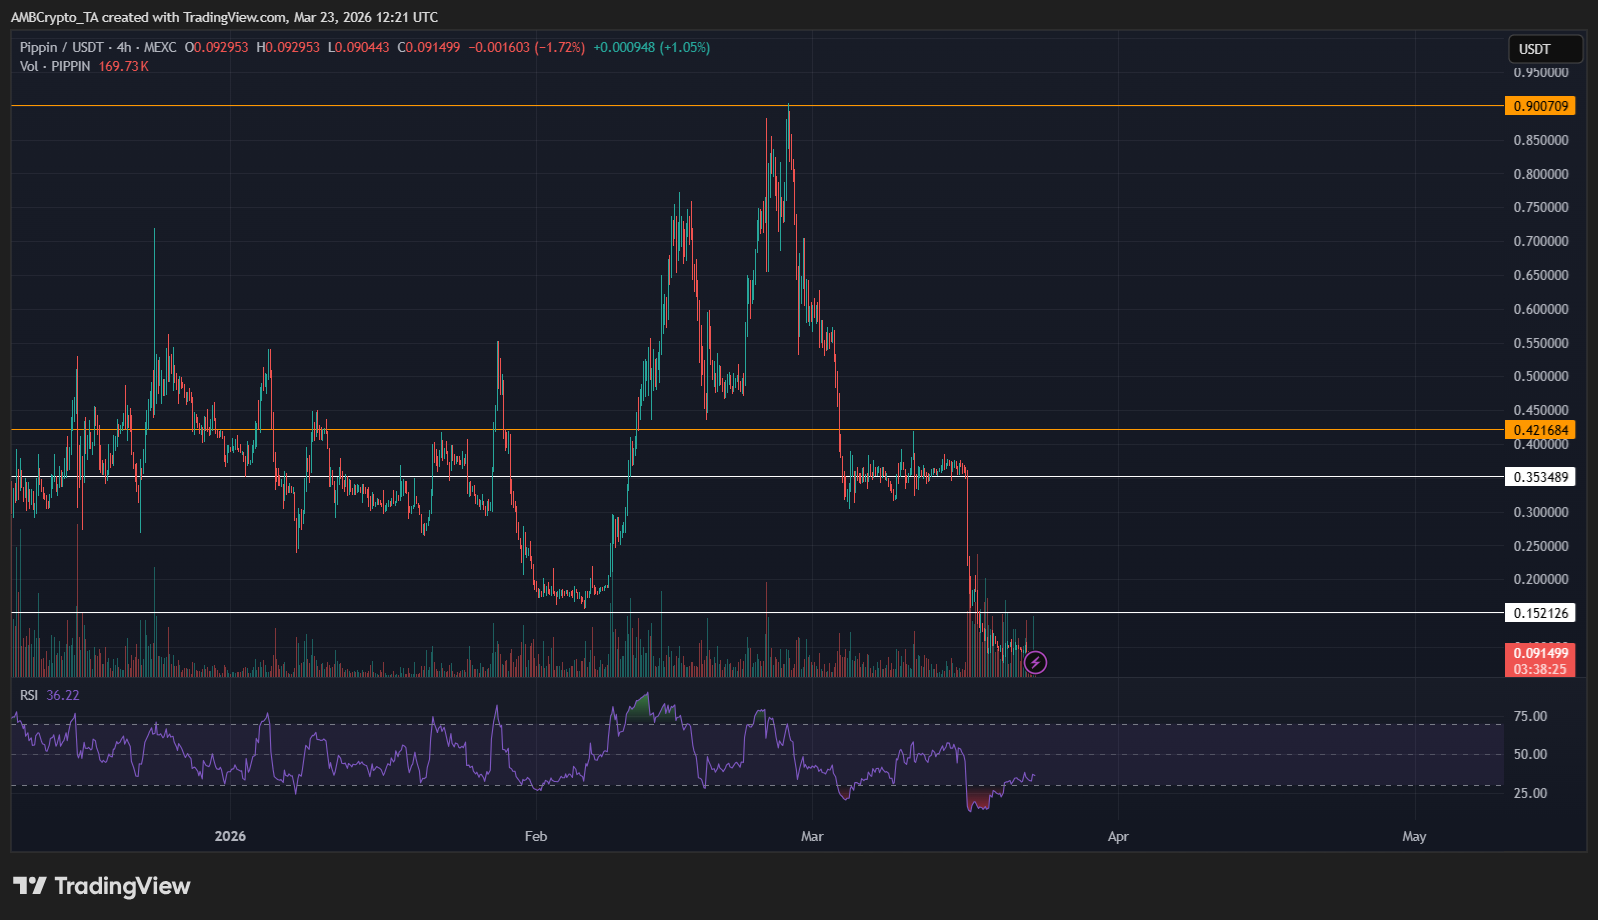
Price then consolidated briefly before breaking below $0.15, accelerating downside toward $0.0915, now acting as immediate support. RSI near 36 confirms bearish momentum, yet it is not fully oversold, which leaves room for further downside.

This decline reflects liquidity exit and fading demand, as speculative capital rotates out quickly. If $0.0915 fails, price may extend toward $0.05–$0.07, reinforcing a fragile, sentiment-driven structure.

Long liquidations accelerate as PIPPIN’s structure weakens

As price breaks below $0.15 and accelerates toward $0.0915, derivatives positioning confirms that the decline is driven by forced unwinding rather than fresh bearish bets.

Open Interest contracted to 74.14 million, dropping 12% in 24 hours and nearly 40% across major venues, which shows traders are closing positions instead of adding exposure.

Source: CoinGlass

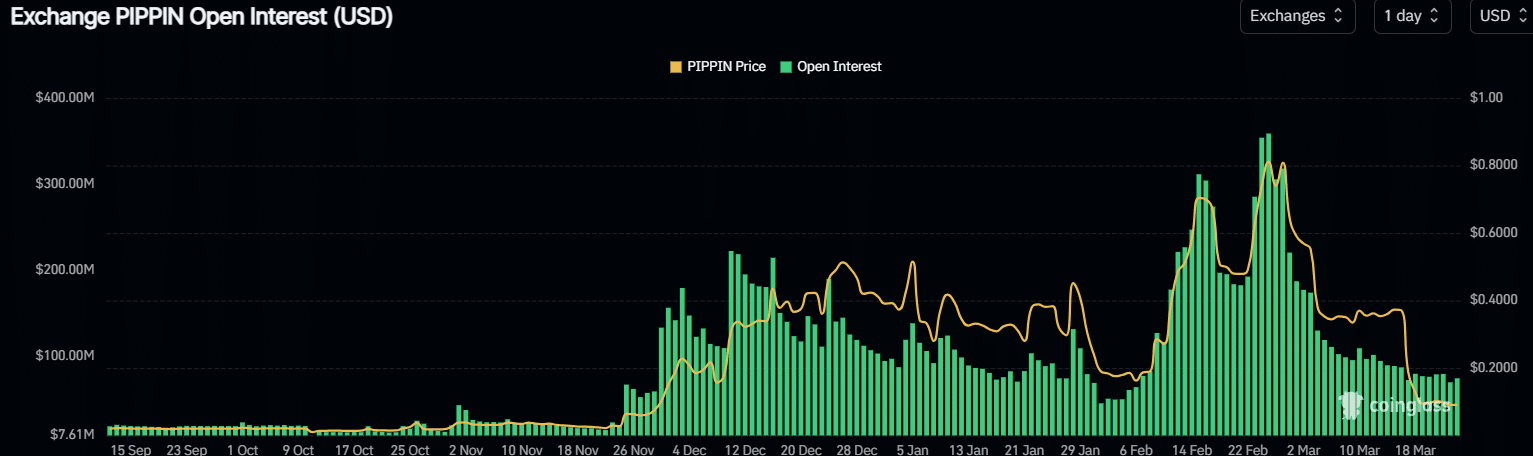
This shift reflects a long unwind phase, where overleveraged participants exit as losses mount, amplifying downside pressure. At the same time, Funding Rates remained positive near 0.05%, which revealed that some longs still held positions, expecting a rebound despite weakening structure.

As liquidations increased, long-side wipes dominated, contributing to cascading sell pressure and reinforcing the breakdown. This imbalance highlights a fragile market, where liquidity thins as participants retreat.

With conviction fading and capital exiting, the structure becomes hollow, meaning price lacks strong support. Until Open Interest stabilizes and funding normalizes, the market remains vulnerable to further downside or sharp volatility spikes.

Short-term strength builds as PIPPIN finds a floor

After the sharp breakdown, price began stabilizing between $0.082 and $0.10, forming a clear short-term floor. As lower lows disappeared, buyers gradually absorbed remaining sell pressure, shifting structure from decline to accumulation.

The RSI recovered from oversold levels below 20 to around 50.6, signaling improving momentum as buying strength starts matching selling pressure. This transition suggests that short-term control is slowly rotating back toward bulls.

Source: TradingView

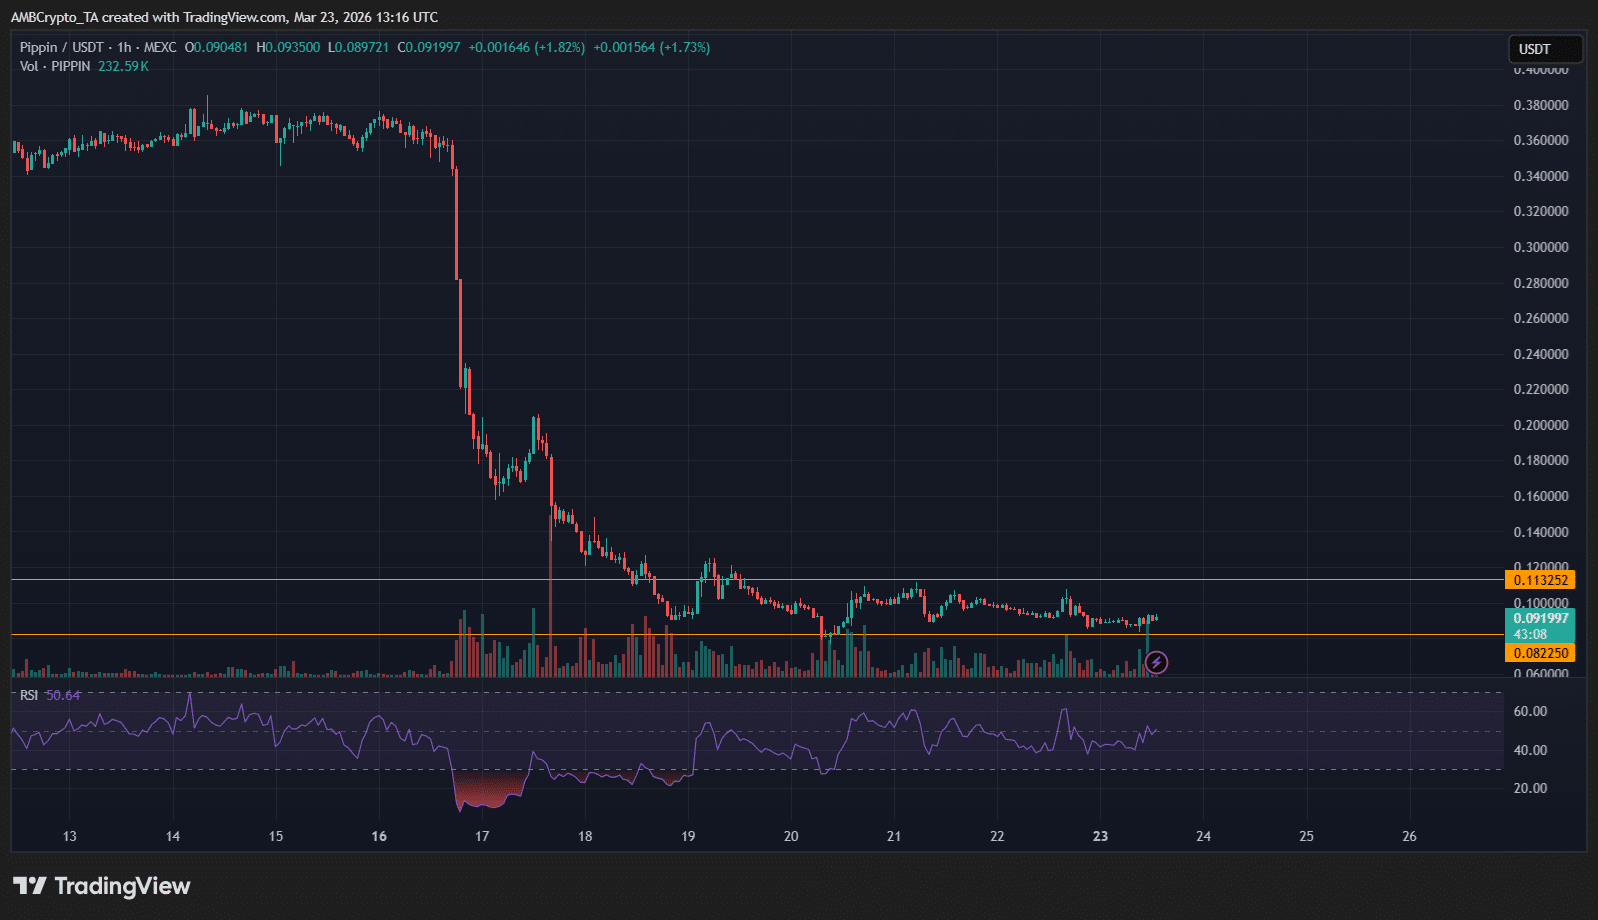
At the same time, volume declines noticeably compared to the crash on the 17th of March, indicating seller exhaustion as aggressive dumping fades. With fewer sellers, smaller buy orders can now influence price more effectively.

Price tightens below the $0.113 resistance, creating a compression range. If this level breaks, momentum could accelerate toward $0.15, confirming a short-term reversal structure.


Final Summary

  • PIPPIN’s collapse from $0.90 to $0.0915, driven by long liquidations and a 40% Open Interest drop signals liquidity exit and fragile structure.
  • PIPPIN stabilization between $0.082 and $0.10 with RSI recovery and declining volume suggests seller exhaustion, positioning for short-term rebound if $0.113 breaks.

Трендові криптовалюти

Пов'язані питання

QWhat was the peak price of PIPPIN and what does its subsequent drop to $0.0915 indicate?

APIPPIN reached a peak price of $0.90. The subsequent sharp drop to $0.0915 indicates a classic memecoin pattern of rapid unwinding, driven by profit-taking, long liquidations, and a significant exit of speculative capital, revealing a fragile market structure.

QHow did Open Interest and Funding Rates change during PIPPIN's decline, and what does this suggest about market sentiment?

AOpen Interest contracted by 12% in 24 hours and nearly 40% across major venues, indicating traders were closing positions rather than adding new exposure. Despite this, Funding Rates remained slightly positive at 0.05%, suggesting some longs were still holding, hoping for a rebound, but the overall sentiment was weak with capital exiting.

QWhat key support level is PIPPIN currently testing, and what is the significance of a break below it?

APIPPIN is testing immediate support at $0.0915. A break below this level could lead to a further decline toward the $0.05–$0.07 range, reinforcing the fragile, sentiment-driven nature of its market structure.

QWhat signs suggest that PIPPIN might be forming a short-term bottom and a potential rebound?

ASigns of a short-term bottom include price stabilization between $0.082 and $0.10, the RSI recovering from oversold levels (20) to around 50.6, and a noticeable decline in trading volume indicating seller exhaustion. A break above the $0.113 resistance could confirm a short-term reversal.

QWhat was the primary driver behind the cascading sell pressure during PIPPIN's price crash?

AThe cascading sell pressure was primarily driven by long liquidations, where overleveraged participants were forced to exit their positions as losses mounted. This created a cycle of amplified downside pressure and contributed to the rapid breakdown in price.

Пов'язані матеріали

Analysis of the Latest Portfolio Adjustment by the "Top Player" in the U.S. Stock Market: $9 Billion Short on NVIDIA, Shifting Focus to Power and Memory Sectors

AI investor Leopold Aschenbrenner has made a significant portfolio shift, taking a $9 billion nominal short position against top AI infrastructure stocks like NVIDIA, ASML, and Oracle. Simultaneously, he is redirecting capital towards what he sees as the next critical bottlenecks in the AI boom: power, memory, and data center networking, alongside private investments in AI model companies like Anthropic. This move is interpreted not as a call that the AI bubble has burst, but as a rotation within the infrastructure stack. The analysis highlights NVIDIA's recent $25 billion bond issuance as a potential signal, questioning why a cash-rich company would seek external debt despite high profits and increased dividends/buybacks. The core investment thesis is that the initial, crowded "picks and shovels" trade in semiconductors is maturing. The next wave of capital is expected to flow into the physical and logistical constraints of AI expansion: electricity supply, memory chip capacity, data center construction, and enabling technologies like optical networking (fiber) for high-bandwidth communication, where copper remains crucial for short distances. Aschenbrenner's substantial (approx. 20% of fund) private stake in Anthropic is noted as a key part of his strategy—investing directly in the "mine" (AI models) rather than just the "shovels." The discussion concludes that while certain segments may be overvalued, the overarching AI infrastructure demand driven by real product usage remains robust. The most promising long-term investments are seen in essential, non-sexy infrastructure—particularly energy and power companies—whose demand is viewed as a global constant irrespective of AI's cyclicality.

marsbit5 хв тому

Analysis of the Latest Portfolio Adjustment by the "Top Player" in the U.S. Stock Market: $9 Billion Short on NVIDIA, Shifting Focus to Power and Memory Sectors

marsbit5 хв тому

BIT Research: Liquidity is Disappearing, Will Bitcoin Replay the Bottoming Pattern of 2022?

The crypto market is currently in an adjustment phase driven by policy expectations and liquidity shifts. Despite a brief rebound fueled by geopolitical easing and SpaceX's strong IPO performance, unexpectedly hawkish signals from new Fed Chair Kevin Warsh have removed anticipated easing support. Concurrently, stablecoin liquidity is shrinking, with insufficient new capital inflows, pushing the market into a typically quiet summer period. Pricing lacks catalysts for a sustained rally. Daily trading volume has significantly contracted, stablecoin growth has slowed markedly, and the supportive effect of Strategy's (formerly MicroStrategy) STRC preferred stock-financed Bitcoin purchases is fading. Amid policy uncertainty, seasonal weakness, and liquidity contraction, Bitcoin faces near-term downward pressure. Warsh's hawkish pivot and refusal to provide a clear policy outlook have increased risk premiums, historically unfavorable for Bitcoin. Technically, the trend remains bearish below $73,700, with $62,446 as critical support. A break below could accelerate declines, though a prolonged consolidation phase, similar to 2022's bottoming process, is possible. Liquidity is a core constraint. Current daily volume is around $500 billion, roughly 25% of the peak during the July-Oct 2025 rally. The 12-month growth rates for USDT and USDC have fallen to ~20%, with 6-month growth near zero, indicating weak new inflows. Bitcoin ETF and Strategy-driven inflows have also weakened, with a 30-day rolling net outflow. With inflation at 4.2% above the Fed's target, combined hawkish policy, seasonal factors, and liquidity shortages challenge Bitcoin's ability to hold above $60,000. However, this adjustment phase may be forming a cyclical low this summer, potentially setting the stage for the next bull cycle.

marsbit33 хв тому

BIT Research: Liquidity is Disappearing, Will Bitcoin Replay the Bottoming Pattern of 2022?

marsbit33 хв тому

Who Makes the Best Use of Claude Code? The Answer Might Not Be Programmers

Claude Code Usage Report Summary (Based on ~400k sessions) Core Finding: In agentic programming with Claude Code, a clear division of labor has emerged: humans primarily decide *what* to build (planning decisions), while Claude decides *how* to build it (execution decisions). Key Insights: 1. **Effectiveness is not limited to programmers.** In code-generation tasks, success rates for users in non-technical fields (law, finance, management, research) are nearing those of software engineers. What matters most is the user's domain expertise and understanding of the problem to be solved. 2. **Domain expertise drives success and efficiency.** Sessions where users exhibited "expert" proficiency in the task's domain saw verified success rates double compared to "novice" sessions. Experts also delegated more work per instruction, with Claude executing more actions and producing more output. 3. **AI is amplifying, not replacing, domain knowledge.** Claude Code lowers the *implementation* barrier, not the *judgment* barrier. The value of knowing the "what" and "why" is increasing relative to just knowing the "how" to code. 4. **Usage is evolving.** Over a 7-month period (Oct '25 - Apr '26), the share of sessions for debugging halved, while use for software operations, data analysis, and non-code writing roughly doubled. The estimated economic value of typical tasks increased by ~25%. Conclusion: The data suggests coding agents are making programming background less critical for completing technical tasks. However, they reward and amplify deep domain understanding. The ability to successfully direct an AI agent stems more from mastery of a specific field than from coding skill itself. The primary gains come from being competent in a domain; deep specialization adds only marginal additional advantage. This may signal a shift where software creation becomes integrated into various professions.

marsbit1 год тому

Who Makes the Best Use of Claude Code? The Answer Might Not Be Programmers

marsbit1 год тому

Торгівля

Спот
Ф'ючерси

Популярні статті

Як купити PIPPIN

Ласкаво просимо до HTX.com! Ми зробили покупку pippin (PIPPIN) простою та зручною. Дотримуйтесь нашої покрокової інструкції, щоб розпочати свою криптовалютну подорож.Крок 1: Створіть обліковий запис на HTXВикористовуйте свою електронну пошту або номер телефону, щоб зареєструвати обліковий запис на HTX безплатно. Пройдіть безпроблемну реєстрацію й отримайте доступ до всіх функцій.ЗареєструватисьКрок 2: Перейдіть до розділу Купити крипту і виберіть спосіб оплатиКредитна/дебетова картка: використовуйте вашу картку Visa або Mastercard, щоб миттєво купити pippin (PIPPIN).Баланс: використовуйте кошти з балансу вашого рахунку HTX для безперешкодної торгівлі.Треті особи: ми додали популярні способи оплати, такі як Google Pay та Apple Pay, щоб підвищити зручність.P2P: Торгуйте безпосередньо з іншими користувачами на HTX.Позабіржова торгівля (OTC): ми пропонуємо індивідуальні послуги та конкурентні обмінні курси для трейдерів.Крок 3: Зберігайте свої pippin (PIPPIN)Після придбання pippin (PIPPIN) збережіть його у своєму обліковому записі на HTX. Крім того, ви можете відправити його в інше місце за допомогою блокчейн-переказу або використовувати його для торгівлі іншими криптовалютами.Крок 4: Торгівля pippin (PIPPIN)Легко торгуйте pippin (PIPPIN) на спотовому ринку HTX. Просто увійдіть до свого облікового запису, виберіть торгову пару, укладайте угоди та спостерігайте за ними в режимі реального часу. Ми пропонуємо зручний досвід як для початківців, так і для досвідчених трейдерів.

510 переглядів усьогоОпубліковано 2025.01.11Оновлено 2026.06.02

Як купити PIPPIN

Обговорення

Ласкаво просимо до спільноти HTX. Тут ви можете бути в курсі останніх подій розвитку платформи та отримати доступ до професійної ринкової інформації. Нижче представлені думки користувачів щодо ціни PIPPIN (PIPPIN).

活动图片