Monad eyes all-time high: Accumulation surges as MON bulls test key resistance

ambcryptoОпубліковано о 2026-04-09Востаннє оновлено о 2026-04-09

Анотація

Monad (MON) has surged 13% in 24 hours, emerging as a top market performer. The rally is supported by strong accumulation, with the Accumulation/Distribution indicator and Money Flow Index (MFI) both trending upward, indicating sustained buying pressure and capital inflows. However, the price faces a key resistance zone, and the Bollinger Bands suggest MON is overbought, signaling potential for a short-term pullback. Breaking this resistance is crucial for a sustained upward move toward its all-time high, which would require a 56% increase and an additional $851 million in market capitalization. This depends on continued bullish sentiment across spot and futures markets, as well as broader crypto market stability.

Monad [MON] could rank among the market’s top gainers if bullish strength persists, especially as the asset posts a 13% gain over the past day, placing it among the leading performers in the crypto market over the last 24 hours.

However, the rally still faces a major obstacle, as price trades within a resistance block expected to cap further upside. The key question is whether Monad can break above this level and open a path toward its all-time high.

Monad rallies on the back of accumulation

The recent surge in accumulation has supported MON’s upward momentum, and current indicators suggest that this trend may not slow down soon.

The Accumulation/Distribution indicator continues to trend higher, showing that as price increases, investors keep buying. Trading volume has also strengthened, exceeding 2.69 billion over the past day.

Accumulation tells only part of the story. The Money Flow Index (MFI), which tracks capital inflow and outflow, also indicates stronger inflows over the same period.

Source: TradingView

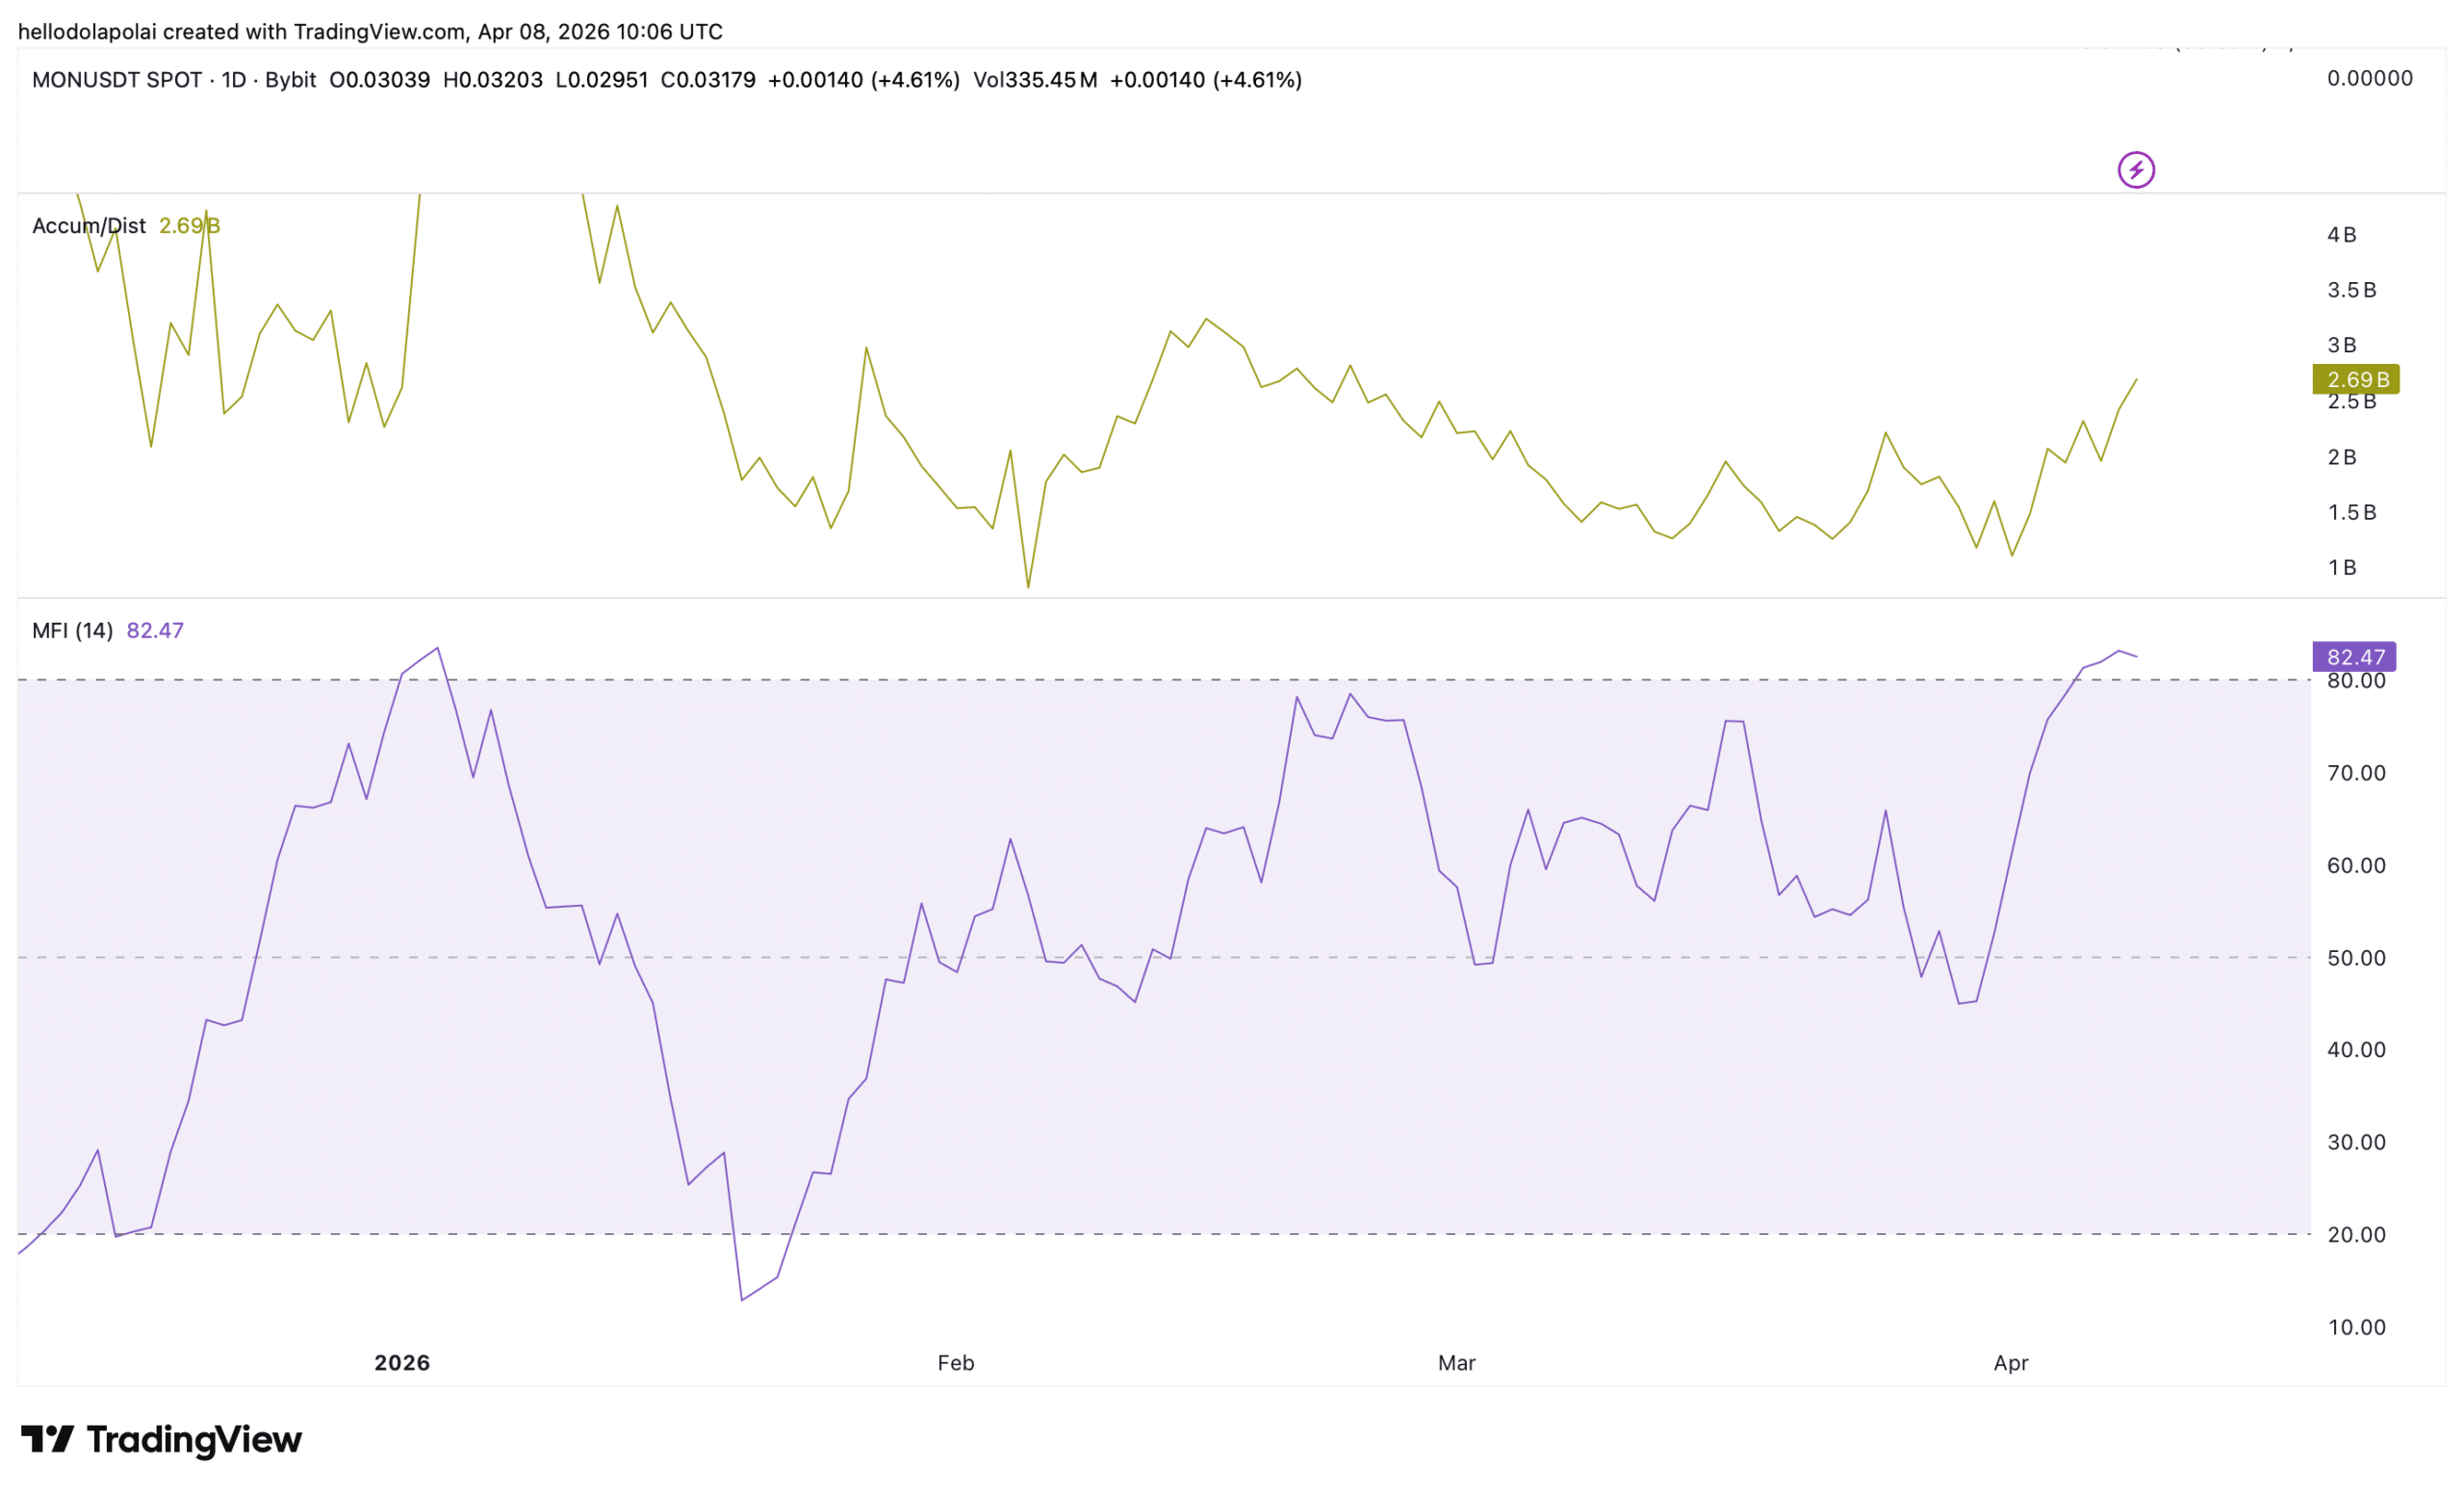
The MFI remains slightly above the 80 level and trends upward, suggesting that investors are positioning for further upside gains.

While this outlook remains bullish, market volatility requires close attention, as sentiment can shift quickly, particularly with the broader market still in a bearish phase.

Warning signs emerge

Bullish positioning comes with caution. The Bollinger Bands indicator, which measures whether an asset is overbought or oversold, shows that MON has entered the overbought region.

This level, marked by the upper band, suggests that buying pressure could weaken, potentially leading to a pullback toward lower levels, though not necessarily an immediate reversal.

Source: TradingView

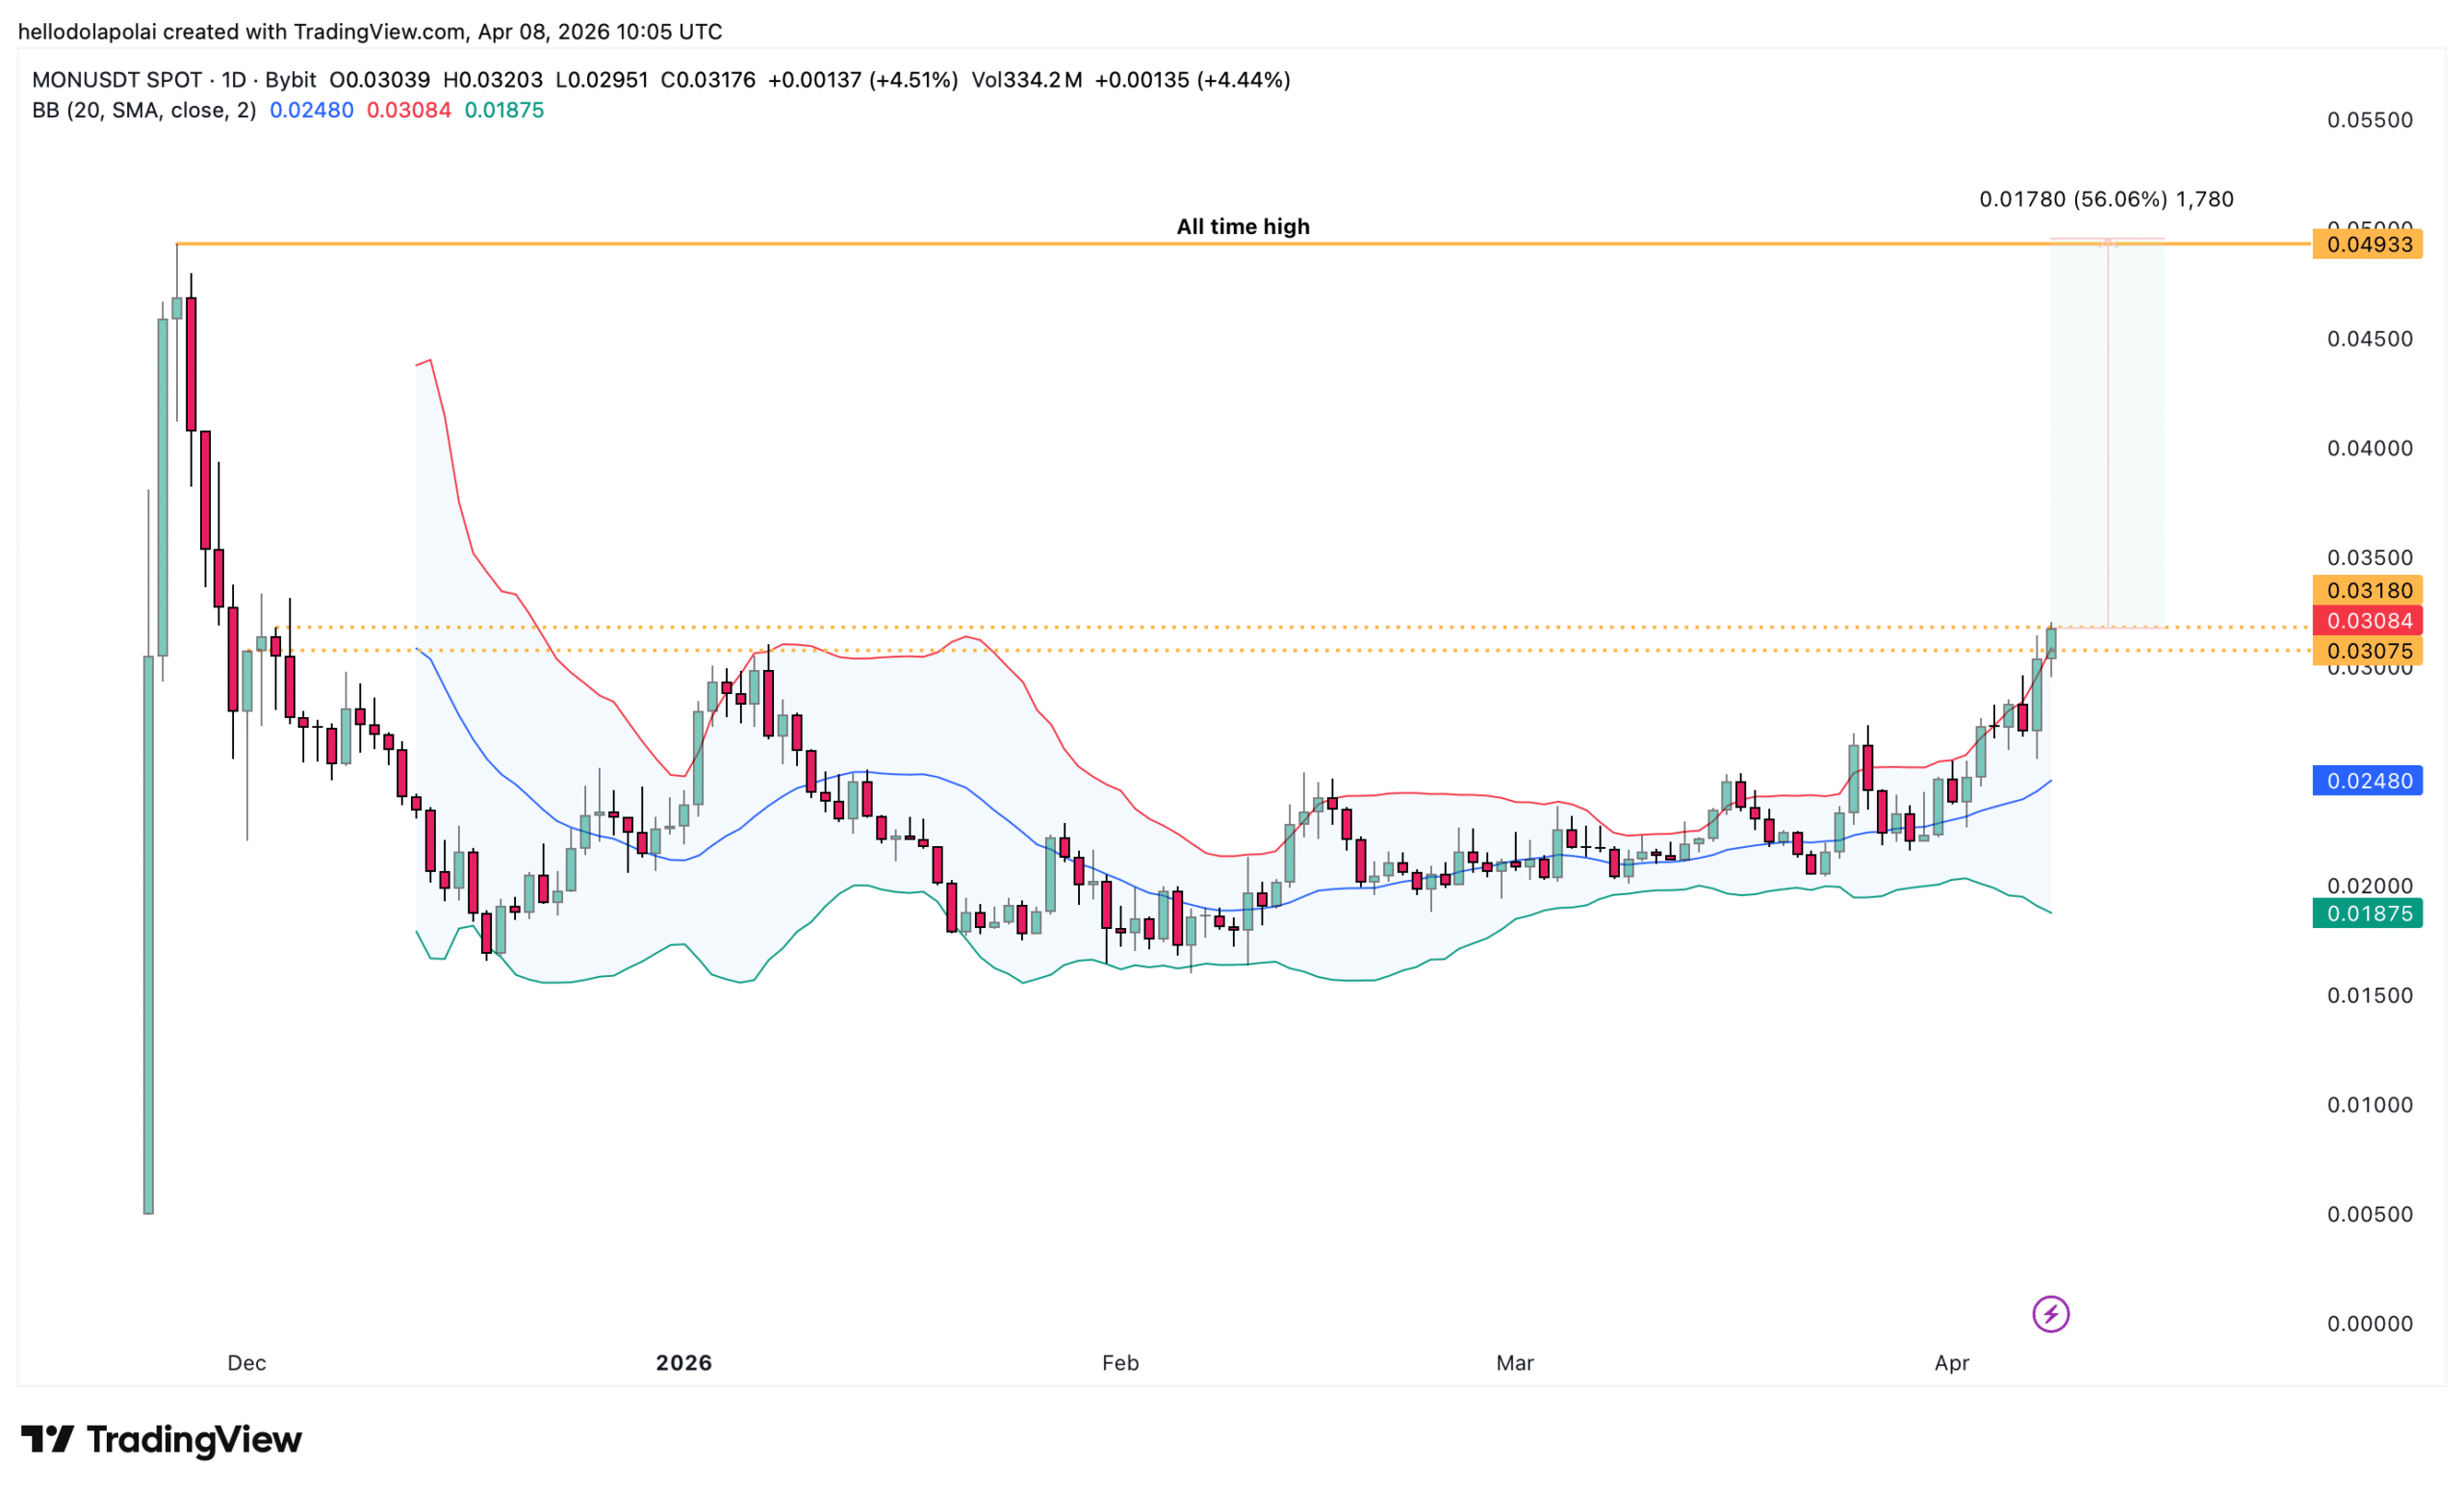
This aligns with the resistance zone on the chart, which could act as a strong barrier and push prices lower. In that scenario, MON could form lower lows or continue to range, with the latter more likely if accumulation continues to build.

On the other hand, a breakout would significantly strengthen MON’s structure. Price would face less resistance on the path higher, as fewer supply zones remain overhead.

Is an all-time high likely?

A move toward a new all-time high depends on several factors, with capital inflow remaining the most critical.

A rally from the current level to the all-time high represents roughly a 56% increase. With a market capitalization of $1.52 billion, this would require an additional $851 million, pushing total valuation toward $2.37 billion.

For this to materialize, bullish sentiment must align across multiple fronts. Spot market accumulation must remain strong, perpetual Futures should continue to support long positioning, and broader crypto market sentiment must either turn bullish or stabilize.

At present, short-term data from both perpetual and Spot markets suggests that bulls remain in control. Over the past 10 days, MON’s perpetual flows reached $12.88 million, while Spot market inflows held at $7.31 million over the past five days, according to CoinGlass.


Final Summary

  • MON extends its run as accumulation surges again, while capital inflow into the market continues to rise.
  • A key resistance obstacle remains the critical level to watch in determining whether MON can sustain a major price rally.

Пов'язані питання

QWhat is the main obstacle Monad (MON) faces in its current rally according to the article?

AThe main obstacle is a key resistance block that is expected to cap further upside and could potentially push prices lower if not broken.

QWhich two indicators are highlighted as showing strong investor accumulation and capital inflow for MON?

AThe Accumulation/Distribution indicator and the Money Flow Index (MFI) both indicate strong accumulation and capital inflows.

QWhat does the Bollinger Bands indicator suggest about MON's current price level?

AThe Bollinger Bands indicator shows that the asset has entered the overbought region, suggesting buying pressure could weaken and a pullback is possible.

QHow much of a price increase is required for MON to reach a new all-time high from its current level?

AA rally from the current level to the all-time high would represent roughly a 56% increase.

QWhat are the three factors that must align for MON to achieve a new all-time high?

ASpot market accumulation must remain strong, perpetual Futures should continue to support long positioning, and broader crypto market sentiment must either turn bullish or stabilize.

Пов'язані матеріали

The World Cup is Here: The Battle for Entry into Prediction Markets Has Begun

The 2026 FIFA World Cup has begun, and alongside the on-field competition, a new off-field battleground is emerging: prediction markets. These blockchain-based platforms, which convert crowd wisdom into tradable probabilities, are gaining significant traction. However, their complexity—involving wallets, gas fees, and smart contracts—has historically limited participation to crypto-native users. Centralized exchanges (CEXs), like Gate, are tackling this adoption barrier. By integrating with leading prediction market protocol Polymarket, Gate simplifies the user experience. Users can participate directly with their exchange account and USDT, bypassing complex Web3 steps. Gate offers a streamlined "Prediction Mode" for casual users and a professional "Trading Mode" with advanced tools. Key features include two-way trading (allowing users to buy or sell positions before event resolution), support for diverse markets (sports, crypto, macroeconomics), and a suite of information tools like a "Smart Money" leaderboard, wallet tracking, and AI-powered insights. For the World Cup, Gate launched a dedicated hub aggregating schedules, standings, and relevant markets. This allows fans to seamlessly follow games and trade on outcomes, transforming passive viewing into active participation where they can monetize their predictions and trade on shifting consensus throughout a match. The article argues that prediction markets have proven their value in event forecasting. The next challenge is mass adoption. The competition is shifting from building effective protocols to creating accessible user entry points. By lowering technical barriers and building a complete ecosystem for information and trading, platforms like Gate aim to transition prediction markets from a niche crypto tool to a mainstream platform for expressing and trading on collective intelligence.

Odaily星球日报12 хв тому

The World Cup is Here: The Battle for Entry into Prediction Markets Has Begun

Odaily星球日报12 хв тому

Spain Held to a Draw by Cape Verde, Jucom Prediction Market Witnesses Historic Upset

In a major upset at the 2026 FIFA World Cup, tournament favorites Spain were held to a surprising 0-0 draw by debutants Cape Verde in their Group H opener on June 16, Beijing time. Despite dominating possession (74%) and recording 27 shots with an expected goals figure of 2.16, Spain failed to break down a resilient Cape Verde defense, with their 40-year-old goalkeeper Vozinha making 7 saves to earn Man of the Match. Pre-match predictions on the Jucom prediction market had heavily favored Spain, assigning them a 92% win probability. The actual result, a goalless draw, triggered significant volatility across related prediction markets. This outcome forces a market-wide reassessment of several key probabilities, including Spain's likelihood of winning the group and the tournament itself, while Cape Verde's previously near-zero chance of advancing is now being re-evaluated. The event highlights both the efficiency and the inherent limitations of prediction markets. While prices aggregate known information, football's low-scoring, high-variance nature means unquantifiable in-game factors can lead to unlikely results. The core value of such markets lies not in perfect foresight but in their ability to dynamically reflect how new information is incorporated into collective expectations. Platforms like Jucom, which track outcomes from single matches to the final champion, provide a real-time lens into how global consensus evolves with each game.

链捕手16 хв тому

Spain Held to a Draw by Cape Verde, Jucom Prediction Market Witnesses Historic Upset

链捕手16 хв тому

Standard Chartered Bank Places a 40x 'Bet', Calls for UNI to Rise to $100

Standard Chartered Bank’s digital asset research head, Geoff Kendrick, initiated coverage on Uniswap with a highly bullish long-term price target of $100 for its UNI token by 2030—a roughly 40-fold increase from its ~$2.60 trading price at the time of the report. The bank’s thesis hinges on the exponential growth of tokenized real-world assets (RWA), projected to surge from ~$340 billion to $4 trillion by 2028. It expects the share of these assets deployed in DeFi to rise from 3.5% to 30%, driving total DeFi TVL to around $2.7 trillion. As the leading decentralized exchange (DEX), Uniswap is positioned to capture a significant portion of this liquidity influx. A key catalyst is Uniswap’s “fee switch,” activated in late 2024, which directs a portion of protocol fees to UNI token buybacks and burns. This transforms UNI from a pure governance token into a yield-generating, deflationary asset, narrowing its valuation gap with centralized exchanges like Coinbase. The report draws an analogy: Coinbase operates like Netflix (centralized, high-cost), while Uniswap functions like YouTube (open, user-generated, network-effect driven). Despite its dominant market share and recent institutional adoption—such as BlackRock’s BUIDL fund and Fidelity’s stablecoin using Uniswap for liquidity—the path faces challenges. Competition from Solana-based DEXs and aggregators threatens user mindshare, while regulatory delays or setbacks in RWA adoption could slow the projected growth. Furthermore, UNI remains down over 92% from its 2021 peak, reflecting persistent market skepticism. Ultimately, Standard Chartered’s report signals a shift in traditional finance’s perception of DeFi, valuing network effects and cash flow potential. However, realizing the $100 target depends on Uniswap successfully navigating intense competition, regulatory hurdles, and the multi-year timeline for massive tokenized asset adoption.

marsbit40 хв тому

Standard Chartered Bank Places a 40x 'Bet', Calls for UNI to Rise to $100

marsbit40 хв тому

Торгівля

Спот
Ф'ючерси
活动图片