MemeCore has rallied over 18% in the last 24 hours, pushing the price toward $1.74 as trading activity expands rapidly across Spot markets.
Volume has surged to $13.67M, marking a sharp 46% increase, which reflects strong participation behind the move.
At the same time, market cap has climbed to $2.23B, reinforcing the scale of capital entering the asset. However, price still trades below a key resistance near $1.85, which continues to define the next directional move for MemeCore [M].
Can MemeCore sustain this breakout structure?
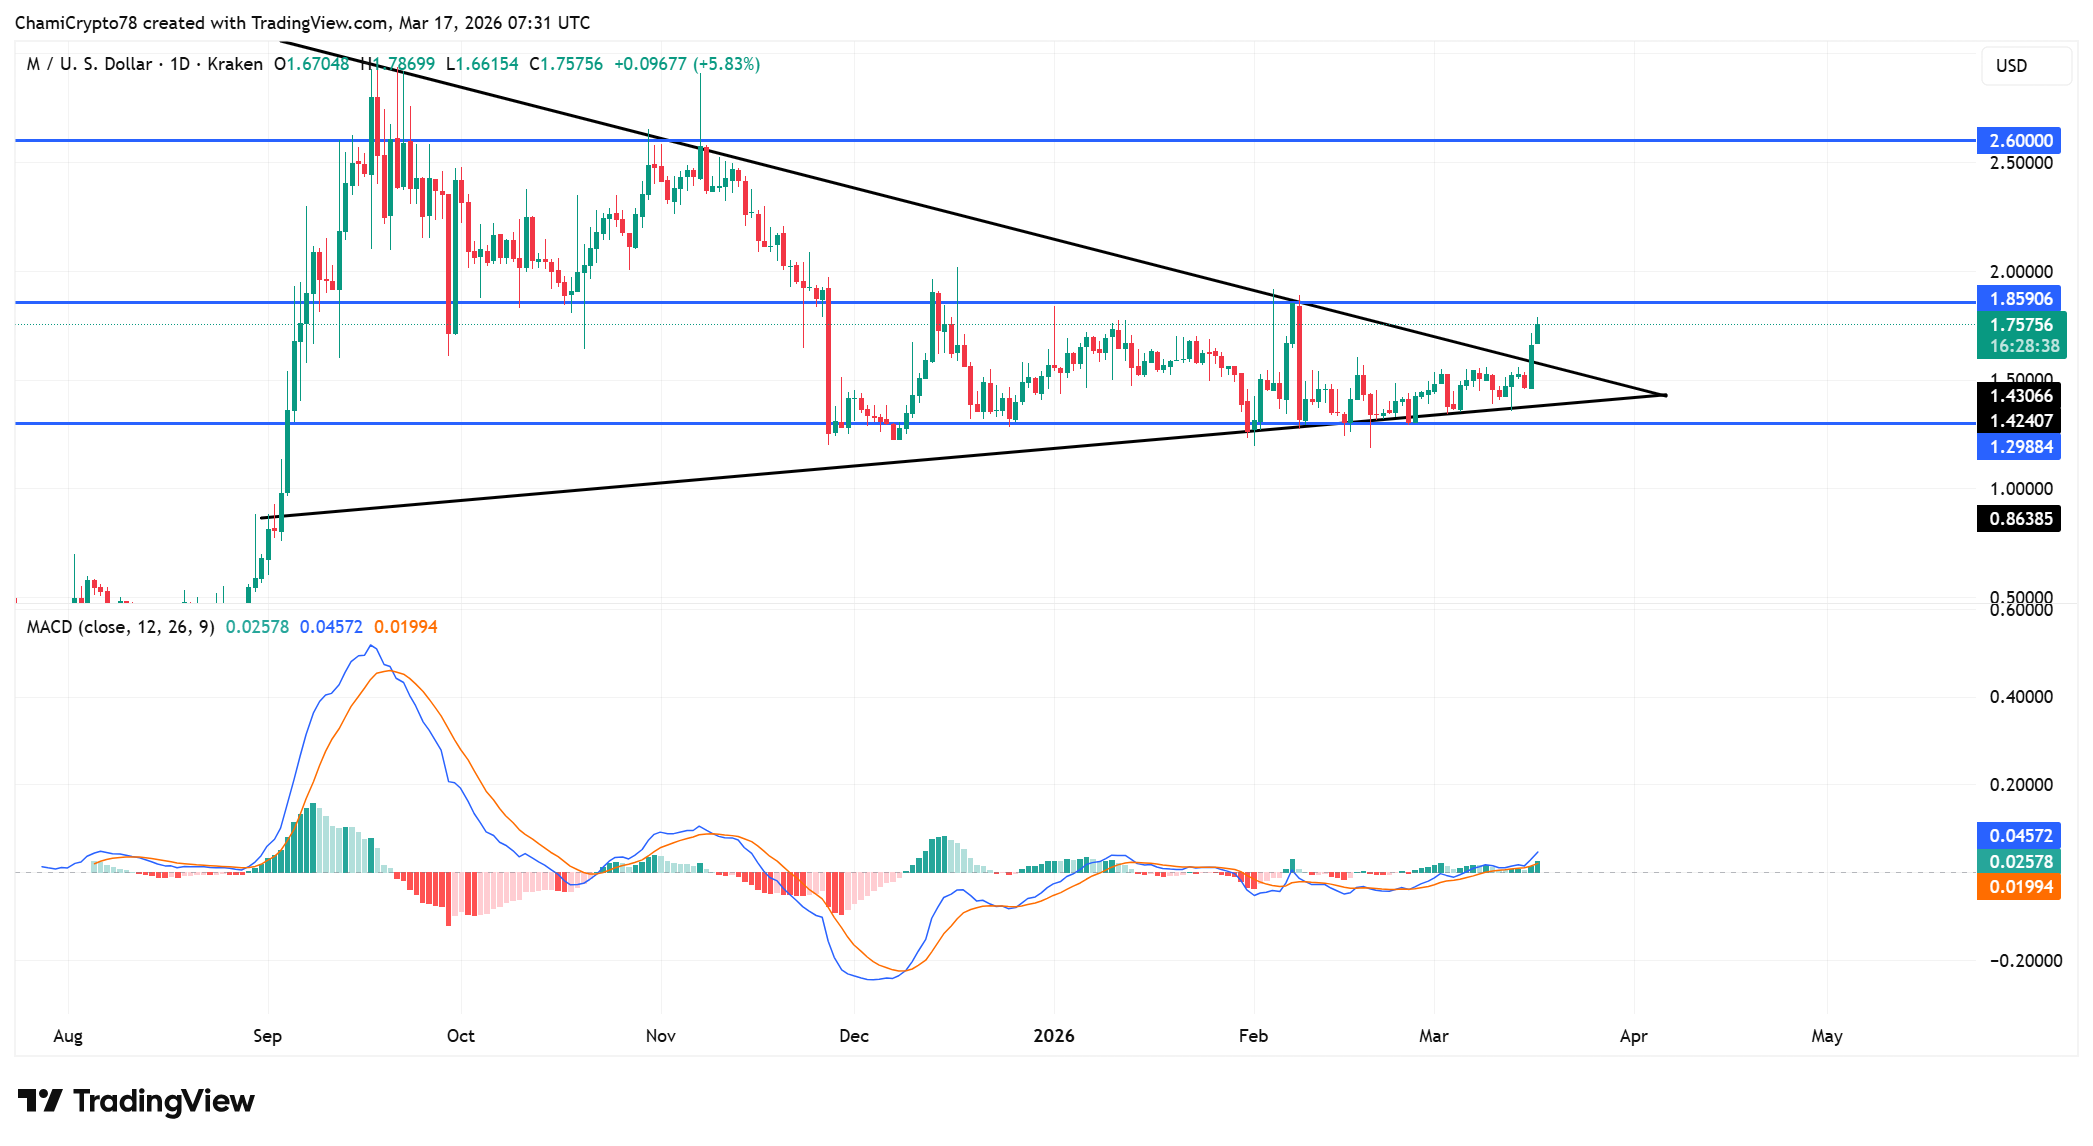
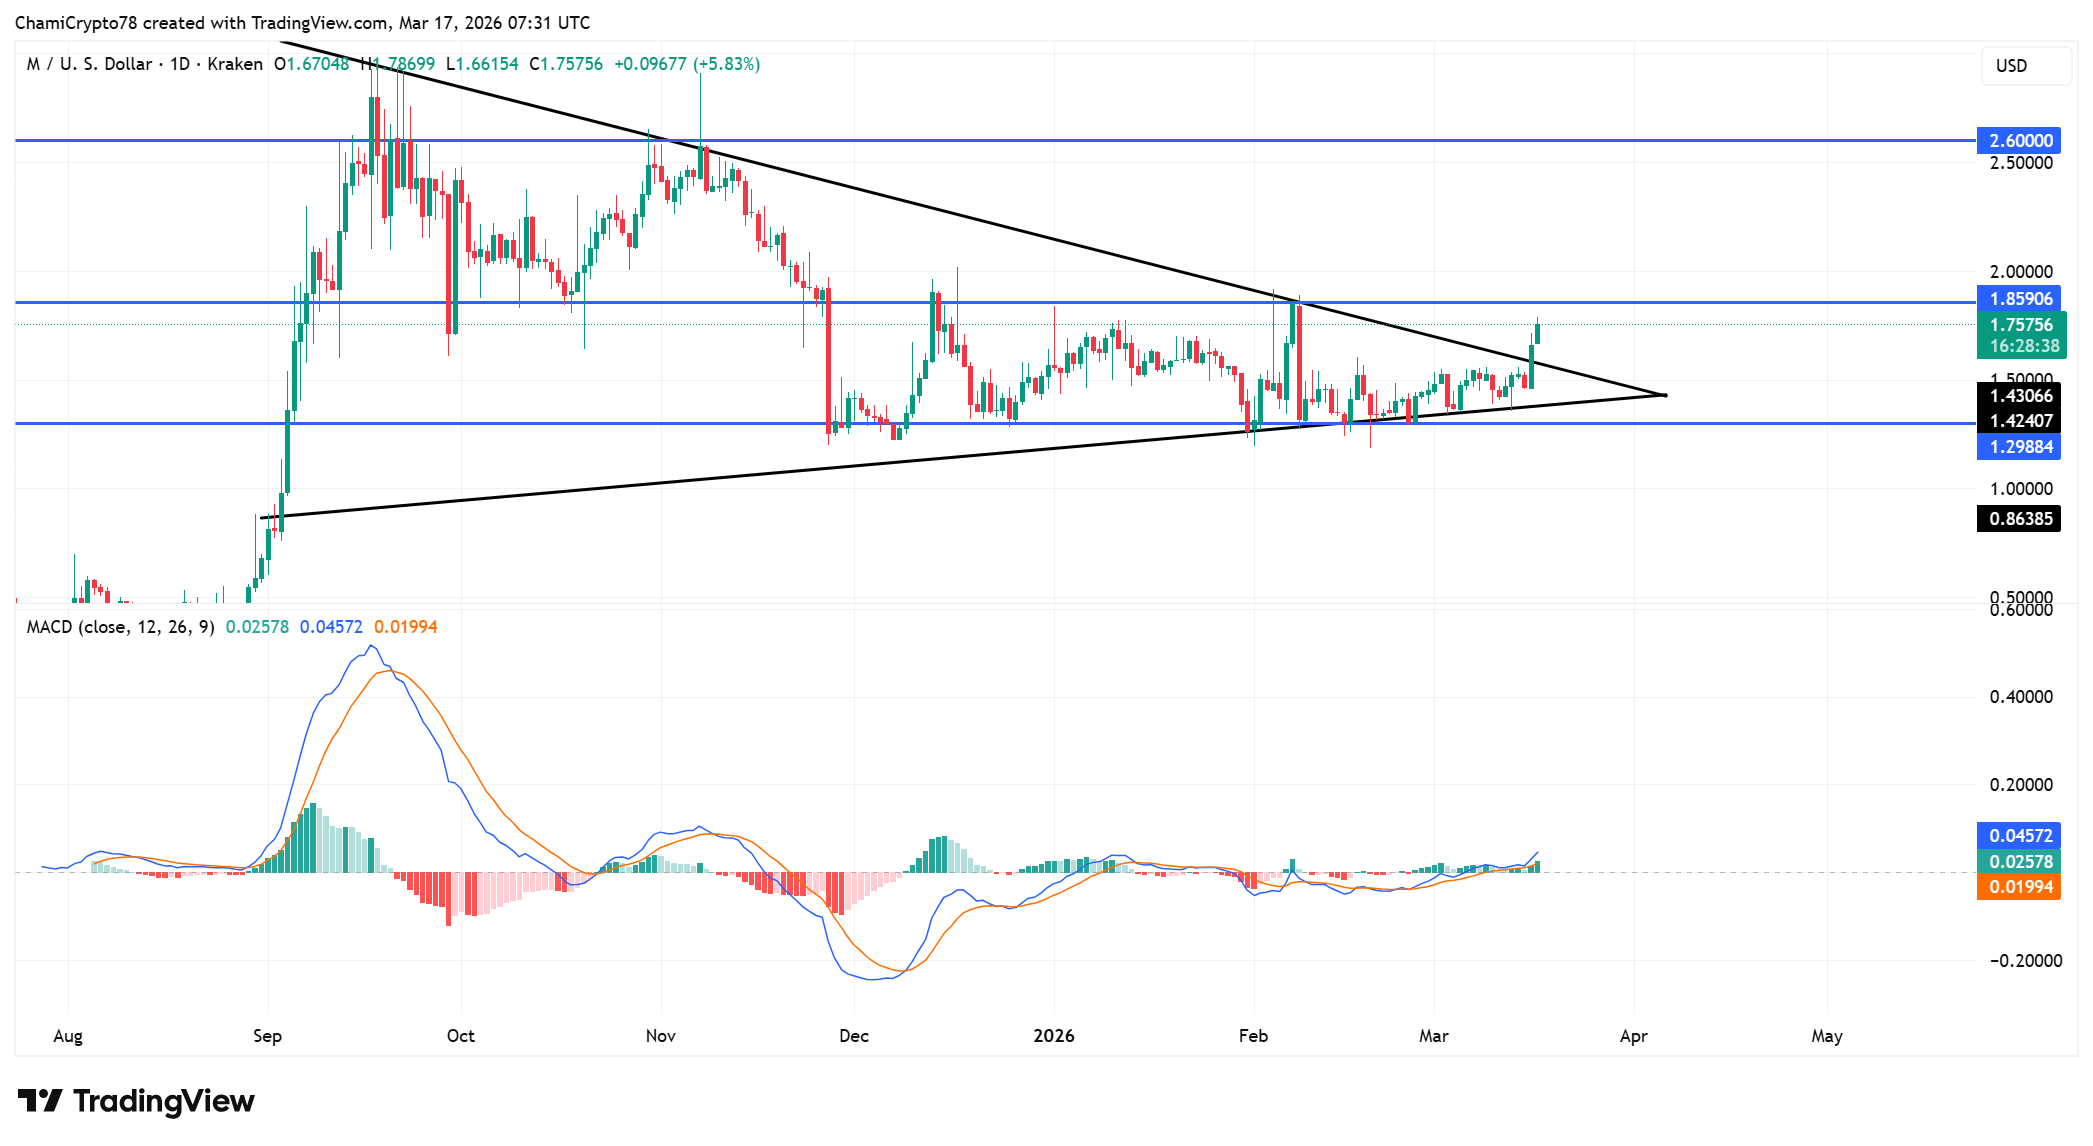
MemeCore has broken above a tightening symmetrical triangle, with price pushing upward after weeks of compression between converging trendlines.
This structure had formed between roughly $1.29 support and $1.85 resistance, creating a clear squeeze zone before the breakout attempt.
At the time of writing, M traded near $1.74, holding above the upper boundary of the triangle, which signaled that buyers have taken control of the short-term structure.
However, the $1.85 level still acts as overhead resistance, and repeated rejections at this level highlight its importance.
If MemeCore continues holding above the breakout zone, price could extend toward the $2.60 resistance, which remains the next major target.
The MACD indicator has shifted into a constructive phase, with the MACD line rising above the signal line and the histogram printing positive values.
Current readings near 0.025 for MACD and 0.019 for the signal line show expanding separation, which reflects strengthening upward pressure.
At the same time, the histogram has turned green, indicating that buying strength has started to dominate recent sessions.
Why are top traders leaning heavily long on MemeCore?
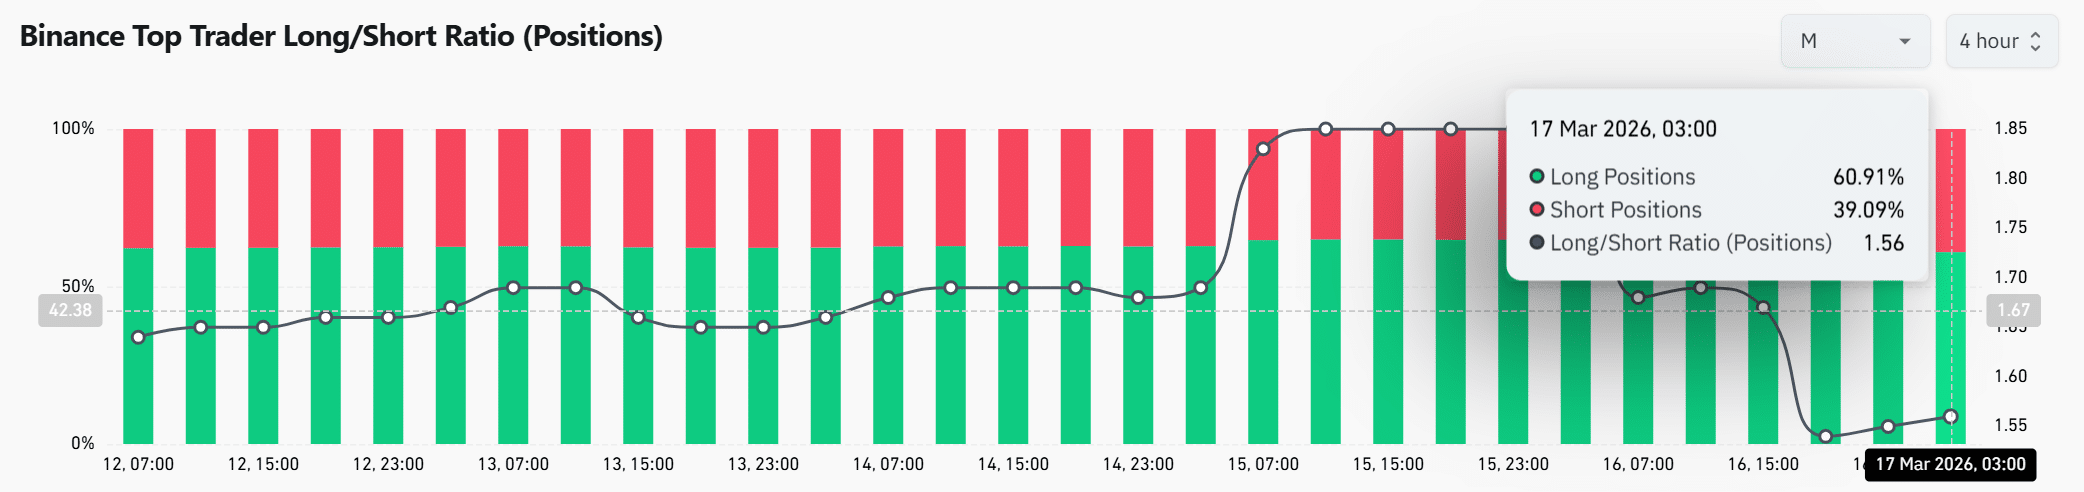
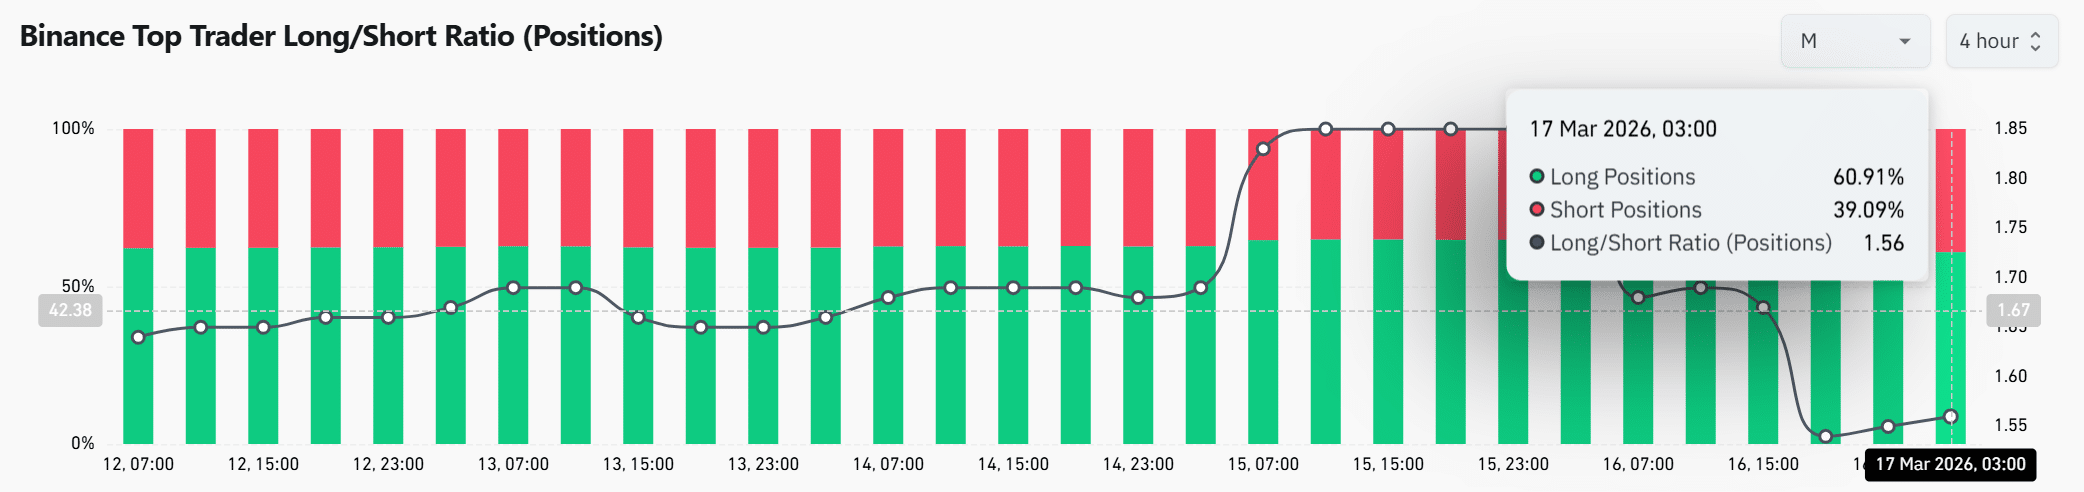
Binance top trader positioning showed a clear bias toward long exposure at press time, with 60.91% of positions favoring longs compared to 39.09% shorts.
This imbalance pushed the Long/Short Ratio to 1.56, reflecting growing confidence among large traders. As price has approached resistance, this positioning suggests that traders expect further upside rather than rejection.
However, such strong long dominance can also increase sensitivity to volatility if price fails to break higher.
Even so, the alignment between rising price and long positioning reinforces the bullish structure, indicating that MemeCore continues attracting directional conviction from experienced participants in the derivatives market.
Are short liquidations fueling the rally?
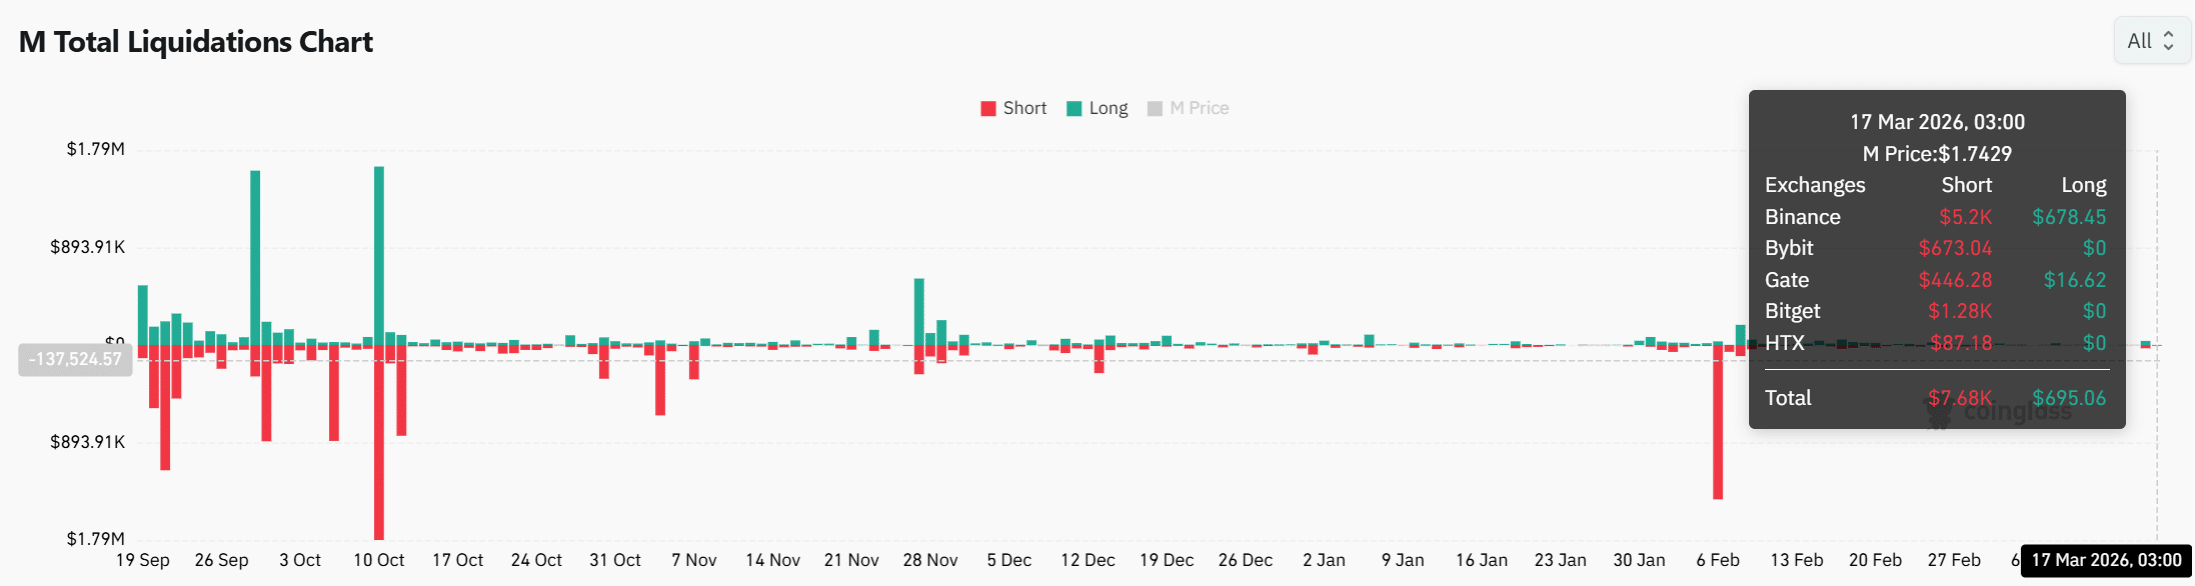
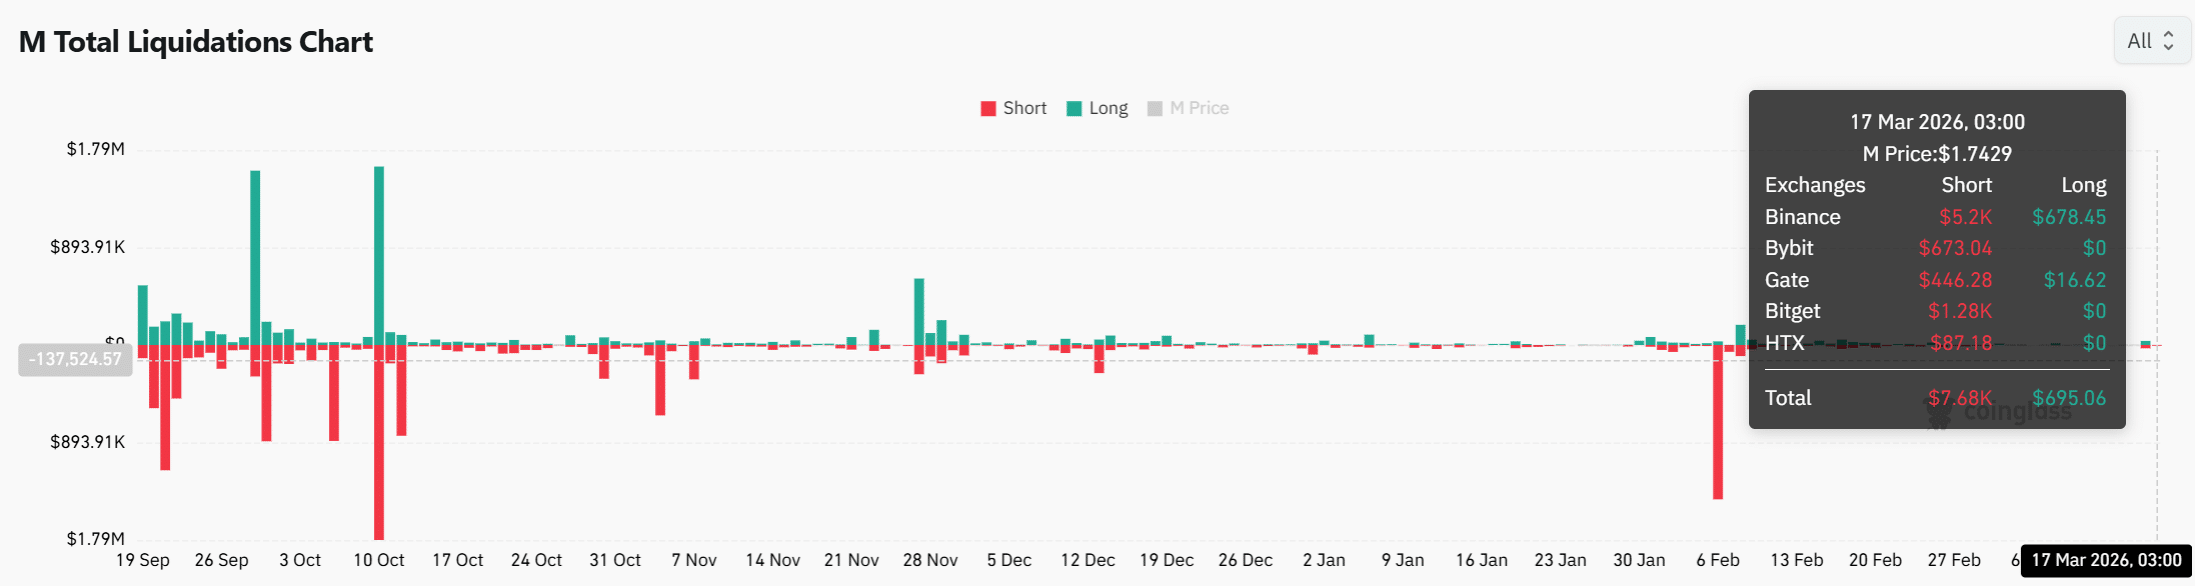
Liquidation data revealed that short positions have faced increasing pressure, particularly during recent upward spikes.
At the latest reading, short liquidations totaled around $7.68K, while long liquidations remained significantly lower, near $695, showing a clear imbalance.
This pattern indicated that sellers have been forced out as price moves higher, contributing to upward acceleration.
Additionally, repeated liquidation spikes across the timeline suggested that short traders have struggled to maintain positions during the rally.
This dynamic often amplifies price moves, as forced exits add to buying pressure. As a result, MemeCore’s recent advance appears partly driven by this squeeze effect.
MemeCore shows a strengthening structure supported by breakout behavior, rising derivatives conviction, and sustained short liquidations.
Price holds above compression levels while indicators continue improving steadily.
As long as this alignment persists, MemeCore appears positioned for continuation rather than reversal, with the $1.85 resistance acting as the immediate trigger for a broader upward expansion toward higher targets.
Final Summary
- Strong alignment between price action, derivatives conviction, and liquidations suggests MemeCore could continue trending upward.
- A failure to break resistance may trigger volatility as crowded long positioning increases downside risk in the short term.






