Measuring Market Asymmetry: The Glassnode Skew Index

insights.glassnodeОпубліковано о 2025-12-11Востаннє оновлено о 2025-12-11

Анотація

The Glassnode Skew Index is a new metric designed to measure market asymmetry by aggregating information across the entire volatility smile, rather than relying on the traditional 25-delta skew which only samples two points. It condenses the volatility curve into two components: DownVol (volatility from OTM puts, indicating downside protection and fear) and UpVol (volatility from OTM calls, reflecting bullish sentiment and upside speculation). The index is calculated as UpVol minus DownVol. Positive values suggest optimism and call buying dominance, while negative values indicate hedging and risk aversion. It helps identify sentiment regimes, confirm or contradict price movements, and analyze different tenors for layered market outlooks. Available for multiple assets and tenors, it provides a standardized, cross-exchange view of options market sentiment.

When assessing options markets, one of the most powerful signals is skew: how the market prices risk on the upside versus the downside. The standard approach for traders is to look at the 25-delta skew: a simple comparison between the implied volatility of a 25-delta call and a 25-delta put. This method is effective, simple and familiar, but it samples only two points on the volatility curve. As a result, it often misses structure embedded in the rest of the surface.

The Glassnode Skew Index addresses this by aggregating information across the full smile, producing a more robust signal of where risk is being priced. We explain the purpose of the new metric, how it is constructed, and how it can fit into the broader toolkit of options analysis.

To access the new metrics visit Glassnode Studio. Available to Professional plan users.

View metric

Introducing the Glassnode Skew Index

Instead of focusing on two isolated strikes, the Glassnode Skew Index condenses the entire shape of the volatility smile into a single, intuitive measure of market asymmetry.

We divide the curve into two regions: one representing downside risk, and one representing upside potential. Each region is transformed into a standardized volatility measure as we calculate how much volatility the market is pricing into that segment.

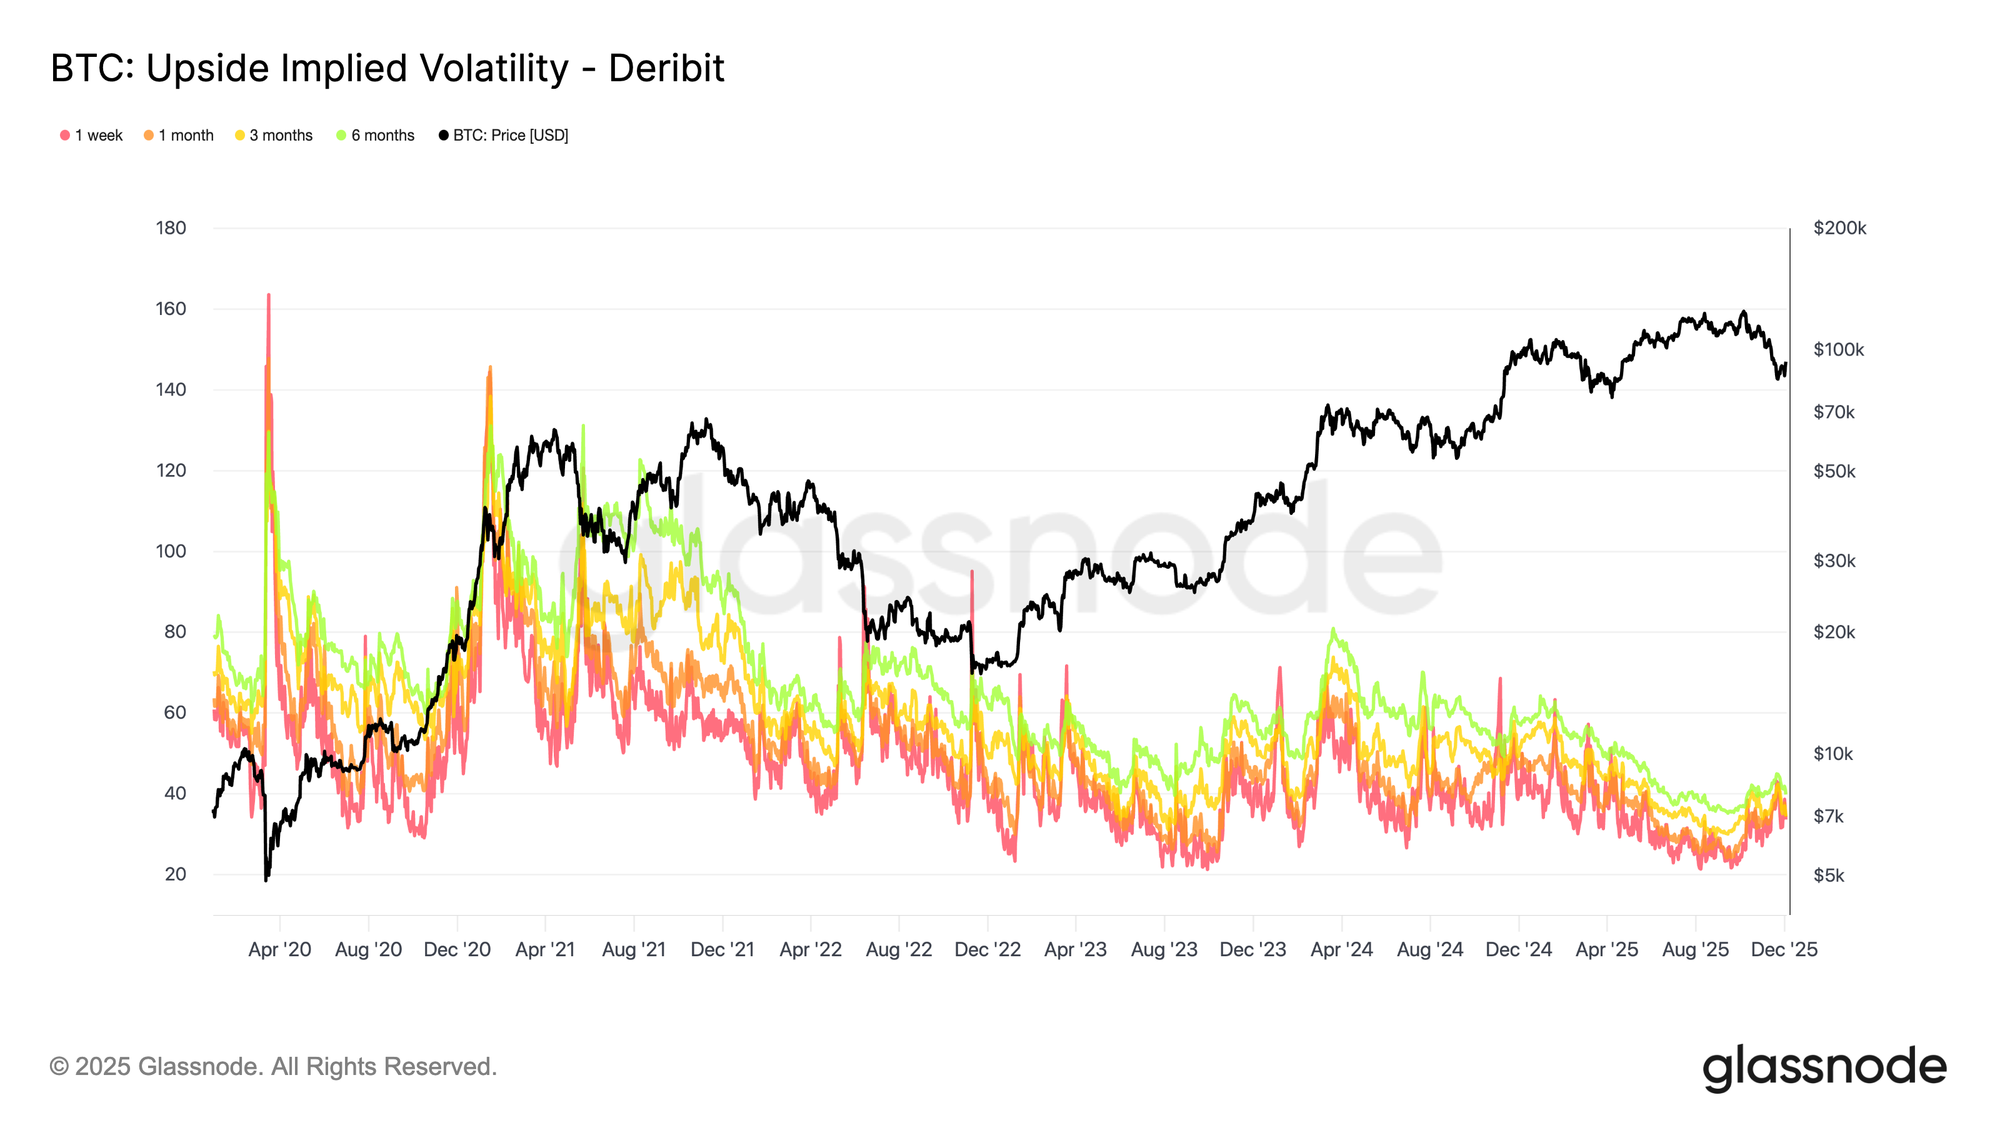
  • DownVol represents the total implied volatility from out-of-the-money put options — protection against falling prices. When traders rush to buy puts, DownVol rises, signalling fear or a desire to hedge.
  • UpVol captures the opposite: the total volatility priced into out-of-the-money call options. This reflects how much traders are willing to pay for upside exposure or potential short-squeeze gains. When call demand increases, UpVol rises, often alongside strong bullish sentiment.

The difference between these two components gives us the skew index: Glassnode Skew Index = UpVol - DownVol

  • Positive values indicate a market that’s paying more for upside volatility – typically driven by optimism, momentum, or speculative call buying.
  • Negative values mean downside protection dominates, as investors prioritize safety and hedging over chasing upside.

In practical terms, The Glassnode Skew Index shows whether option traders are more concerned about a crash down, or more excited about a breakout up – and by how much.
How to Use the Skew Index

The Skew Index can be applied in several ways to interpret options market positioning, identify sentiment regimes, and understand how traders are distributing risk across upside and downside scenarios.

Map the Current Sentiment Regime

The index can help contextualize prevailing market conditions:

  • Deeply negative values indicate a market that is paying a premium for downside protection, consistent with defensive positioning.
  • Strongly positive values indicate that investors are paying more for upside participation, often in the context of strong trends and speculative call activity.

Monitoring these extremes helps identify when fear or euphoria dominates the options market.

Use it as a Confirmation or Divergence Tool

The index can complement movements in spot price:

  • A rising Skew Index alongside a rising spot price suggests that the options market is reinforcing the move through increased demand for upside volatility.
  • A rally in spot with a Skew Index that stays sharply negative points to a distrusted move, where traders remain hedged and cautious.
  • A falling market with a heavily negative Skew Index confirms a classic risk-off environment with significant demand for protection.
  • A falling market with a positive Skew Index can indicate that traders are already looking through the weakness and positioning for a recovery.

This makes the index useful for evaluating whether options flows validate or contradict price action.

Interpreting Tenor Combinations

Different tenors can convey different layers of sentiment:

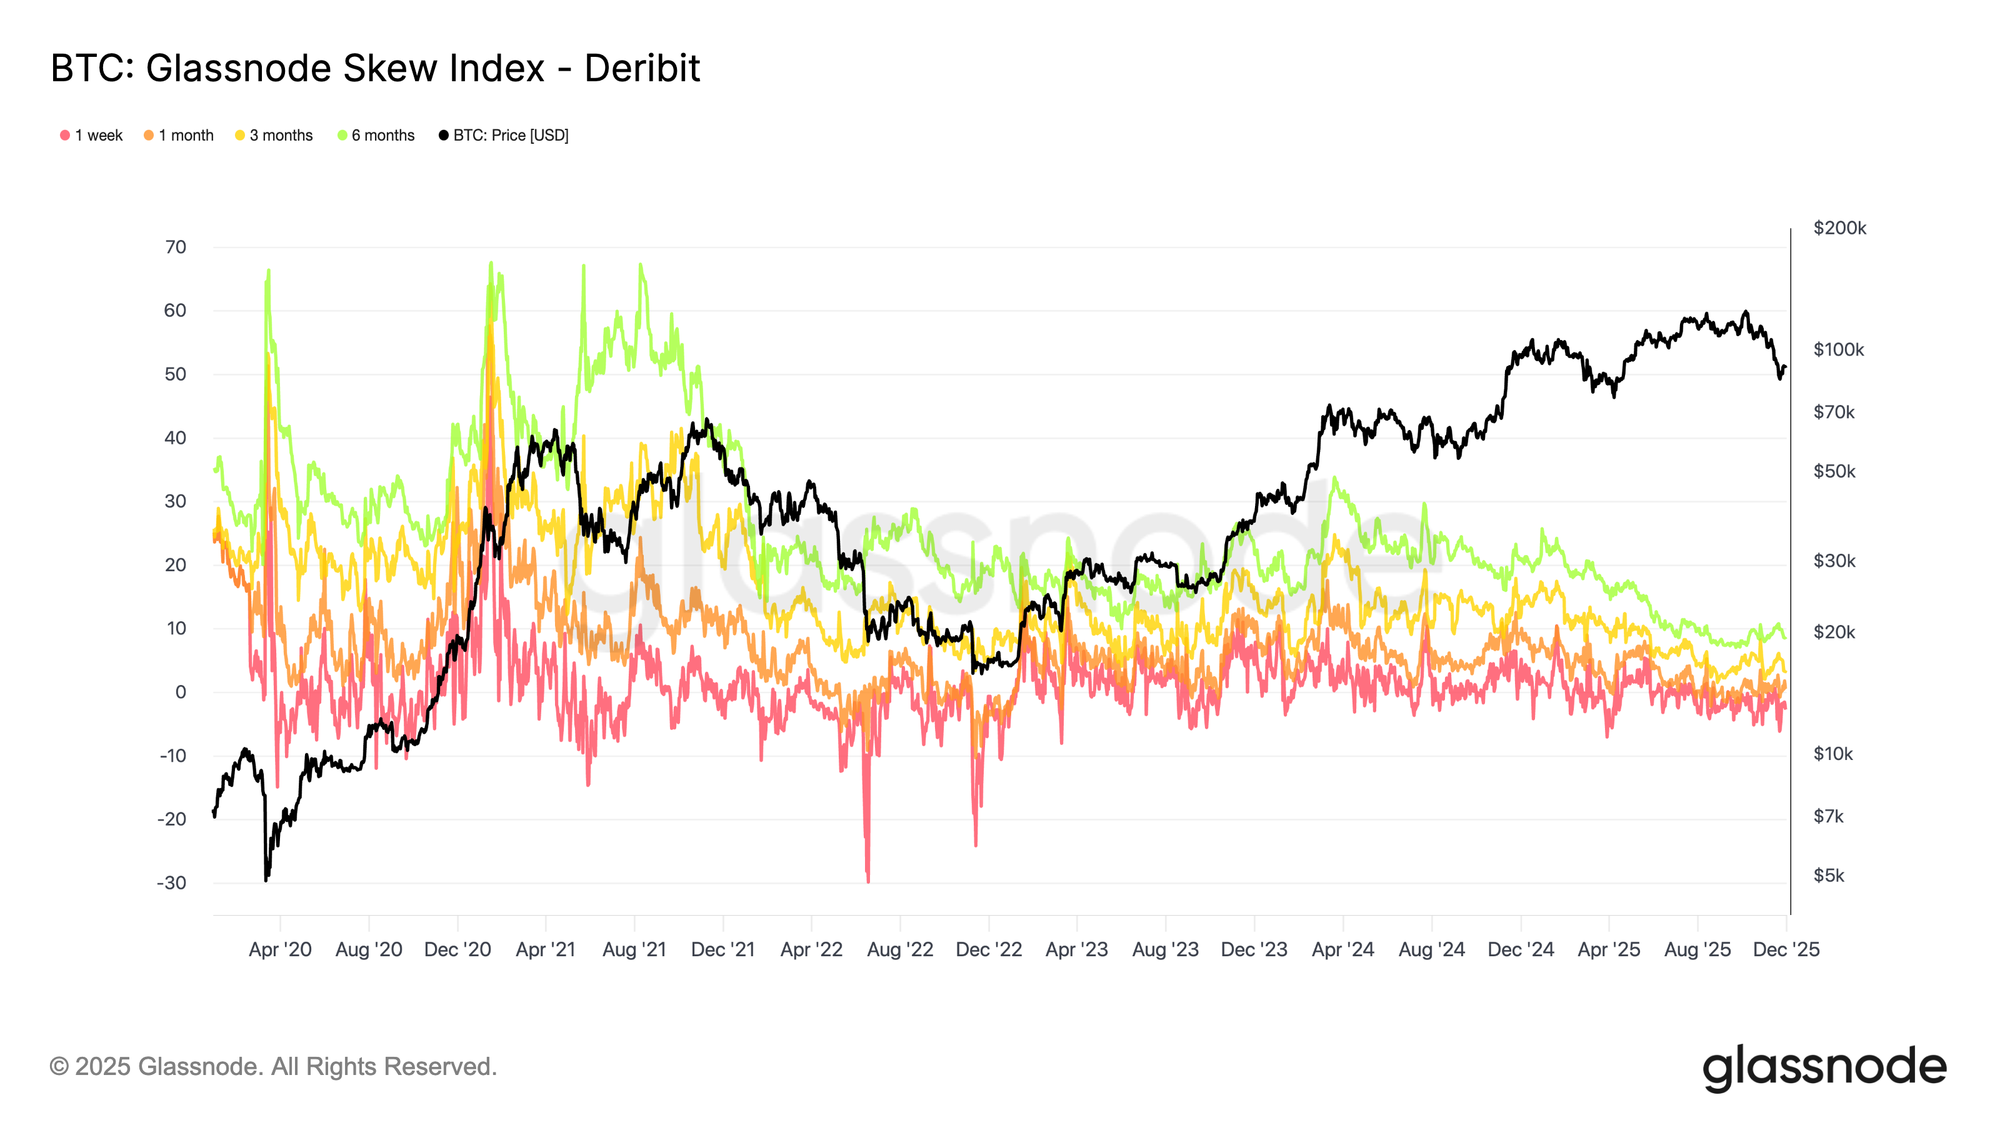
  • A negative 1-week skew with neutral or positive 3- and 6-month values often indicates temporary stress overlaying a constructive medium- and long-term outlook.
  • A very positive 1-week skew with subdued longer tenors suggests that traders are enthusiastic about the near-term, but reluctant to extend risk far into the future.
  • When skew is consistently elevated or depressed across all tenors, it points to a stable, regime-like sentiment environment rather than a short-lived spike.

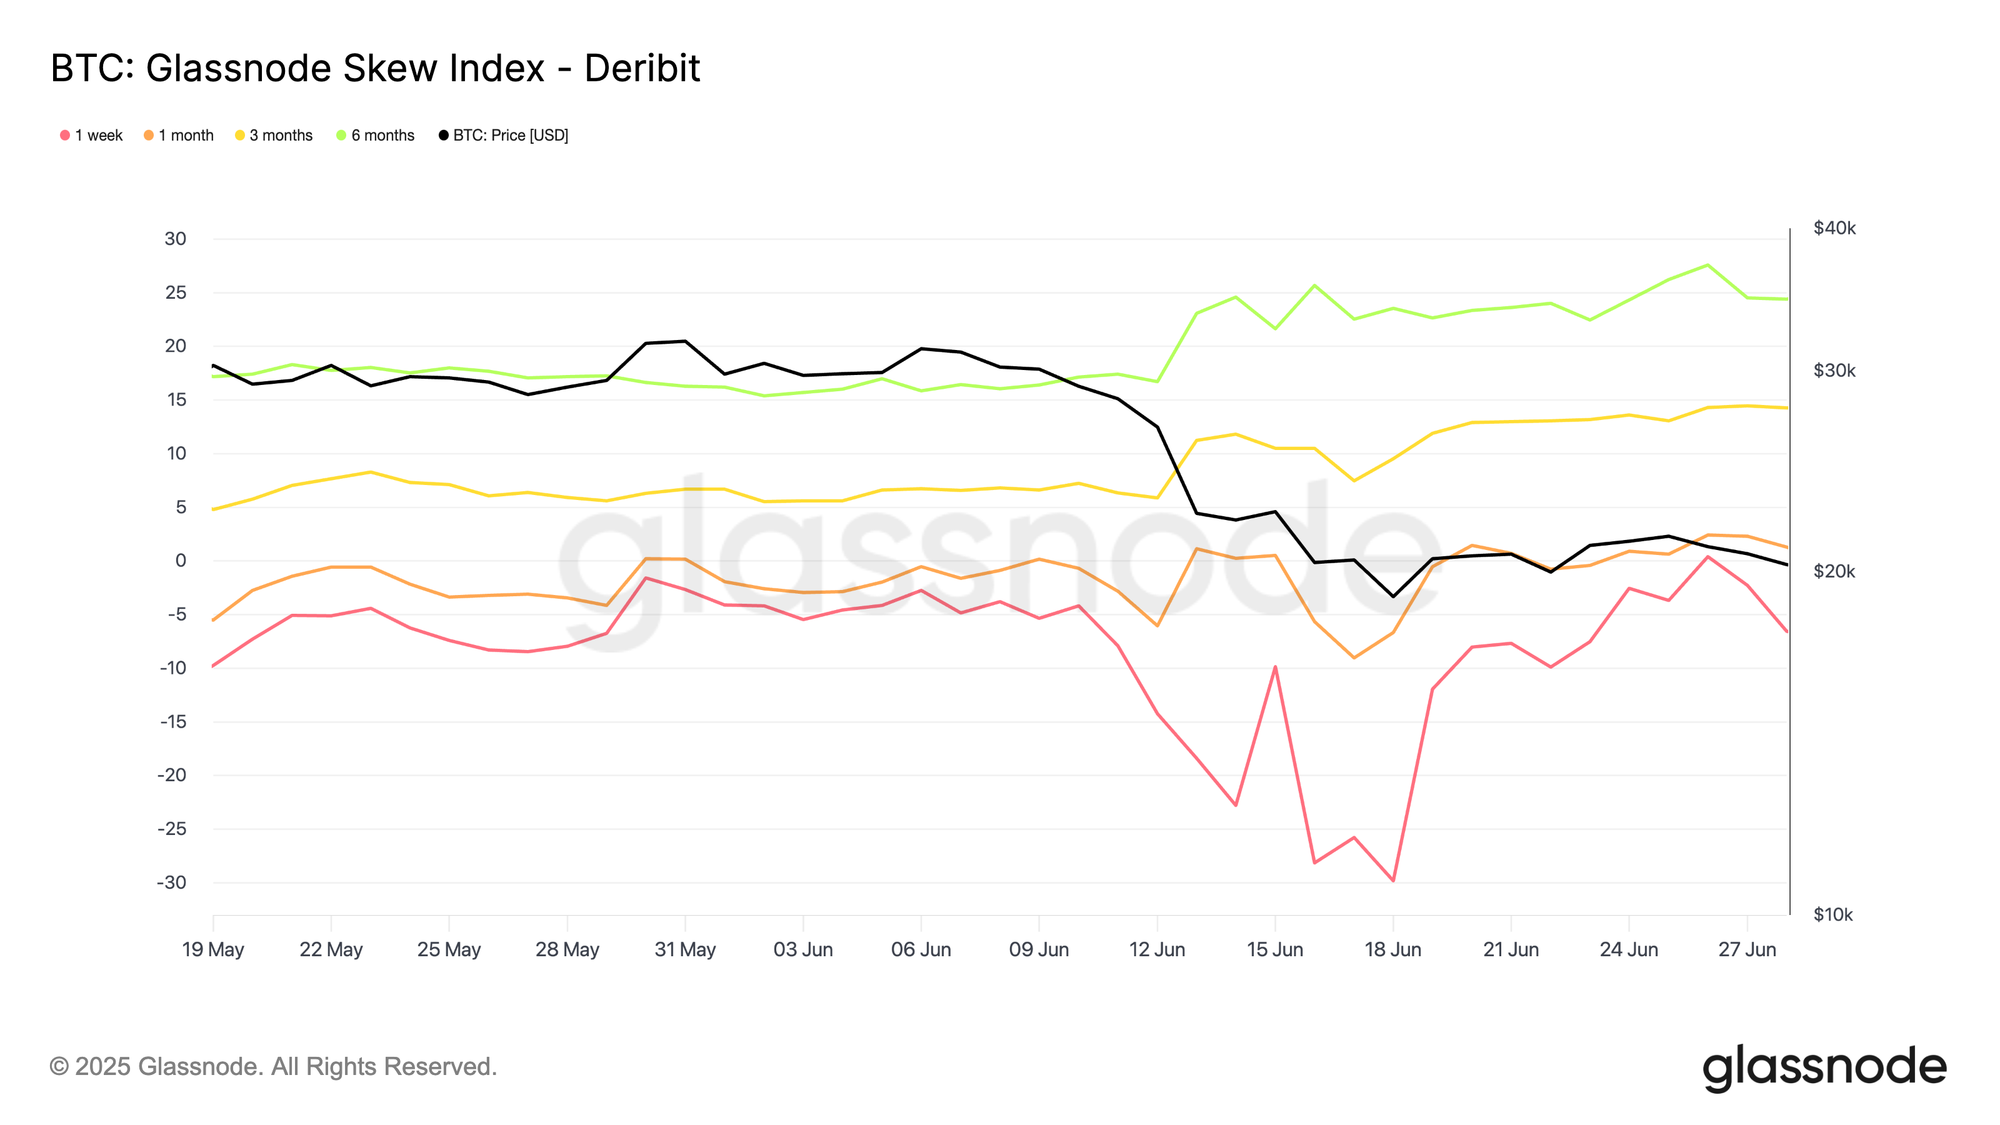
For example, in June 2022, we saw a clear tenor divergence: the 1-week Skew Index (red) plunged into deeply negative territory, signalling aggressive demand for short-dated puts over calls. Meanwhile, the 3-month (yellow) and 6-month (green) skews moved higher, indicating that investors were still willing to pay relatively more for upside exposure further out the curve.

In other words, the fear was mainly short-term, and longer-dated options continued to lean towards upside scenarios, implying that many participants expect better prices further out on the horizon.
How it works under the hood

We calculate the Glassnode Skew Index by aggregating option prices across many strikes on both sides of the distribution. These prices are transformed into standardized measures of upside and downside implied volatility, aligned to fixed maturities such as 1 week, 1 month, 3 months, and 6 months.

We then combine data across major venues so traders can compare BTC, ETH, SOL, XRP, or PAXG on consistent terms. This standardization removes the distortions that arise from strike irregularities, liquidity gaps, or exchange-specific conventions.

The result is a cross-asset, cross-tenor gauge of options market sentiment that captures the full structure of the volatility smile rather than relying on a single-point skew measure.

Available for:

  • Resolutions: 10 minutes, hourly, daily
  • Tenors: 1 week, 1 month, 3 months, 6 months
  • Assets: BTC, ETH, SOL, XRP, PAXG
  • Exchanges: Deribit, OKX

  • Follow us on X for timely market updates and analysis
  • Join our Telegram channel for regular market insights
  • For on-chain metrics, dashboards, and alerts, visit Glassnode Studio

Disclaimer: This report is for informational and educational purposes only. The analysis represents a limited case study with significant constraints and should not be interpreted as investment advice or definitive trading signals. Past performance patterns do not guarantee future results. Always conduct thorough due diligence and consider multiple factors before making investment decisions.


Трендові криптовалюти

Пов'язані матеріали

Misjudged A-Shares: Resilience, Expectations, and Confidence

China's A-share market recently faced selling pressure, especially in tech sectors, initially triggered by a global tech sell-off that began in South Korea. However, the article argues this is a case of "mistaken injury" and highlights the market's underlying resilience. This resilience stems from three main pillars: **1) Tech Sector Fundamentals:** Unlike Korea's market dominated by a few memory chip stocks, China's tech sector is diversified across computing, communications, electronics, and semiconductors, supported by dual narratives of global AI supply chains and domestic substitution. Core areas like optical modules and fiber optics continue to show strong earnings growth. **2) "National Team" Support:** State-backed institutions and large corporations have made significant market purchases and announced buybacks, providing liquidity and signaling confidence. This is seen as a stabilizing policy signal, often associated with market bottoms. **3) Broader Market Pillars:** Other major sectors are showing endogenous recovery momentum. Consumer stocks benefit from stabilizing CPI and signs of sector recovery (e.g., liquor price hikes). Cyclical sectors like aluminum have high earnings, potential price increases due to tight supply, and low valuations. The financial sector offers stable dividends and low valuations. The conclusion is that the sell-off was driven by external contagion, not a collapse in fundamentals. With strong policy support and recovering momentum across key sectors, the A-share market possesses the toughness to regain stability.

marsbit6 хв тому

Misjudged A-Shares: Resilience, Expectations, and Confidence

marsbit6 хв тому

The Clarity Act's Journey Through Congress: The Thorny Path of Bipartisan Compromise in the U.S.

The U.S. Congress is struggling to advance the crypto market structure bill known as the Clarity Act, with bipartisan compromise proving difficult. Key hurdles include unresolved disputes over "yield" products and, more critically, the inclusion of strong ethics provisions for elected officials—a non-negotiable demand for many Democrats. While a compromise on yield was reached in May, securing only limited Democratic support in committee, the separate Senate Agriculture Committee version later passed with no Democratic votes due to the ethics impasse. As Republicans push for a full Senate vote in July, demands for ethics rules have expanded, and other contentious issues like developer protections and concerns from law enforcement and large banks further complicate negotiations. Despite consensus on the need for legislation, the path forward is unclear. Recent discussions between senators and White House officials aim to find acceptable ethics language. Some lawmakers question whether a compromise text can garner enough bipartisan support, with one Democrat stating the current proposal lacks the strong ethics provisions required for their vote. Potential short-term goals for the crypto community include symbolic Senate action before the August recess, a longer-term aim for passage by 2026, or establishing a detailed framework that addresses ethics and other compromises. The process remains arduous, relying on the traditional, vote-by-vote effort to build bipartisan support.

marsbit26 хв тому

The Clarity Act's Journey Through Congress: The Thorny Path of Bipartisan Compromise in the U.S.

marsbit26 хв тому

Are Kalshi and Polymarket Founders at Odds? This Business Rivalry Is More Brutal Than You Think

"The Rivalry Between Kalshi and Polymarket Founders Turns Bitter and Litigious" The intense feud between Tarek Mansour, CEO of Kalshi, and Shayne Coplan, founder of Polymarket, has escalated far beyond typical business competition into personal animosity and regulatory battles. Both lead billion-dollar prediction market platforms, but their approaches differ sharply. Kalshi positions itself as the compliant operator, securing U.S. regulatory approval before launching. In contrast, Polymarket initially operated offshore, allowing U.S. users to access its platform via VPN, which drew regulatory scrutiny. The conflict reached a peak in November 2024 when FBI agents raided Coplan's New York apartment. While Coplan publicly blamed political motives, his team privately suspected Kalshi was involved. According to sources, Kalshi's lawyers had previously reported Polymarket's operations to federal prosecutors, highlighting its accessibility to U.S. users despite a ban. This incident fueled mutual accusations and underhanded tactics, including social media smear campaigns and attempts to sabotage each other's major business deals. Their rivalry also played out in Washington, influencing regulatory debates. Kalshi actively lobbied against Polymarket's practices, framing them as illegal and unethical. Polymarket, after facing a CFTC fine and investigation, later acquired a licensed U.S. firm to launch a domestic app, regaining a foothold. Despite the hostility, both companies have seen massive growth, with combined trading volumes soaring. However, increased regulatory scrutiny, particularly around insider trading on Polymarket's platform, continues to pose challenges. The founders' deep-seated mutual disdain ensures their battle for market dominance remains as much a personal vendetta as a commercial one.

marsbit34 хв тому

Are Kalshi and Polymarket Founders at Odds? This Business Rivalry Is More Brutal Than You Think

marsbit34 хв тому

Торгівля

Спот

Популярні статті

Як купити ONE

Ласкаво просимо до HTX.com! Ми зробили покупку Harmony (ONE) простою та зручною. Дотримуйтесь нашої покрокової інструкції, щоб розпочати свою криптовалютну подорож.Крок 1: Створіть обліковий запис на HTXВикористовуйте свою електронну пошту або номер телефону, щоб зареєструвати обліковий запис на HTX безплатно. Пройдіть безпроблемну реєстрацію й отримайте доступ до всіх функцій.ЗареєструватисьКрок 2: Перейдіть до розділу Купити крипту і виберіть спосіб оплатиКредитна/дебетова картка: використовуйте вашу картку Visa або Mastercard, щоб миттєво купити Harmony (ONE).Баланс: використовуйте кошти з балансу вашого рахунку HTX для безперешкодної торгівлі.Треті особи: ми додали популярні способи оплати, такі як Google Pay та Apple Pay, щоб підвищити зручність.P2P: Торгуйте безпосередньо з іншими користувачами на HTX.Позабіржова торгівля (OTC): ми пропонуємо індивідуальні послуги та конкурентні обмінні курси для трейдерів.Крок 3: Зберігайте свої Harmony (ONE)Після придбання Harmony (ONE) збережіть його у своєму обліковому записі на HTX. Крім того, ви можете відправити його в інше місце за допомогою блокчейн-переказу або використовувати його для торгівлі іншими криптовалютами.Крок 4: Торгівля Harmony (ONE)Легко торгуйте Harmony (ONE) на спотовому ринку HTX. Просто увійдіть до свого облікового запису, виберіть торгову пару, укладайте угоди та спостерігайте за ними в режимі реального часу. Ми пропонуємо зручний досвід як для початківців, так і для досвідчених трейдерів.

428 переглядів усьогоОпубліковано 2024.12.12Оновлено 2026.06.02

Як купити ONE

Обговорення

Ласкаво просимо до спільноти HTX. Тут ви можете бути в курсі останніх подій розвитку платформи та отримати доступ до професійної ринкової інформації. Нижче представлені думки користувачів щодо ціни ONE (ONE).

活动图片